
- Current
- Browse
- Collections
-
For contributors
- For Authors
- Instructions to authors
- Article processing charge
- e-submission
- For Reviewers
- Instructions for reviewers
- How to become a reviewer
- Best reviewers
- For Readers
- Readership
- Subscription
- Permission guidelines
- About
- Editorial policy
Articles
- Page Path
- HOME > Diabetes Metab J > Volume 44(2); 2020 > Article
-
ReviewBasic Research The Role of CD36 in Type 2 Diabetes Mellitus: β-Cell Dysfunction and Beyond
-
Jun Sung Moon
 , Udayakumar Karunakaran, Elumalai Suma, Seung Min Chung, Kyu Chang Won
 -
Diabetes & Metabolism Journal 2020;44(2):222-233.
DOI: https://doi.org/10.4093/dmj.2020.0053
Published online: April 23, 2020
Department of Internal Medicine, Yeungnam University College of Medicine, Daegu, Korea.
- Corresponding author: Kyu Chang Won. Department of Internal Medicine, Yeungnam University College of Medicine, 170 Hyeonchung-ro, Nam-gu, Daegu 42415, Korea. kcwon@med.yu.ac.kr
- *Jun Sung Moon and Udayakumar Karunakaran equally contributed to this study as first authors.
• Received: March 6, 2020 • Accepted: March 25, 2020
Copyright © 2020 Korean Diabetes Association
This is an Open Access article distributed under the terms of the Creative Commons Attribution Non-Commercial License (http://creativecommons.org/licenses/by-nc/4.0/) which permits unrestricted non-commercial use, distribution, and reproduction in any medium, provided the original work is properly cited.
- ABSTRACT
- INTRODUCTION
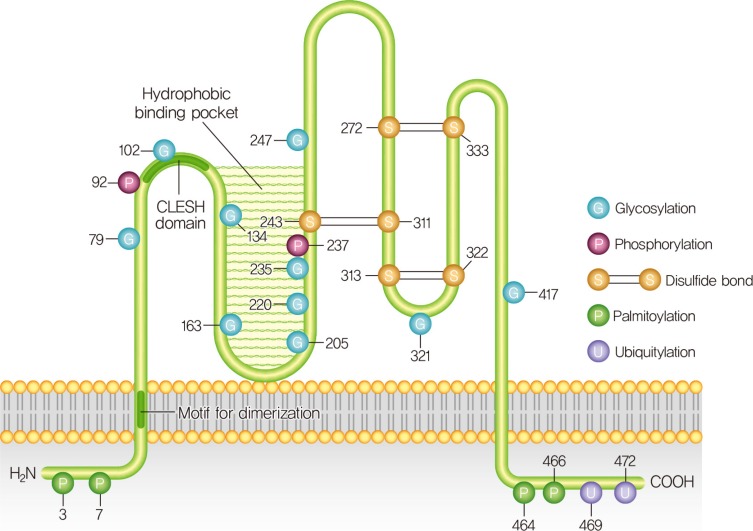
- CD36 STRUCTURE AND FUNCTIONAL REGULATION
- CD36 ROLE IN PANCREATIC β-CELL DYSFUNCTION DURING HYPERGLYCEMIA
- CD36 ON LIPOTOXICITY MEDIATED β-CELL DYSFUNCTION
- ROLE OF OX-LDL AND CD36 LINKS IN PANCREATIC β-CELL DYSFUNCTION
- CLINICAL STUDIES ON ASSOCIATION BETWEEN CD36 AND METABOLIC DISORDERS
- CONCLUSIONS
- ACKNOWLEDGMENTS
- NOTES
- REFERENCES

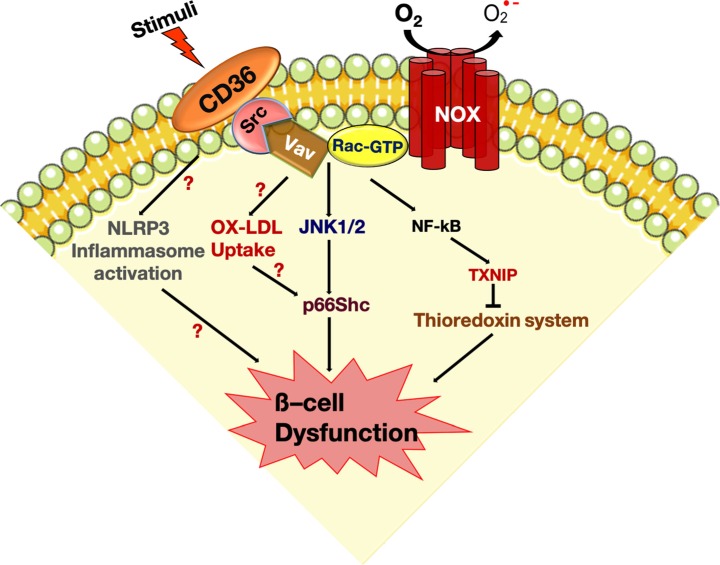
Figure & Data
References
Citations
Citations to this article as recorded by 
- Nrf2 inhibition regulates intracellular lipid accumulation in mouse insulinoma cells and improves insulin secretory function
Alpana Mukhuty, Samanwita Mandal, Chandrani Fouzder, Snehasis Das, Dipanjan Chattopadhyay, Tanmay Majumdar, Rakesh Kundu
Molecular and Cellular Endocrinology.2024; 581: 112112. CrossRef - CD36 gene variant rs1761667(G/A) as a biomarker in obese type 2 diabetes mellitus cases
Ashwin Kumar Shukla, Amreen Shamsad, Atar Singh Kushwah, Shalini Singh, Kauser Usman, Monisha Banerjee
Egyptian Journal of Medical Human Genetics.2024;[Epub] CrossRef - CD36 regulates macrophage and endothelial cell activation and multinucleate giant cell formation in anti neutrophil cytoplasm antibody vasculitis
Xiang Zhang, Catherine King, Alexander Dowell, Paul Moss, Lorraine Harper, Dimitrios Chanouzas, Xiong-zhong Ruan, Alan David Salama
Clinical Immunology.2024; 260: 109914. CrossRef - The association of soluble cluster of differentiation 36 with metabolic diseases: A potential biomarker and therapeutic target
Yun Li, Yaxi Chen, Xiong Z. Ruan
Pediatric Discovery.2023;[Epub] CrossRef - The role of candidate transport proteins in β‐cell long‐chain fatty acid uptake: Where are we now?
Christina Clavelo‐Farrow, Patricia Thomas
Diabetic Medicine.2023;[Epub] CrossRef - SARS-CoV-2 in the pancreas and the impaired islet function in COVID-19 patients
Ningfei Ji, Mingshun Zhang, Liang Ren, Yunyun Wang, Bicheng Hu, Jie Xiang, Yingyun Gong, Chaojie Wu, Guoqiang Qu, Wenqiu Ding, Zhiqiang Yin, Shan Li, Zhengxia Wang, Lianzheng Zhou, Xueqin Chen, Yuan Ma, Jinhai Tang, Yun Liu, Liang Liu, Mao Huang
Emerging Microbes & Infections.2022; 11(1): 1115. CrossRef - Is imaging-based muscle quantity associated with risk of diabetes? A meta-analysis of cohort studies
Shanhu Qiu, Xue Cai, Yang Yuan, Bo Xie, Zilin Sun, Tongzhi Wu
Diabetes Research and Clinical Practice.2022; 189: 109939. CrossRef - Lipotoxicity in a Vicious Cycle of Pancreatic Beta Cell Exhaustion
Vladimir Grubelnik, Jan Zmazek, Matej Završnik, Marko Marhl
Biomedicines.2022; 10(7): 1627. CrossRef - Association of cluster determinant 36, scavenger receptor class B type 1, and major facilitator superfamily domain containing the 2a genetic polymorphism with serum lipid profile in aging population with type 2 diabetes mellitus
Xixiang Wang, Xiaojun Ma, Jingjing Xu, Yujie Guo, Shaobo Zhou, Huiyan Yu, Linhong Yuan
Frontiers in Nutrition.2022;[Epub] CrossRef - CD36-Fatty Acid-Mediated Metastasis via the Bidirectional Interactions of Cancer Cells and Macrophages
Noorzaileen Eileena Zaidi, Nur Aima Hafiza Shazali, Thean-Chor Leow, Mohd Azuraidi Osman, Kamariah Ibrahim, Wan-Hee Cheng, Kok-Song Lai, Nik Mohd Afizan Nik Abd Rahman
Cells.2022; 11(22): 3556. CrossRef - The Past and Present Lives of the Intraocular Transmembrane Protein CD36
Rucui Yang, Qingping Liu, Mingzhi Zhang
Cells.2022; 12(1): 171. CrossRef - Implicating the effect of ketogenic diet as a preventive measure to obesity and diabetes mellitus
Sachin Kumar, Tapan Behl, Monika Sachdeva, Aayush Sehgal, Shilpa Kumari, Arun Kumar, Gagandeep Kaur, Harlokesh Narayan Yadav, Simona Bungau
Life Sciences.2021; 264: 118661. CrossRef - Contribution of rs3211938 polymorphism at CD36 to glucose levels, oxidized low-density lipoproteins, insulin resistance, and body mass index in Mexican mestizos with type-2 diabetes from western Mexico
Beatriz Teresita Martín-Márquez, Flavio Sandoval-Garcia, Mónica Vazquez-Del Mercado, Erika-Aurora Martínez-García, Fernanda-Isadora Corona-Meraz, Ana-Lilia Fletes-Rayas, Soraya-Amalí Zavaleta-Muñiz
Nutrición Hospitalaria.2021;[Epub] CrossRef - Investigating the association of CD36 gene polymorphisms (rs1761667 and rs1527483) with T2DM and dyslipidemia: Statistical analysis, machine learning based prediction, and meta-analysis
Ma’mon M. Hatmal, Walhan Alshaer, Ismail S. Mahmoud, Mohammad A. I. Al-Hatamleh, Hamzeh J. Al-Ameer, Omar Abuyaman, Malek Zihlif, Rohimah Mohamud, Mais Darras, Mohammad Al Shhab, Rand Abu-Raideh, Hilweh Ismail, Ali Al-Hamadi, Ali Abdelhay, Kanhaiya Singh
PLOS ONE.2021; 16(10): e0257857. CrossRef - Misregulation of Wnt Signaling Pathways at the Plasma Membrane in Brain and Metabolic Diseases
Mustafa Karabicici, Yagmur Azbazdar, Evin Iscan, Gunes Ozhan
Membranes.2021; 11(11): 844. CrossRef
 PubReader
 Cite
Cite- Figure
-

- Related articles
-
- Change Profiles and Functional Targets of MicroRNAs in Type 2 Diabetes Mellitus Patients with Obesity
- Regulation of Cellular Senescence in Type 2 Diabetes Mellitus: From Mechanisms to Clinical Applications
- Safety of COVID-19 Vaccines among Patients with Type 2 Diabetes Mellitus: Real-World Data Analysis


