Skip Navigation
Skip to contents

Diabetes Metab J : Diabetes & Metabolism Journal

Search
OPEN ACCESS

Articles

Page Path
HOME > Diabetes Metab J > Volume 42(5); 2018 > Article
Original Article
Epidemiology Development and Validation of the Korean Diabetes Risk Score: A 10-Year National Cohort Study
Kyoung Hwa Ha1,2, Yong-ho Lee3, Sun Ok Song4, Jae-woo Lee5, Dong Wook Kim6, Kyung-hee Cho7, Dae Jung Kim1,2orcid
Diabetes & Metabolism Journal 2018;42(5):402-414.
DOI: https://doi.org/10.4093/dmj.2018.0014
Published online: July 6, 2018
  • 6,882 Views
  • 122 Download
  • 22 Web of Science
  • 21 Crossref
  • 23 Scopus

1Department of Endocrinology and Metabolism, Ajou University School of Medicine, Suwon, Korea.

2Cardiovascular and Metabolic Disease Etiology Research Center, Ajou University School of Medicine, Suwon, Korea.

3Department of Internal Medicine, Yonsei University College of Medicine, Seoul, Korea.

4Department of Endocrinology and Metabolism, National Health Insurance Service Ilsan Hospital, Goyang, Korea.

5Department of Family Medicine, Chungbuk National University Hospital, Chungbuk National University College of Medicine, Cheongju, Korea.

6Policy Research Affairs, National Health Insurance Service Ilsan Hospital, Goyang, Korea.

7Department of Family Medicine, National Health Insurance Service Ilsan Hospital, Goyang, Korea.

corresp_icon Corresponding author: Dae Jung Kim. Department of Endocrinology and Metabolism, Ajou University School of Medicine, 164 World cup-ro, Yeongtong-gu, Suwon 16499, Korea. djkim@ajou.ac.kr
• Received: January 22, 2018   • Accepted: April 16, 2018

Copyright © 2018 Korean Diabetes Association

This is an Open Access article distributed under the terms of the Creative Commons Attribution Non-Commercial License (http://creativecommons.org/licenses/by-nc/4.0/) which permits unrestricted non-commercial use, distribution, and reproduction in any medium, provided the original work is properly cited.

prev next
  • Background
    A diabetes risk score in Korean adults was developed and validated.
  • Methods
    This study used the National Health Insurance Service-National Health Screening Cohort (NHIS-HEALS) of 359,349 people without diabetes at baseline to derive an equation for predicting the risk of developing diabetes, using Cox proportional hazards regression models. External validation was conducted using data from the Korean Genome and Epidemiology Study. Calibration and discrimination analyses were performed separately for men and women in the development and validation datasets.
  • Results
    During a median follow-up of 10.8 years, 37,678 cases (event rate=10.4 per 1,000 person-years) of diabetes were identified in the development cohort. The risk score included age, family history of diabetes, alcohol intake (only in men), smoking status, physical activity, use of antihypertensive therapy, use of statin therapy, body mass index, systolic blood pressure, total cholesterol, fasting glucose, and γ glutamyl transferase (only in women). The C-statistics for the models for risk at 10 years were 0.71 (95% confidence interval [CI], 0.70 to 0.73) for the men and 0.76 (95% CI, 0.75 to 0.78) for the women in the development dataset. In the validation dataset, the C-statistics were 0.63 (95% CI, 0.53 to 0.73) for men and 0.66 (95% CI, 0.55 to 0.76) for women.
  • Conclusion
    The Korean Diabetes Risk Score may identify people at high risk of developing diabetes and may be an effective tool for delaying or preventing the onset of condition as risk management strategies involving modifiable risk factors can be recommended to those identified as at high risk.
The increasing number of people with obesity has resulted in an increasing prevalence of diabetes in Korea [1]. Additionally, due to lower rates of both diabetes awareness and participation in health screening among young adults, it is important to identify at-risk asymptomatic individuals, especially in this age group.
Screening and early diagnosis of diabetes has considerable health benefits due to the ability to control glycemia and cardiovascular risk factors [2]. Additionally previous clinical trials have indicated that interventions targeting lifestyle factors and diabetes medication with people with impaired glucose tolerance can prevent or delay the onset of diabetes [34]. However, many diabetes risk assessment tools were developed based on specific ethnic groups, and the risk scores may not apply to other ethnic groups [56]. Although a diabetes risk score for the Korean population was developed using the Korea National Health and Nutrition Examination Survey (KNHANES), it did not reflect the incidence of diabetes [7]. Lim et al. [8] also developed a risk score to predict the 4-year risk of diabetes using the Korean Genome and Epidemiology Study (KoGES); however, it was developed using a limited cohort size, the score did not take into account long-term outcome, and the sample might not be representative of the general population of Korea.
The National Health Insurance Service-National Health Screening Cohort (NHIS-HEALS) was developed in 2002 as a random sample of 10% of the population between the ages of 40 and 79 years who completed a national health screening test in 2002 or 2003 and who were followed up through 2013. We therefore developed a 10-year Korean Diabetes Risk Score (KDRS) using the NHIS-HEALS.
Development and validation samples
We used the NHIS-HEALS to derive a diabetes risk equation. A detailed description of the study design and methods has been published previously [9]. In brief, the NHIS-HEALS cohort study enrolled 514,795 participants in 2002 or 2003. The database of this study contains demographic information, diagnoses, therapeutic procedures, drug prescriptions, date of death, and information from health examinations, such as health questionnaire surveys, physical examinations, and biochemical test results. For this study, we excluded people without variables used in the KDRS, people who had been diagnosed with diabetes (10th edition of the International Classification of Diseases [ICD-10] codes E10–E14), and those with a self-reported medical history of diabetes or a fasting blood glucose level of 126 mg/dL or greater in 2002 or 2003. Thus, 359,349 people were included at baseline. The incidence of diabetes was defined in terms of receiving a prescription for diabetes medication (Anatomical Therapeutic Chemical [ATC] code A10) or a fasting blood glucose level of 126 mg/dL or greater. The end of follow-up was the event of diabetes, death, or the end of the study period (December 31, 2013). Data on family history of diabetes, alcohol consumption, smoking status, and physical activity were obtained from self-report questionnaires. Use of antihypertensive (ATC codes C02–C03 or C07–C09) and statin (ATC code C10AA) therapy was ascertained based on drug prescriptions. Body mass index (BMI) was calculated as weight (kg) divided by height squared (m2) and classified according to Asian-specific criteria [10] as follows: underweight (<18.5 kg/m2), normal weight (18.5 to 22.9 kg/m2), overweight (23.0 to 24.9 kg/m2), obese class I (25.0 to 29.9 kg/m2), and obese class II (≥30.0 kg/m2). Fasting blood samples were taken to measure total cholesterol, glucose, and γ glutamyl transferase (GGT) levels.
The Ansung-Ansan Cohort Study, which is part of the KoGES, was used for external validation. This population-based cohort was used in an epidemiological study of rural and urban communities in Korea. The baseline survey was completed in 2001 or 2002, and follow-up examinations are ongoing biennially. A detailed description of the study design and methods has been published previously [11]. The Ansung-Ansan Cohort study enrolled 10,030 participants who were aged 40 to 69 years in 2001 or 2002. We excluded people without variables used in the KDRS and people with diabetes. Diabetes was defined as a fasting blood glucose level of ≥126 mg/dL, a 2-hour glucose level of ≥200 mg/dL in a 75-g oral glucose tolerance test, a glycosylated hemoglobin (HbA1c) level ≥6.5%, or a self-reported medical history of diabetes. The end of follow-up was the event of diabetes or the last examination. Data on family history of diabetes, alcohol consumption, smoking status, physical activity, and use of drugs were obtained from self-report questionnaires. Height, weight, and blood pressure were measured using standardized techniques and equipment. Blood samples were obtained after fasting for at least 12 hours.
Risk factors for diabetes
Our analysis included the following variables, which are known to affect diabetes risk: age (years), family history of diabetes (yes or no), alcohol intake (abstinent, low to medium, or high; only in men), smoking status (current, former, or non-smoker), physical activity (low, medium, or high), use of antihypertensive therapy (yes or no), use of statin therapy (yes or no), BMI (<18.5, 18.5 to 22.9, 23.0 to 24.9, 25.0 to 29.9, or ≥30.0 kg/m2), systolic blood pressure (<100, 100 to 119, 120 to 139, 140 to 159, or ≥160 mm Hg), total cholesterol (<240 or ≥240 mg/dL), fasting glucose (<70, 70 to 84, 85 to 99, 100 to 109, or ≥110 mg/dL), and GGT level (continuous; only in women).
Statistical analysis
We used the Cox proportional hazards model in the development dataset to estimate the coefficients and hazard ratios associated with each potential risk factor for the incidence of diabetes for men and women separately. The prognostic index, which is the sum of each coefficient multiplied by the confounder variable, was centered on the mean values of the risk factors to derive a risk equation for a 10-year follow-up [12]. We did not consider the interaction terms between the independent variables. We tested the performance of the KDRS in the development and validation dataset. Discrimination was evaluated by Harrell's C-statistic [13]. Calibration (prediction accuracy) was assessed using a calibration plot comparing the observed probabilities (from the 10-year Kaplan-Meier estimates) with the predicted probabilities within deciles of predicted risk. The times to outcome events were visualized using Kaplan-Meier graphs according to confounding factors. The difference in the Kaplan-Meier curves between groups was assessed using the log-rank test. All analyses were conducted using the SAS software version 9.4 (SAS Institute Inc., Cary, NC, USA).
Ethical consideration
The study protocol was reviewed and approved by the Ajou University Institutional Review Board (IRB) (IRB No. AJIRB-MED-OBS-16-509). Review board requirements for written informed consent were waived because all personal identifying information was removed from the dataset prior to analysis.
Table 1 presents the characteristics of the men and women in both cohorts. In the development cohort, the mean±standard deviation (SD) age at baseline was 51.2±9.2 years in men and 52.5±9.6 years in women. In the validation cohort, the mean±SD age at baseline was 50.4±8.4 years in men and 51.3±8.8 years in women. The median (interquartile range [IQR]) follow-up period was 10.8 years (IQR, 10.1 to 11.3 years) for the development cohort and 9.5 years (IQR, 3.8 to 9.7 years) for the validation cohort. We identified 37,678 cases of diabetes arising from 3,624,243 person-years (event rate=10.4 per 1,000 person-years) in the development cohort. In the validation cohort we identified 1,040 cases of diabetes from 46,028 person-years (event rate=22.6 per 1,000 person-years).
Table 2 lists the results of the Cox regression analysis for the development dataset. The risk of diabetes was significantly higher among people with a family history of diabetes, high levels of alcohol consumption (only in men), and low levels of physical activity as well as among users of antihypertensive or statin therapy and former/current smokers. The risk of diabetes increased with high BMI, systolic blood pressure, total cholesterol, or fasting glucose in men and women. In women, the risk increased with increasing GGT. People with fasting glucose values ≥110 mg/dL had the highest hazard ratio for the incidence of diabetes (men, 3.65; women, 3.83). The risk equation is provided in Supplementary Table 1.
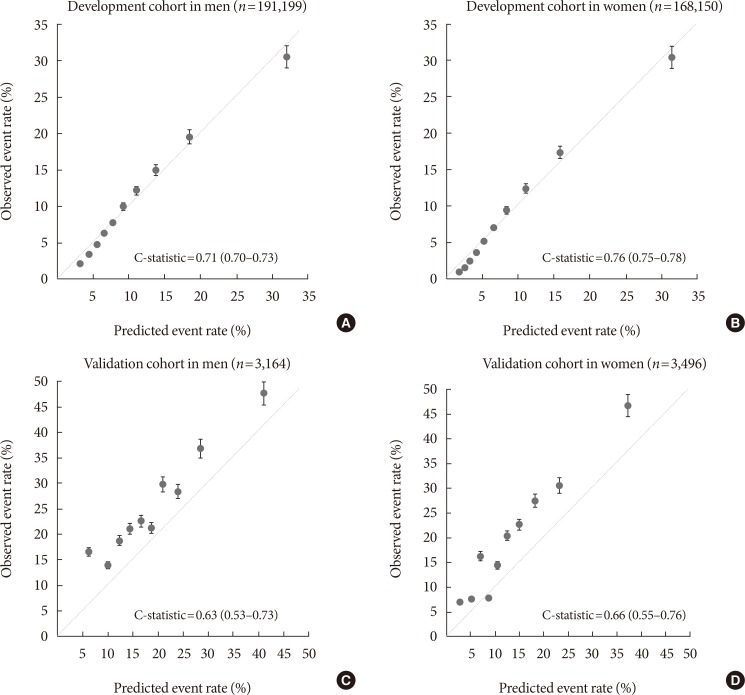
Fig. 1 compares the predicted and observed risks of a diabetes event at 10 years by decile of predicted risk. The predicted number of diabetes events in the top decile showed a pronounced deviation from the observed number of diabetes events, overestimating diabetes risk in the development cohort. However, the calibration plots in the validation cohort showed a predominance of underestimation.
The C-statistics for the models for risk at 10 years were 0.71 (95% confidence interval [CI], 0.70 to 0.73) in men and 0.76 (95% CI, 0.75 to 0.78) in women in the development dataset. In the validation dataset, the C-statistics for the models were 0.63 (95% CI, 0.53 to 0.73) in men and 0.66 (95% CI, 0.55 to 0.76) in women (Fig. 1).
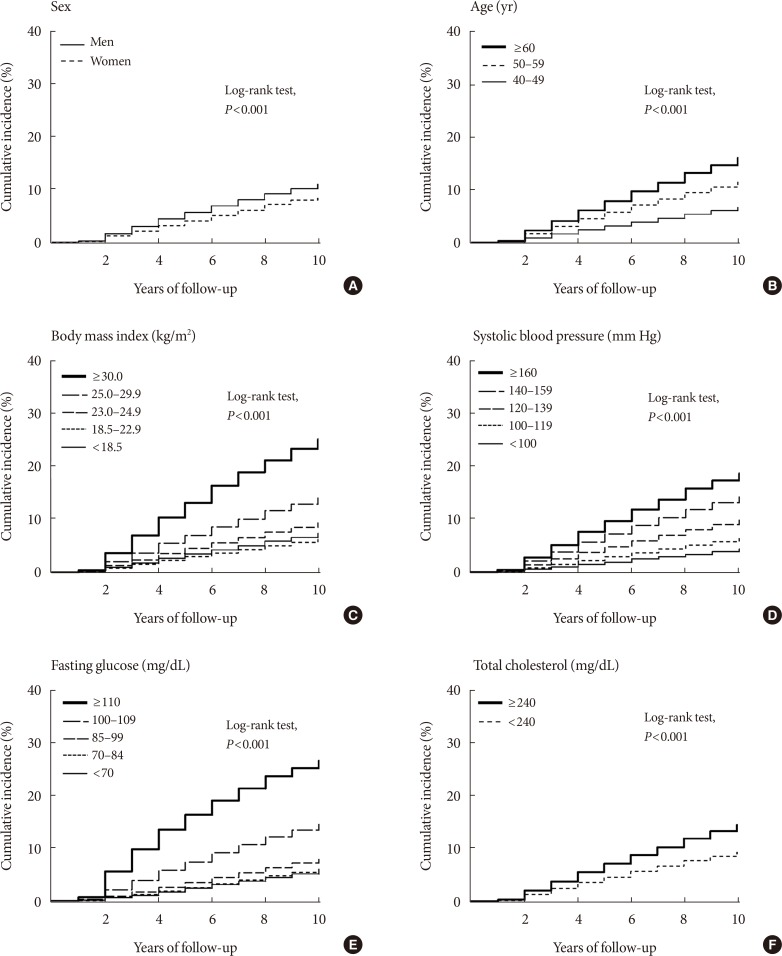
Time to diabetes event is presented as Kaplan-Meier plots in Fig. 2. There were significant differences between groups in sex, age, BMI, systolic blood pressure, fasting glucose, and total cholesterol (log-rank test, P<0.001 for all comparisons).
We developed and validated the KDRS, which identifies people at high risk for diabetes based on data from regular health screening tests in Korea. The prevalence of diabetes in Korea was 8.6 in 2001 and increased to 11.0% in 2013 [1]. In addition, coronary revascularization such as percutaneous coronary intervention and coronary artery bypass graft was performed 7 to 10 times higher in people with type 2 diabetes mellitus (T2DM) than in people without diabetes in Korea [14]. However, the awareness rate for diabetes is 70.7%, and the lower the age, the lower the awareness [15]; therefore, there is a need to establish a diabetes risk score for the Korean population. Established prediction models for diabetes have been developed and validated in various population-based cohorts [16]. However, risk scores developed in Caucasian populations might not perform accurately in Asian populations because of the different biological factors associated with the onset of diabetes: lowers BMI levels, younger ages, or earlier declines in β-cell function with the onset of diabetes in Asian populations [171819]. Although previous studies reported risk scores derived from Asian populations, these risk scores might not accurately predict the risk of diabetes due to the use of cross-sectional data [20], logistic regression models [21], or only short-term outcomes [222324]. In Korea, although discrimination was similar to KDRS, two risk scores for diabetes developed using different types of datasets, depending on the different purpose (Supplementary Table 2) [7825]. Lee et al. [7] developed diabetes score using the KNHANES to detect asymptomatic diabetes through simple questions. Lim et al. [8] developed diabetes score using cohort study to predict the incidence of diabetes through multiple risk factors. Although KDRS also developed to predict the incidence of diabetes, we used long-term outcomes and survival regression. In addition, because the risk score developed based on national regular health screening test, general population may calculate diabetes risk score based on results of health screening test without any additional examination, and may check diabetes risk score regularly.
The risk score was validated using a different population-based cohort in Korea. The score exhibited moderate discrimination in the external validation cohort. However, the predicted risk was underestimated in the external validation cohort. We used a different definition of diabetes in the development and validation cohorts; thus, the event rate was significantly higher in the validation dataset than in the development dataset. Moreover, differences in the definitions of clinical variables, such as the use of statins, may have also contributed to the underestimation. However, when definition of diabetes was applied equally to a fasting blood glucose level of ≥126 mg/dL or medical history of diabetes in the development and validation cohort, the event rate was 11.8 per 1,000 person-years, similar to the event rate of development set, and the C-statistic were 0.76 (95% CI, 0.63 to 0.87) for the men and 0.81 (95% CI, 0.68 to 0.91) for the women in the validation dataset, which was higher than the main analysis (data not shown).
Lifestyle factors, such as smoking, and low physical activity are well known that increase the risk of diabetes [2627]. However, the effect of alcohol consumption on diabetes is controversial. Recent meta-analysis reported that light and moderate alcohol consumption was associated with a lower risk of T2DM, whereas heavy alcohol consumption did not affect the incidence of T2DM [28]. Another meta-analysis reported that moderate alcohol consumption reduces the risk of diabetes in women, but a dose-response relationship beyond the threshold. However, there was no reduction in risk in Asian populations [29]. In Korea, in a community-based cohort study of Korean adults, heavy alcohol consumption was associated with an increased risk of diabetes, whereas the light and moderated consumption was associated with a decreased risk of diabetes [30]. However, using KNHANES data, high-risk groups based on the alcohol-use disorders identification test associated with a higher risk of diabetes in men, but not in women [31]. In addition, the proportion of individuals who were abstinent with regard to alcohol intake was higher in women than men (34.6% and 82.1% for men and women, respectively). Thus, we included alcohol consumption in risk score only in men. Instead of alcohol consumption, we included GGT in the risk score in women. GGT, which is a commonly used indicator of alcohol consumption or liver disease, may predict disease by acting as a cumulative biomarker of various environmental chemicals [32]. Exposure to several environmental irritants, such as persistent organic pollutants, may affect the risk for diabetes and obesity [33]. Additionally, a previous study reported that GGT was a predictor of diabetes in the Coronary Artery Risk Development in Young Adult study [34]. As a result, the C-index in the external validation cohort was higher in women than in men (0.63 and 0.66 for men and women, respectively).
We also determined the appropriate range of BMI and systolic blood pressure values for increasing the risk of developing diabetes by evaluating the risk associated with each category of variables. Obesity is one of the most important modifiable risk factors that can prevent diabetes. However, the effect of being underweight on the development of diabetes has been controversial. In the National Health and Nutrition Examination Survey, the prevalence of diabetes increased as the range of obesity class increased [35]. However, Sairenchi et al. [36] reported significant associations of low (<18.5 kg/m2) and high (≥30.0 kg/m2) BMIs with the risk of diabetes in participants aged 60 to 79 years using data from a large Japanese cohort, whereas a low BMI showed no significant association in participants aged 40 to 59 years. Our study also showed that underweight (BMI <18.5 kg/m2) individuals had a higher risk of diabetes than normal-weight (BMI 18.5 to 22.9 kg/m2) men and women, but this difference did not reach statistical significance. High blood pressure is also associated with increased risk for diabetes. In African Americans and Caucasians aged 35 to 54 years, higher blood pressure was associated with a higher risk of diabetes than normal blood pressure (systolic blood pressure/diastolic blood pressure, <120/80 mm Hg) [37]. In a community-based cohort study of Korean adults, people with prehypertension (120 to 139/80 to 89 mm Hg), stage 1 hypertension (140 to 159/90 to 99 mm Hg), and stage 2 hypertension (≥160/100 mm Hg) had a higher risk of developing diabetes than people in the normal range (<120/80 mm Hg) [38]. Additionally, the 2017 American College of Cardiology/American Heart Association Task Force on Clinical Practice Guidelines suggested that a blood pressure target of less than 130/80 mm Hg may be reasonable [39]. Our study showed that the risk of diabetes increased as systolic blood pressure increased; however, there was no significant association in men with a systolic blood pressure of 100 or less.
This study has several limitations. First, the 2-hour glucose and HbA1c levels have played important roles in the prediction of diabetes [84041], although fasting glucose is the recommended screening test. We did not include the results of a 2-hour oral glucose tolerance test or data on HbA1c levels. And, it is necessary to increase the accuracy of diabetes diagnosis by also measuring HbA1c when the fasting glucose is greater than 100 mg/dL in the national health screening. Second, self-reported data on such variables as physical activity and alcohol intake may have introduced measurement error and led to the underestimation of the predictive strength of the risk factors. Third, we could not discriminate between type 1 diabetes mellitus (T1DM) and T2DM. As T1DM affects about 0.02% of the Korean population [42], our data can be attributed to people with T2DM. Fourth, a previous study reported that BMI should not be included in risk scores [43] and that, in Korea, waist circumference was a better predictor of diabetes than BMI [7]. However, we did not include waist circumference. Additionally, we also did not consider triglyceride and high density lipoprotein cholesterol levels, which are known risk factors for diabetes [44]. Waist circumference, triglyceride, and high density lipoprotein cholesterol have been measured in the national health screening since 2009, and it is necessary to develop a prediction equation that includes these factors. Finally, dietary pattern such as red meat and sugar sweetened beverages intake increased risk of diabetes, while healthy diets such as fruit and vegetable intake decreased risk of diabetes [454647]. However, we didn't consider these effect for diabetes.
In conclusion, we developed and validated a 10-year KDRS. The score may help people who undergo national health screening in Korea to recognize the risk of diabetes and decide whether they should seek diabetes testing. Additionally, the score may be effective for delaying or preventing the onset of diabetes by underscoring the need to manage the modifiable risk factors.
Acknowledgements
This research was supported by a grant of the Korea Health Technology R&D Project through the Korea Health Industry Development Institute (KHIDI), funded by the Ministry of Health and Welfare, Republic of Korea (grant number: HI13C0715) and the National Health Insurance Service Ilsan Hospital grant (NHIMC 2016-03-001). This study used NHIS-HEALS data (NHIS-2017-2-347), made by National Health Insurance Service (NHIS) and the Korean Genome and Epidemiology Study data (KoGES; 2017-EPI-005).

CONFLICTS OF INTEREST: No potential conflict of interest relevant to this article was reported.

Supplementary Table 1

Equations and examples of Korean Diabetes Risk Score
dmj-42-402-s001.pdf

Supplementary Table 2

Summary of diabetes score in Korea
dmj-42-402-s002.pdf
  • 1. Ha KH, Kim DJ. Trends in the diabetes epidemic in Korea. Endocrinol Metab (Seoul) 2015;30:142-146. ArticlePubMedPMC
  • 2. Herman WH, Ye W, Griffin SJ, Simmons RK, Davies MJ, Khunti K, Rutten GE, Sandbaek A, Lauritzen T, Borch-Johnsen K, Brown MB, Wareham NJ. Early detection and treatment of type 2 diabetes reduce cardiovascular morbidity and mortality: a simulation of the results of the Anglo-Danish-Dutch Study of intensive treatment in people with screen-detected diabetes in primary care (ADDITION-Europe). Diabetes Care 2015;38:1449-1455. ArticlePubMedPMCPDF
  • 3. Knowler WC, Barrett-Connor E, Fowler SE, Hamman RF, Lachin JM, Walker EA, Nathan DM. Diabetes Prevention Program Research Group. Reduction in the incidence of type 2 diabetes with lifestyle intervention or metformin. N Engl J Med 2002;346:393-403. ArticlePubMedPMC
  • 4. Tuomilehto J, Lindstrom J, Eriksson JG, Valle TT, Hamalainen H, Ilanne-Parikka P, Keinanen-Kiukaanniemi S, Laakso M, Louheranta A, Rastas M, Salminen V, Uusitupa M. Finnish Diabetes Prevention Study Group. Prevention of type 2 diabetes mellitus by changes in lifestyle among subjects with impaired glucose tolerance. N Engl J Med 2001;344:1343-1350. ArticlePubMed
  • 5. Glumer C, Vistisen D, Borch-Johnsen K, Colagiuri S. DETECT-2 Collaboration. Risk scores for type 2 diabetes can be applied in some populations but not all. Diabetes Care 2006;29:410-414. ArticlePubMedPDF
  • 6. Rathmann W, Martin S, Haastert B, Icks A, Holle R, Lowel H, Giani G. KORA Study Group. Performance of screening questionnaires and risk scores for undiagnosed diabetes: the KORA Survey 2000. Arch Intern Med 2005;165:436-441. ArticlePubMed
  • 7. Lee YH, Bang H, Kim HC, Kim HM, Park SW, Kim DJ. A simple screening score for diabetes for the Korean population: development, validation, and comparison with other scores. Diabetes Care 2012;35:1723-1730. PubMedPMC
  • 8. Lim NK, Park SH, Choi SJ, Lee KS, Park HY. A risk score for predicting the incidence of type 2 diabetes in a middle-aged Korean cohort: the Korean Genome and Epidemiology Study. Circ J 2012;76:1904-1910. ArticlePubMed
  • 9. Seong SC, Kim YY, Park SK, Khang YH, Kim HC, Park JH, Kang HJ, Do CH, Song JS, Lee EJ, Ha S, Shin SA, Jeong SL. Cohort profile: the National Health Insurance Service-National Health Screening Cohort (NHIS-HEALS) in Korea. BMJ Open 2017;7:e016640.ArticlePubMedPMC
  • 10. World Health Organization. The Asia Pacific perspective: redefining obesity and its treatment. Sydney: Health Communications; 2000. p. 15-21.
  • 11. Kim Y, Han BG. KoGES group. Cohort profile: the Korean Genome and Epidemiology Study (KoGES) consortium. Int J Epidemiol 2017;46:e20. ArticlePubMed
  • 12. Royston P, Altman DG. External validation of a Cox prognostic model: principles and methods. BMC Med Res Methodol 2013;13:33ArticlePubMedPMCPDF
  • 13. Harrell FE Jr, Califf RM, Pryor DB, Lee KL, Rosati RA. Evaluating the yield of medical tests. JAMA 1982;247:2543-2546. ArticlePubMed
  • 14. Korean Diabetes Association. Korean diabetes fact sheet 2015 cited 2018 Apr 30. Available from: http://www.diabetes.or.kr.
  • 15. Korean Diabetes Association. Korean diabetes fact sheet 2016 cited 2018 Apr 30. Available from: http://www.diabetes.or.kr.
  • 16. Noble D, Mathur R, Dent T, Meads C, Greenhalgh T. Risk models and scores for type 2 diabetes: systematic review. BMJ 2011;343:d7163ArticlePubMedPMC
  • 17. Chan JC, Malik V, Jia W, Kadowaki T, Yajnik CS, Yoon KH, Hu FB. Diabetes in Asia: epidemiology, risk factors, and pathophysiology. JAMA 2009;301:2129-2140. ArticlePubMed
  • 18. Gujral UP, Pradeepa R, Weber MB, Narayan KM, Mohan V. Type 2 diabetes in South Asians: similarities and differences with white Caucasian and other populations. Ann N Y Acad Sci 2013;1281:51-63. ArticlePubMedPMCPDF
  • 19. Hu PL, Koh YL, Tan NC. The utility of diabetes risk score items as predictors of incident type 2 diabetes in Asian populations: an evidence-based review. Diabetes Res Clin Pract 2016;122:179-189. ArticlePubMed
  • 20. Gao WG, Dong YH, Pang ZC, Nan HR, Wang SJ, Ren J, Zhang L, Tuomilehto J, Qiao Q. A simple Chinese risk score for undiagnosed diabetes. Diabet Med 2010;27:274-281. ArticlePubMed
  • 21. Luo S, Han L, Zeng P, Chen F, Pan L, Wang S, Zhang T. A risk assessment model for type 2 diabetes in Chinese. PLoS One 2014;9:e104046. ArticlePubMedPMC
  • 22. Sun F, Tao Q, Zhan S. An accurate risk score for estimation 5-year risk of type 2 diabetes based on a health screening population in Taiwan. Diabetes Res Clin Pract 2009;85:228-234. ArticlePubMed
  • 23. Heianza Y, Arase Y, Hsieh SD, Saito K, Tsuji H, Kodama S, Tanaka S, Ohashi Y, Shimano H, Yamada N, Hara S, Sone H. Development of a new scoring system for predicting the 5 year incidence of type 2 diabetes in Japan: the Toranomon Hospital Health Management Center Study 6 (TOPICS 6). Diabetologia 2012;55:3213-3223. ArticlePubMedPDF
  • 24. Wang A, Chen G, Su Z, Liu X, Liu X, Li H, Luo Y, Tao L, Guo J, Liu L, Chen S, Wu S, Guo X. Risk scores for predicting incidence of type 2 diabetes in the Chinese population: the Kailuan prospective study. Sci Rep 2016;6:26548ArticlePubMedPMCPDF
  • 25. Lee YH, Bang H, Kim DJ. How to establish clinical prediction models. Endocrinol Metab (Seoul) 2016;31:38-44. ArticlePubMedPMCPDF
  • 26. Aune D, Norat T, Leitzmann M, Tonstad S, Vatten LJ. Physical activity and the risk of type 2 diabetes: a systematic review and dose-response meta-analysis. Eur J Epidemiol 2015;30:529-542. ArticlePubMedPDF
  • 27. InterAct Consortium. Spijkerman AM, van der A DL, Nilsson PM, Ardanaz E, Gavrila D, Agudo A, Arriola L, Balkau B, Beulens JW, Boeing H, de Lauzon-Guillain B, Fagherazzi G, Feskens EJ, Franks PW, Grioni S, Huerta JM, Kaaks R, Key TJ, Overvad K, Palli D, Panico S, Redondo ML, Rolandsson O, Roswall N, Sacerdote C, Sanchez MJ, Schulze MB, Slimani N, Teucher B, Tjonneland A, Tumino R, van der Schouw YT, Langenberg C, Sharp SJ, Forouhi NG, Riboli E, Wareham NJ. Smoking and long-term risk of type 2 diabetes: the EPIC-InterAct study in European populations. Diabetes Care 2014;37:3164-3171. ArticlePubMedPDF
  • 28. Li XH, Yu FF, Zhou YH, He J. Association between alcohol consumption and the risk of incident type 2 diabetes: a systematic review and dose-response meta-analysis. Am J Clin Nutr 2016;103:818-829. ArticlePubMed
  • 29. Knott C, Bell S, Britton A. Alcohol consumption and the risk of type 2 diabetes: a systematic review and dose-response meta-analysis of more than 1.9 million individuals from 38 observational studies. Diabetes Care 2015;38:1804-1812. ArticlePubMedPDF
  • 30. Lee DY, Yoo MG, Kim HJ, Jang HB, Kim JH, Lee HJ, Park SI. Association between alcohol consumption pattern and the incidence risk of type 2 diabetes in Korean men: a 12-years follow-up study. Sci Rep 2017;7:7322ArticlePubMedPMCPDF
  • 31. Hong SW, Linton JA, Shim JY, Kang HT. High-risk drinking is associated with a higher risk of diabetes mellitus in Korean men, based on the 2010–2012 KNHANES. Alcohol 2015;49:275-281. ArticlePubMed
  • 32. Lee DH, Jacobs DR Jr. Serum gamma-glutamyltransferase: new insights about an old enzyme. J Epidemiol Community Health 2009;63:884-886. PubMed
  • 33. Thayer KA, Heindel JJ, Bucher JR, Gallo MA. Role of environmental chemicals in diabetes and obesity: a National Toxicology Program workshop review. Environ Health Perspect 2012;120:779-789. ArticlePubMedPMC
  • 34. Lee DH, Jacobs DR Jr, Gross M, Kiefe CI, Roseman J, Lewis CE, Steffes M. Gamma-glutamyltransferase is a predictor of incident diabetes and hypertension: the Coronary Artery Risk Development in Young Adults (CARDIA) Study. Clin Chem 2003;49:1358-1366. PubMed
  • 35. Nguyen NT, Nguyen XM, Lane J, Wang P. Relationship between obesity and diabetes in a US adult population: findings from the National Health and Nutrition Examination Survey, 1999–2006. Obes Surg 2011;21:351-355. ArticlePubMed
  • 36. Sairenchi T, Iso H, Irie F, Fukasawa N, Ota H, Muto T. Underweight as a predictor of diabetes in older adults: a large cohort study. Diabetes Care 2008;31:583-584. PubMed
  • 37. Wei GS, Coady SA, Goff DC Jr, Brancati FL, Levy D, Selvin E, Vasan RS, Fox CS. Blood pressure and the risk of developing diabetes in African Americans and Whites: ARIC, CARDIA, and the Framingham Heart Study. Diabetes Care 2011;34:873-879. PubMedPMC
  • 38. Cho NH, Kim KM, Choi SH, Park KS, Jang HC, Kim SS, Sattar N, Lim S. High blood pressure and its association with incident diabetes over 10 years in the Korean Genome and Epidemiology Study (KoGES). Diabetes Care 2015;38:1333-1338. ArticlePubMedPDF
  • 39. Whelton PK, Carey RM, Aronow WS, Casey DE Jr, Collins KJ, Dennison Himmelfarb C, DePalma SM, Gidding S, Jamerson KA, Jones DW, MacLaughlin EJ, Muntner P, Ovbiagele B, Smith SC Jr, Spencer CC, Stafford RS, Taler SJ, Thomas RJ, Williams KA Sr, Williamson JD, Wright JT Jr. 2017 ACC/AHA/AAPA/ABC/ACPM/AGS/APhA/ASH/ASPC/NMA/PCNA Guideline for the prevention, detection, evaluation, and management of high blood pressure in adults: a report of the American College of Cardiology/American Heart Association Task Force on clinical practice guidelines. J Am Coll Cardiol 2018;71:e127-e248. ArticlePubMed
  • 40. Han SJ, Kim HJ, Kim DJ, Lee KW, Cho NH. Incidence and predictors of type 2 diabetes among Koreans: a 12-year follow up of the Korean Genome and Epidemiology Study. Diabetes Res Clin Pract 2017;123:173-180. ArticlePubMed
  • 41. Jeon JY, Ko SH, Kwon HS, Kim NH, Kim JH, Kim CS, Song KH, Won JC, Lim S, Choi SH, Jang MJ, Kim Y, Oh K, Kim DJ, Cha BY. Taskforce Team of Diabetes Fact Sheet of the Korean Diabetes Association. Prevalence of diabetes and prediabetes according to fasting plasma glucose and HbA1c. Diabetes Metab J 2013;37:349-357. ArticlePubMedPMC
  • 42. Song SO, Song YD, Nam JY, Park KH, Yoon JH, Son KM, Ko Y, Lim DH. Epidemiology of type 1 diabetes mellitus in Korea through an investigation of the National Registration Project of type 1 diabetes for the reimbursement of glucometer strips with additional analyses using claims data. Diabetes Metab J 2016;40:35-45. ArticlePubMedPDF
  • 43. Kahn HS, Cheng YJ, Thompson TJ, Imperatore G, Gregg EW. Two risk-scoring systems for predicting incident diabetes mellitus in U.S. adults age 45 to 64 years. Ann Intern Med 2009;150:741-751. ArticlePubMed
  • 44. Mooradian AD. Dyslipidemia in type 2 diabetes mellitus. Nat Clin Pract Endocrinol Metab 2009;5:150-159. ArticlePubMedPDF
  • 45. Esposito K, Chiodini P, Maiorino MI, Bellastella G, Panagiotakos D, Giugliano D. Which diet for prevention of type 2 diabetes? A meta-analysis of prospective studies. Endocrine 2014;47:107-116. ArticlePubMedPDF
  • 46. Imamura F, O'Connor L, Ye Z, Mursu J, Hayashino Y, Bhupathiraju SN, Forouhi NG. Consumption of sugar sweetened beverages, artificially sweetened beverages, and fruit juice and incidence of type 2 diabetes: systematic review, meta-analysis, and estimation of population attributable fraction. BMJ 2015;351:h3576ArticlePubMedPMC
  • 47. Micha R, Wallace SK, Mozaffarian D. Red and processed meat consumption and risk of incident coronary heart disease, stroke, and diabetes mellitus: a systematic review and meta-analysis. Circulation 2010;121:2271-2283. ArticlePubMedPMC
Fig. 1

Calibration plots with C-statistics in the (A, B) development and (C, D) validation cohorts. Data markers represent the observed event rate (position on the y-axis) in relation to the predicted event rate (position on the x-axis); dotted lines, perfect calibration (i.e., observed=predicted).

dmj-42-402-g001.jpg
Fig. 2

Cumulative incidence of diabetes events according to (A) sex, (B) age, (C) body mass index, (D) systolic blood pressure, (E) fasting glucose, and (F) total cholesterol.

dmj-42-402-g002.jpg
Table 1

Baseline characteristics of participants in development and validation cohorts at study entry

dmj-42-402-i001.jpg
Variable Development cohort Validation cohort
Men (n=191,199) Women (n=168,150) Men (n=3,164) Women (n=3,496)
Age, yr 51.2±9.2 52.5±9.6 50.4±8.4 51.3±8.8
Family history of diabetes 11,164 (5.8) 10,461 (6.2) 301 (9.5) 403 (11.5)
Alcohol intake
 Abstinent 66,159 (34.6) 138,003 (82.1) 960 (30.3) 2,597 (74.3)
 Low-medium 112,992 (59.1) 29,589 (17.6) 1,726 (54.6) 838 (24.0)
 High 12,048 (6.3) 558 (0.3) 478 (15.1) 61 (1.7)
Smoking status
 Non-smoker 79,056 (41.4) 161,964 (96.3) 658 (20.8) 3,321 (95.0)
 Former smoker 29,888 (15.6) 1,619 (1.0) 987 (31.2) 46 (1.3)
 Current smoker 82,255 (43.0) 4,567 (2.7) 1,519 (48.0) 129 (3.7)
Physical activity
 Low 95,495 (49.9) 112,770 (67.1) 2,539 (80.3) 2,921 (83.6)
 Medium 78,139 (40.9) 40,898 (24.3) 573 (18.1) 525 (15.0)
 High 17,565 (9.2) 14,482 (8.6) 52 (1.6) 50 (1.4)
Antihypertensive therapy 35,981 (18.8) 42,188 (25.1) 246 (7.8) 355 (10.2)
Statin therapy 6,124 (3.2) 7,454 (4.4) 18 (0.6) 9 (0.3)
Body mass index, kg/m2 23.9±2.8 23.9±3.0 24.2±2.8 24.7±3.2
Body mass index, kg/m2
 <18.5 4,588 (2.4) 3,927 (2.3) 62 (2.0) 47 (1.3)
 18.5–22.9 66,475 (34.8) 65,248 (38.8) 972 (30.7) 1,019 (29.2)
 23.0–24.9 53,976 (28.2) 44,110 (26.2) 907 (28.7) 893 (25.5)
 25.0–29.9 62,430 (32.7) 49,447 (29.4) 1,156 (36.5) 1,315 (37.6)
 ≥30.0 3,730 (2.0) 5,418 (3.2) 67 (2.1) 222 (6.4)
Systolic BP, mm Hg 128.0±17.2 124.2±18.5 120.6±16.6 118.2±18.8
Diastolic BP, mm Hg 81.0±11.4 77.2±11.8 81.4±10.9 77.4±11.5
Systolic BP, mmHg
 <100 2,823 (1.5) 7,005 (4.2) 226 (7.1) 489 (14.0)
 100–119 45,513 (23.8) 54,858 (32.6) 1,401 (44.3) 1,578 (45.1)
 120–139 91,123 (47.7) 68,943 (41.0) 1,135 (35.9) 944 (27.0)
 140–159 40,625 (21.2) 28,597 (17.0) 326 (10.3) 384 (11.0)
 ≥160 11,115 (5.8) 8,747 (5.2) 76 (2.4) 101 (2.9)
Total cholesterol, mg/dL 198.1±36.9 201.4±38.1 198.6±35.5 197.4±35.9
Total cholesterol, mg/dL
 <240 167,175 (87.4) 142,687 (84.9) 2,756 (87.1) 3,078 (88.0)
 ≥240 24,024 (12.6) 25,463 (15.1) 408 (12.9) 418 (12.0)
Fasting glucose, mg/dL 91.0 (82.0–101.0) 89.0 (81.0–98.0) 83.0 (78.0–90.0) 80.0 (76.0–85.0)
Fasting glucose, mg/dL
 <70 3,887 (2.0) 3,440 (2.0) 72 (2.3) 127 (3.6)
 70–84 55,142 (28.8) 54,681 (32.5) 1,654 (52.3) 2,431 (69.5)
 85–99 79,498 (41.6) 74,599 (44.4) 1,239 (39.2) 861 (24.6)
 100–109 32,794 (17.2) 23,564 (14.0) 160 (5.1) 61 (1.7)
 ≥110 19,878 (10.4) 11,866 (7.1) 39 (1.2) 16 (0.5)
GGT, U/L 32.0 (21.0–54.0) 16.0 (12.0–23.0) 31.0 (20.0–53.0) 15.0 (12.0–21.0)

Values are presented as mean±standard deviation, number (%), or median (interquartile range).

BP, blood pressure; GGT, γ glutamyl transferase.

Table 2

Adjusted hazard ratio (95% confidence interval) for diabetes in the development cohort

dmj-42-402-i002.jpg
Variable Men Women
Age, yr 1.04 (1.03–1.04) 1.03 (1.03–1.04)
Family history of diabetes 1.50 (1.43–1.58) 1.57 (1.48–1.67)
Alcohol intake NA
 Abstinent 1.00
 Low-medium 0.92 (0.89–0.95)
 High 1.06 (1.00–1.11)
Smoking status
 Non-smoker 1.00 1.00
 Former smoker 1.07 (1.03–1.12) 1.27 (1.09–1.47)
 Current smoker 1.48 (1.43–1.52) 1.31 (1.21–1.42)
Physical activity
 Low 1.00 1.00
 Medium 0.88 (0.86–0.91) 0.93 (0.90–0.97)
 High 0.87 (0.83–0.91) 0.98 (0.93–1.03)
Antihypertensive therapy 1.39 (1.35–1.44) 1.47 (1.42–1.52)
Statin therapy 1.30 (1.23–1.38) 1.37 (1.30–1.45)
Body mass index, kg/m2
 <18.5 1.08 (0.97–1.19) 1.01 (0.88–1.16)
 18.5–22.9 1.00 1.00
 23.0–24.9 1.40 (1.35–1.45) 1.38 (1.32–1.45)
 25.0–29.9 1.92 (1.86–1.99) 1.91 (1.83–1.99)
 ≥30.0 3.50 (3.27–3.75) 2.90 (2.72–3.09)
Systolic BP, mm Hg
 <100 0.89 (0.76–1.03) 0.84 (0.74–0.95)
 100–119 1.00 1.00
 120–139 1.16 (1.12–1.21) 1.21 (1.16–1.26)
 140–159 1.29 (1.24–1.35) 1.34 (1.28–1.41)
 ≥160 1.41 (1.33–1.49) 1.44 (1.35–1.53)
Total cholesterol, mg/dL
 <240 1.00 1.00
 ≥240 1.20 (1.15–1.24) 1.11 (1.07–1.15)
Fasting glucose, mg/dL
 <70 0.94 (0.83–1.07) 0.98 (0.85–1.13)
 70–84 1.00 1.00
 85–99 1.24 (1.20–1.29) 1.26 (1.20–1.31)
 100–109 2.00 (1.92–2.09) 2.18 (2.08–2.29)
 ≥110 3.65 (3.50–3.80) 3.83 (3.65–4.03)
Log GGT NA 1.63 (1.59–1.67)

NA, not applicable; BP, blood pressure; GGT, γ glutamyl transferase.

Figure & Data

References

    Citations

    Citations to this article as recorded by  
    • Alanine to glycine ratio is a novel predictive biomarker for type 2 diabetes mellitus
      Kwang Seob Lee, Yong‐ho Lee, Sang‐Guk Lee
      Diabetes, Obesity and Metabolism.2024; 26(3): 980.     CrossRef
    • Associations of updated cardiovascular health metrics, including sleep health, with incident diabetes and cardiovascular events in older adults with prediabetes: A nationwide population-based cohort study
      Kyoung Hwa Ha, Dae Jung Kim, Seung Jin Han
      Diabetes Research and Clinical Practice.2023; 203: 110820.     CrossRef
    • Comparisons of the prediction models for undiagnosed diabetes between machine learning versus traditional statistical methods
      Seong Gyu Choi, Minsuk Oh, Dong–Hyuk Park, Byeongchan Lee, Yong-ho Lee, Sun Ha Jee, Justin Y. Jeon
      Scientific Reports.2023;[Epub]     CrossRef
    • Risk prediction models for incident type 2 diabetes in Chinese people with intermediate hyperglycemia: a systematic literature review and external validation study
      Shishi Xu, Ruth L. Coleman, Qin Wan, Yeqing Gu, Ge Meng, Kun Song, Zumin Shi, Qian Xie, Jaakko Tuomilehto, Rury R. Holman, Kaijun Niu, Nanwei Tong
      Cardiovascular Diabetology.2022;[Epub]     CrossRef
    • Gamma-glutamyl transferase to high-density lipoprotein cholesterol ratio: A valuable predictor of type 2 diabetes mellitus incidence
      Wangcheng Xie, Bin Liu, Yansong Tang, Tingsong Yang, Zhenshun Song
      Frontiers in Endocrinology.2022;[Epub]     CrossRef
    • Low aspartate aminotransferase/alanine aminotransferase (DeRitis) ratio assists in predicting diabetes in Chinese population
      Wangcheng Xie, Weidi Yu, Shanshan Chen, Zhilong Ma, Tingsong Yang, Zhenshun Song
      Frontiers in Public Health.2022;[Epub]     CrossRef
    • Prediction Models for Type 2 Diabetes Risk in the General Population: A Systematic Review of Observational Studies
      Samaneh Asgari, Davood Khalili, Farhad Hosseinpanah, Farzad Hadaegh
      International Journal of Endocrinology and Metabolism.2021;[Epub]     CrossRef
    • Development of a clinical risk score for incident diabetes: A 10‐year prospective cohort study
      Tae Jung Oh, Jae Hoon Moon, Sung Hee Choi, Young Min Cho, Kyong Soo Park, Nam H Cho, Hak Chul Jang
      Journal of Diabetes Investigation.2021; 12(4): 610.     CrossRef
    • Association between longitudinal blood pressure and prognosis after treatment of cerebral aneurysm: A nationwide population-based cohort study
      Jinkwon Kim, Jang Hoon Kim, Hye Sun Lee, Sang Hyun Suh, Kyung-Yul Lee, Yan Li
      PLOS ONE.2021; 16(5): e0252042.     CrossRef
    • Development of a predictive risk model for all-cause mortality in patients with diabetes in Hong Kong
      Sharen Lee, Jiandong Zhou, Keith Sai Kit Leung, William Ka Kei Wu, Wing Tak Wong, Tong Liu, Ian Chi Kei Wong, Kamalan Jeevaratnam, Qingpeng Zhang, Gary Tse
      BMJ Open Diabetes Research & Care.2021; 9(1): e001950.     CrossRef
    • Development and Validation of a Deep Learning Based Diabetes Prediction System Using a Nationwide Population-Based Cohort
      Sang Youl Rhee, Ji Min Sung, Sunhee Kim, In-Jeong Cho, Sang-Eun Lee, Hyuk-Jae Chang
      Diabetes & Metabolism Journal.2021; 45(4): 515.     CrossRef
    • Development and validation of a new diabetes index for the risk classification of present and new-onset diabetes: multicohort study
      Shinje Moon, Ji-Yong Jang, Yumin Kim, Chang-Myung Oh
      Scientific Reports.2021;[Epub]     CrossRef
    • New risk score model for identifying individuals at risk for diabetes in southwest China
      Liying Li, Ziqiong Wang, Muxin Zhang, Haiyan Ruan, Linxia Zhou, Xin Wei, Ye Zhu, Jiafu Wei, Sen He
      Preventive Medicine Reports.2021; 24: 101618.     CrossRef
    • Multiple Biomarkers Improved Prediction for the Risk of Type 2 Diabetes Mellitus in Singapore Chinese Men and Women
      Yeli Wang, Woon-Puay Koh, Xueling Sim, Jian-Min Yuan, An Pan
      Diabetes & Metabolism Journal.2020; 44(2): 295.     CrossRef
    • Smoking as a Target for Prevention of Diabetes
      Ye Seul Yang, Tae Seo Sohn
      Diabetes & Metabolism Journal.2020; 44(3): 402.     CrossRef
    • Middle-aged men with type 2 diabetes as potential candidates for pancreatic cancer screening: a 10-year nationwide population-based cohort study
      Dong-Hoe Koo, Kyung-Do Han, Hong Joo Kim, Cheol-Young Park
      Acta Diabetologica.2020; 57(2): 197.     CrossRef
    • Systematic review with meta-analysis of the epidemiological evidence relating smoking to type 2 diabetes
      Peter N Lee, Katharine J Coombs
      World Journal of Meta-Analysis.2020; 8(2): 119.     CrossRef
    • Biomarker Score in Risk Prediction: Beyond Scientific Evidence and Statistical Performance
      Heejung Bang
      Diabetes & Metabolism Journal.2020; 44(2): 245.     CrossRef
    • Research progress on Traditional Chinese Medicine syndromes of diabetes mellitus
      Jingkang Wang, Quantao Ma, Yaqi Li, Pengfei Li, Min Wang, Tieshan Wang, Chunguo Wang, Ting Wang, Baosheng Zhao
      Biomedicine & Pharmacotherapy.2020; 121: 109565.     CrossRef
    • Cardiometabolic risk prediction algorithms for young people with psychosis: a systematic review and exploratory analysis
      B. I. Perry, R. Upthegrove, O. Crawford, S. Jang, E. Lau, I. McGill, E. Carver, P. B. Jones, G. M. Khandaker
      Acta Psychiatrica Scandinavica.2020; 142(3): 215.     CrossRef
    • Impact of obesity, fasting plasma glucose level, blood pressure, and renal function on the severity of COVID-19: A matter of sexual dimorphism?
      Kyungmin Huh, Rugyeom Lee, Wonjun Ji, Minsun Kang, In Cheol Hwang, Dae Ho Lee, Jaehun Jung
      Diabetes Research and Clinical Practice.2020; 170: 108515.     CrossRef

    • PubReader PubReader
    • Cite this Article
      Cite this Article
      export Copy Download
      Close
      Download Citation
      Download a citation file in RIS format that can be imported by all major citation management software, including EndNote, ProCite, RefWorks, and Reference Manager.

      Format:
      • RIS — For EndNote, ProCite, RefWorks, and most other reference management software
      • BibTeX — For JabRef, BibDesk, and other BibTeX-specific software
      Include:
      • Citation for the content below
      Development and Validation of the Korean Diabetes Risk Score: A 10-Year National Cohort Study
      Diabetes Metab J. 2018;42(5):402-414.   Published online July 6, 2018
      Close
    • XML DownloadXML Download
    Figure
    • 0
    • 1
    Related articles
    Development and Validation of the Korean Diabetes Risk Score: A 10-Year National Cohort Study
    Image Image
    Fig. 1 Calibration plots with C-statistics in the (A, B) development and (C, D) validation cohorts. Data markers represent the observed event rate (position on the y-axis) in relation to the predicted event rate (position on the x-axis); dotted lines, perfect calibration (i.e., observed=predicted).
    Fig. 2 Cumulative incidence of diabetes events according to (A) sex, (B) age, (C) body mass index, (D) systolic blood pressure, (E) fasting glucose, and (F) total cholesterol.
    Development and Validation of the Korean Diabetes Risk Score: A 10-Year National Cohort Study
    VariableDevelopment cohortValidation cohort
    Men (n=191,199)Women (n=168,150)Men (n=3,164)Women (n=3,496)
    Age, yr51.2±9.252.5±9.650.4±8.451.3±8.8
    Family history of diabetes11,164 (5.8)10,461 (6.2)301 (9.5)403 (11.5)
    Alcohol intake
     Abstinent66,159 (34.6)138,003 (82.1)960 (30.3)2,597 (74.3)
     Low-medium112,992 (59.1)29,589 (17.6)1,726 (54.6)838 (24.0)
     High12,048 (6.3)558 (0.3)478 (15.1)61 (1.7)
    Smoking status
     Non-smoker79,056 (41.4)161,964 (96.3)658 (20.8)3,321 (95.0)
     Former smoker29,888 (15.6)1,619 (1.0)987 (31.2)46 (1.3)
     Current smoker82,255 (43.0)4,567 (2.7)1,519 (48.0)129 (3.7)
    Physical activity
     Low95,495 (49.9)112,770 (67.1)2,539 (80.3)2,921 (83.6)
     Medium78,139 (40.9)40,898 (24.3)573 (18.1)525 (15.0)
     High17,565 (9.2)14,482 (8.6)52 (1.6)50 (1.4)
    Antihypertensive therapy35,981 (18.8)42,188 (25.1)246 (7.8)355 (10.2)
    Statin therapy6,124 (3.2)7,454 (4.4)18 (0.6)9 (0.3)
    Body mass index, kg/m223.9±2.823.9±3.024.2±2.824.7±3.2
    Body mass index, kg/m2
     <18.54,588 (2.4)3,927 (2.3)62 (2.0)47 (1.3)
     18.5–22.966,475 (34.8)65,248 (38.8)972 (30.7)1,019 (29.2)
     23.0–24.953,976 (28.2)44,110 (26.2)907 (28.7)893 (25.5)
     25.0–29.962,430 (32.7)49,447 (29.4)1,156 (36.5)1,315 (37.6)
     ≥30.03,730 (2.0)5,418 (3.2)67 (2.1)222 (6.4)
    Systolic BP, mm Hg128.0±17.2124.2±18.5120.6±16.6118.2±18.8
    Diastolic BP, mm Hg81.0±11.477.2±11.881.4±10.977.4±11.5
    Systolic BP, mmHg
     <1002,823 (1.5)7,005 (4.2)226 (7.1)489 (14.0)
     100–11945,513 (23.8)54,858 (32.6)1,401 (44.3)1,578 (45.1)
     120–13991,123 (47.7)68,943 (41.0)1,135 (35.9)944 (27.0)
     140–15940,625 (21.2)28,597 (17.0)326 (10.3)384 (11.0)
     ≥16011,115 (5.8)8,747 (5.2)76 (2.4)101 (2.9)
    Total cholesterol, mg/dL198.1±36.9201.4±38.1198.6±35.5197.4±35.9
    Total cholesterol, mg/dL
     <240167,175 (87.4)142,687 (84.9)2,756 (87.1)3,078 (88.0)
     ≥24024,024 (12.6)25,463 (15.1)408 (12.9)418 (12.0)
    Fasting glucose, mg/dL91.0 (82.0–101.0)89.0 (81.0–98.0)83.0 (78.0–90.0)80.0 (76.0–85.0)
    Fasting glucose, mg/dL
     <703,887 (2.0)3,440 (2.0)72 (2.3)127 (3.6)
     70–8455,142 (28.8)54,681 (32.5)1,654 (52.3)2,431 (69.5)
     85–9979,498 (41.6)74,599 (44.4)1,239 (39.2)861 (24.6)
     100–10932,794 (17.2)23,564 (14.0)160 (5.1)61 (1.7)
     ≥11019,878 (10.4)11,866 (7.1)39 (1.2)16 (0.5)
    GGT, U/L32.0 (21.0–54.0)16.0 (12.0–23.0)31.0 (20.0–53.0)15.0 (12.0–21.0)
    VariableMenWomen
    Age, yr1.04 (1.03–1.04)1.03 (1.03–1.04)
    Family history of diabetes1.50 (1.43–1.58)1.57 (1.48–1.67)
    Alcohol intakeNA
     Abstinent1.00
     Low-medium0.92 (0.89–0.95)
     High1.06 (1.00–1.11)
    Smoking status
     Non-smoker1.001.00
     Former smoker1.07 (1.03–1.12)1.27 (1.09–1.47)
     Current smoker1.48 (1.43–1.52)1.31 (1.21–1.42)
    Physical activity
     Low1.001.00
     Medium0.88 (0.86–0.91)0.93 (0.90–0.97)
     High0.87 (0.83–0.91)0.98 (0.93–1.03)
    Antihypertensive therapy1.39 (1.35–1.44)1.47 (1.42–1.52)
    Statin therapy1.30 (1.23–1.38)1.37 (1.30–1.45)
    Body mass index, kg/m2
     <18.51.08 (0.97–1.19)1.01 (0.88–1.16)
     18.5–22.91.001.00
     23.0–24.91.40 (1.35–1.45)1.38 (1.32–1.45)
     25.0–29.91.92 (1.86–1.99)1.91 (1.83–1.99)
     ≥30.03.50 (3.27–3.75)2.90 (2.72–3.09)
    Systolic BP, mm Hg
     <1000.89 (0.76–1.03)0.84 (0.74–0.95)
     100–1191.001.00
     120–1391.16 (1.12–1.21)1.21 (1.16–1.26)
     140–1591.29 (1.24–1.35)1.34 (1.28–1.41)
     ≥1601.41 (1.33–1.49)1.44 (1.35–1.53)
    Total cholesterol, mg/dL
     <2401.001.00
     ≥2401.20 (1.15–1.24)1.11 (1.07–1.15)
    Fasting glucose, mg/dL
     <700.94 (0.83–1.07)0.98 (0.85–1.13)
     70–841.001.00
     85–991.24 (1.20–1.29)1.26 (1.20–1.31)
     100–1092.00 (1.92–2.09)2.18 (2.08–2.29)
     ≥1103.65 (3.50–3.80)3.83 (3.65–4.03)
    Log GGTNA1.63 (1.59–1.67)
    Table 1 Baseline characteristics of participants in development and validation cohorts at study entry

    Values are presented as mean±standard deviation, number (%), or median (interquartile range).

    BP, blood pressure; GGT, γ glutamyl transferase.

    Table 2 Adjusted hazard ratio (95% confidence interval) for diabetes in the development cohort

    NA, not applicable; BP, blood pressure; GGT, γ glutamyl transferase.

    Ha KH, Lee Yh, Song SO, Lee Jw, Kim DW, Cho Kh, Kim DJ. Development and Validation of the Korean Diabetes Risk Score: A 10-Year National Cohort Study. Diabetes Metab J. 2018;42(5):402-414.
    Received: Jan 22, 2018; Accepted: Apr 16, 2018
    DOI: https://doi.org/10.4093/dmj.2018.0014.

    Diabetes Metab J : Diabetes & Metabolism Journal
    Close layer
    TOP