
- Current
- Browse
- Collections
-
For contributors
- For Authors
- Instructions to authors
- Article processing charge
- e-submission
- For Reviewers
- Instructions for reviewers
- How to become a reviewer
- Best reviewers
- For Readers
- Readership
- Subscription
- Permission guidelines
- About
- Editorial policy
Articles
- Page Path
- HOME > Diabetes Metab J > Volume 38(1); 2014 > Article
-
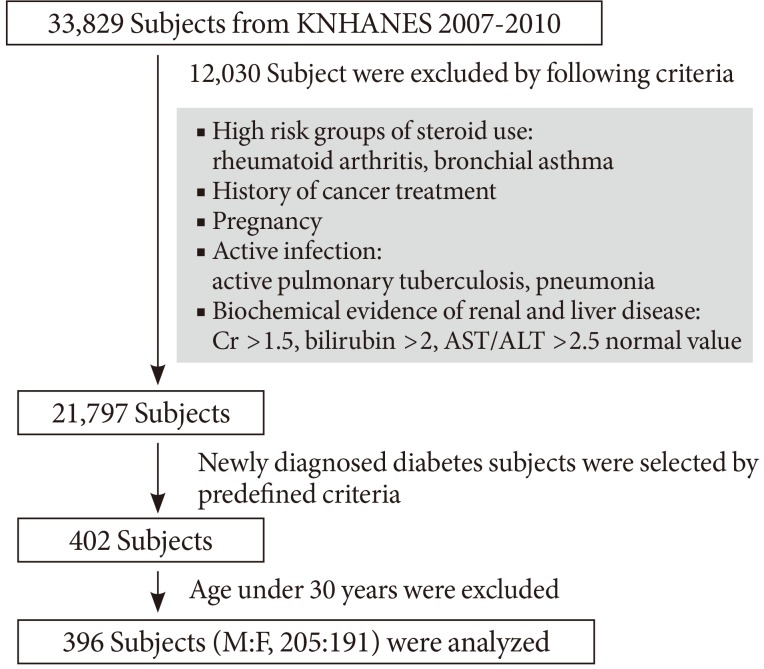
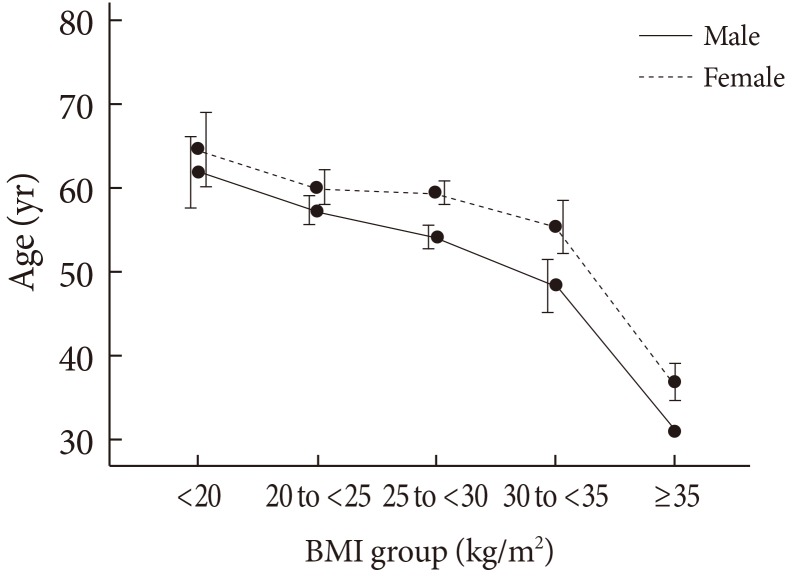
Original ArticleObesity and Metabolic Syndrome Women Are Diagnosed with Type 2 Diabetes at Higher Body Mass Indices and Older Ages than Men: Korea National Health and Nutrition Examination Survey 2007-2010
- Su Kyoung Kwon
-
Diabetes & Metabolism Journal 2014;38(1):74-80.
DOI: https://doi.org/10.4093/dmj.2014.38.1.74
Published online: February 19, 2014
Department of Endocrinology and Metabolism, Kosin University Gospel Hospital, Kosin University College of Medicine, Busan, Korea.
- Corresponding author: Su Kyoung Kwon. Department of Endocrinology and Metabolism, Kosin University Gospel Hospital, Kosin University College of Medicine, 262 Gamcheon-ro, Seo-gu, Busan 602-702, Korea. mir316@naver.com
• Received: October 14, 2013 • Accepted: January 6, 2014
Copyright © 2014 Korean Diabetes Association
This is an Open Access article distributed under the terms of the Creative Commons Attribution Non-Commercial License (http://creativecommons.org/licenses/by-nc/3.0/) which permits unrestricted non-commercial use, distribution, and reproduction in any medium, provided the original work is properly cited.

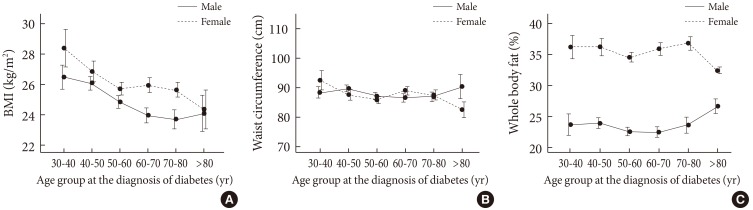

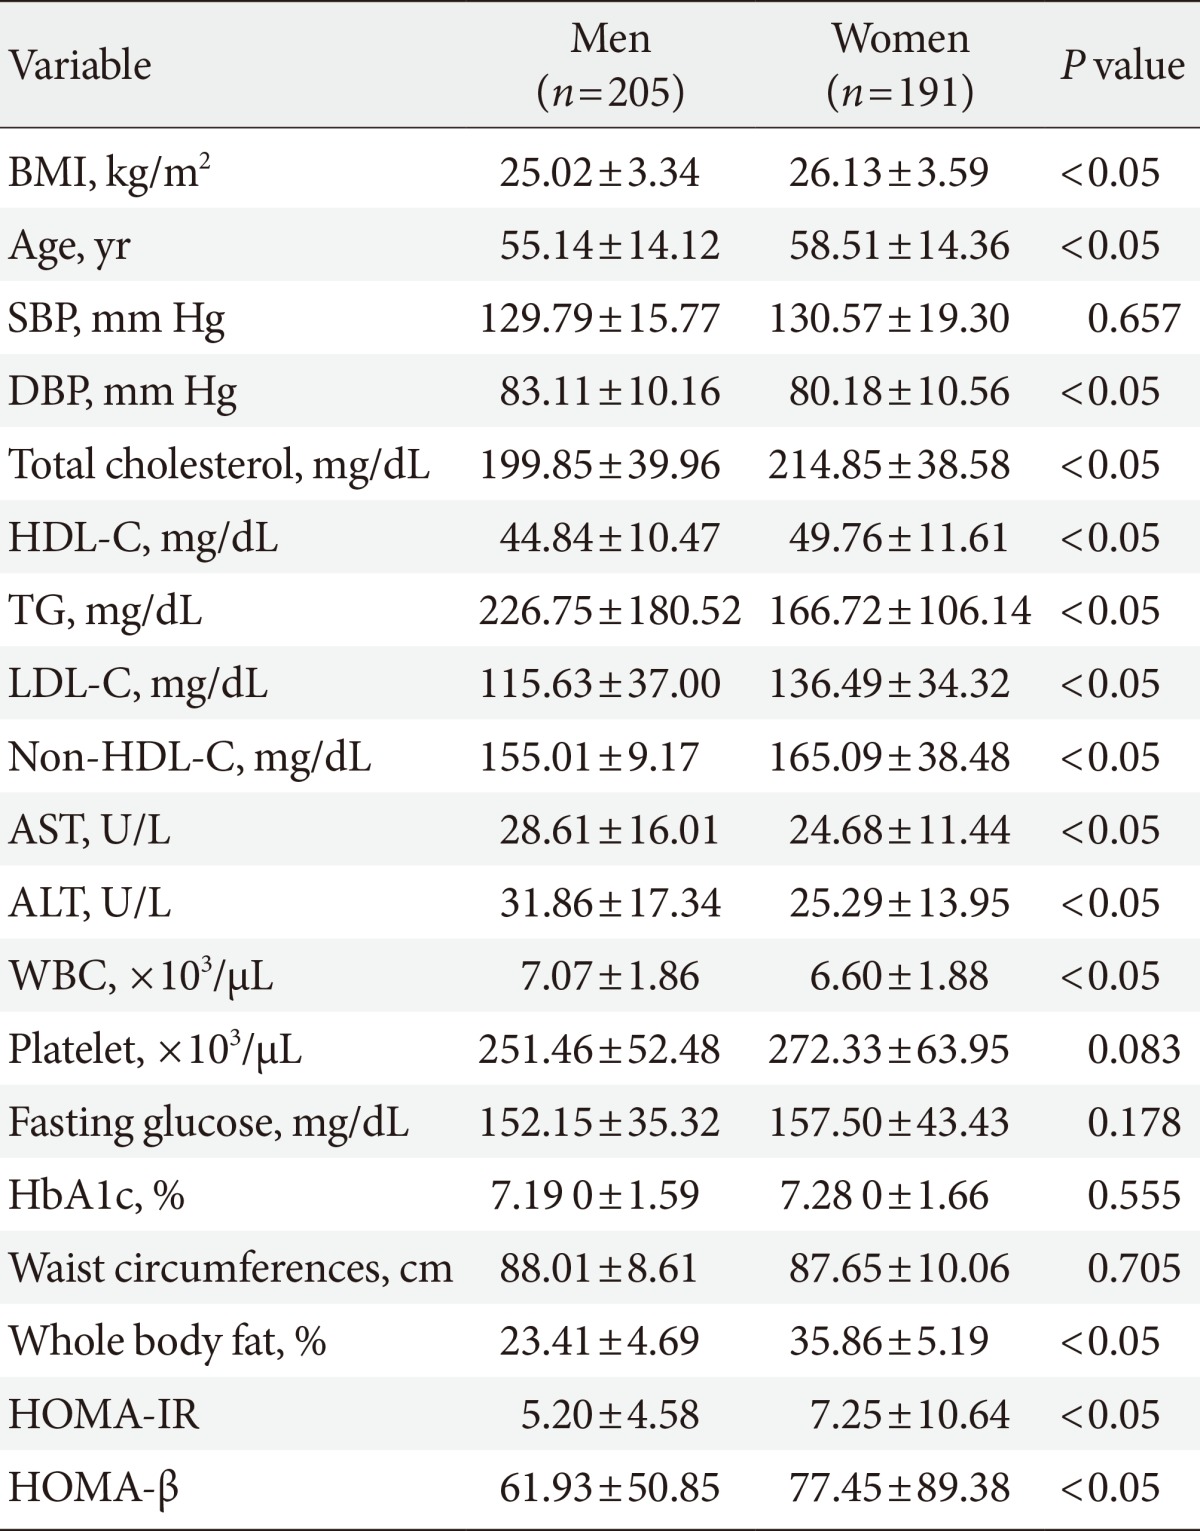

Figure & Data
References
Citations
Citations to this article as recorded by 
- Diabetes and cardiovascular risk according to sex: An overview of epidemiological data from the early Framingham reports to the cardiovascular outcomes trials
Abdallah Al-Salameh, Nacera El bouzegaoui, Marie Saraval-Gross
Annales d'Endocrinologie.2023; 84(1): 57. CrossRef - Higher risk of adverse cardiovascular outcomes in females with type 2 diabetes Mellitus: an Umbrella review of systematic reviews
Clyve Yu Leon Yaow, Bryan Chong, Yip Han Chin, Martin Tze Wah Kueh, Cheng Han Ng, Kai En Chan, Ansel Shao Pin Tang, Charlotte Chung, Rachel Goh, Gwyneth Kong, Mark Muthiah, Indah Sukmawati, Antonia Anna Lukito, Mark Y Chan, Chin Meng Khoo, Anurag Mehta, M
European Journal of Preventive Cardiology.2023; 30(12): 1227. CrossRef - Indian Phenotype Characteristics Among Patients with Type 2 Diabetes Mellitus: Insights from a Non-interventional Nationwide Registry in India
Sanjay Kalra, Ambrish Mithal, Abdul Hamid Zargar, Bipin Sethi, Mala Dharmalingam, Sujoy Ghosh, Ranjini Sen
Endocrinology.2022; 18(1): 63. CrossRef - Recreational training improves cardiovascular adaptations, metabolic profile and mental health of elderly women with type-2 diabetes mellitus
Andrea Sanches, Vinicius Guzzoni, Vania C. dos R. Miranda, Laís Bonagurio Peressim, Suellen Rocha, Patrícia Oliveira de Lima, Fernanda Klein Marcondes, Ana Paula Tanno, Tatiana Sousa Cunha
Health Care for Women International.2021; 42(11): 1279. CrossRef - Association of Baseline Characteristics With Insulin Sensitivity and β-Cell Function in the Glycemia Reduction Approaches in Diabetes: A Comparative Effectiveness (GRADE) Study Cohort
Neda Rasouli, Naji Younes, Kristina M. Utzschneider, Silvio E. Inzucchi, Ashok Balasubramanyam, Andrea L. Cherrington, Faramarz Ismail-Beigi, Robert M. Cohen, Darin E. Olson, Ralph A. DeFronzo, William H. Herman, John M. Lachin, Steven E. Kahn, Jill P. Cr
Diabetes Care.2021; 44(2): 340. CrossRef - Sex/Gender Differences in Obesity Prevalence, Comorbidities, and Treatment
Ashley J. Cooper, Sapana R. Gupta, Afaf F. Moustafa, Ariana M. Chao
Current Obesity Reports.2021; 10(4): 458. CrossRef - Age-, sex- and ethnicity-related differences in body weight, blood pressure, HbA1c and lipid levels at the diagnosis of type 2 diabetes relative to people without diabetes
Alison K. Wright, Paul Welsh, Jason M. R. Gill, Evangelos Kontopantelis, Richard Emsley, Iain Buchan, Darren M. Ashcroft, Martin K. Rutter, Naveed Sattar
Diabetologia.2020; 63(8): 1542. CrossRef - Impact of Gender on Type II Diabetes Glycemic and Cardiovascular Markers Control and Treatment
Khaled A. Alswat
Pakistan Journal of Biological Sciences.2020; 23(12): 1643. CrossRef - Preadipocytes of obese humans display gender-specific bioenergetic responses to glucose and insulin
Michaela Keuper, Lucia Berti, Bernhard Raedle, Stephan Sachs, Anja Böhm, Louise Fritsche, Andreas Fritsche, Hans-Ulrich Häring, Martin Hrabě de Angelis, Martin Jastroch, Susanna M. Hofmann, Harald Staiger
Molecular Metabolism.2019; 20: 28. CrossRef - Risk of all-cause and CHD mortality in women versus men with type 2 diabetes: a systematic review and meta-analysis
Guodong Xu, Dingyun You, Liping Wong, Donghui Duan, Fanqian Kong, Xiaohong Zhang, Jinshun Zhao, Wenhua Xing, Liyuan Han, Li Li
European Journal of Endocrinology.2019; 180(4): 243. CrossRef - Gut flora, diet and intestinal metabolism on cardiovascular risk
Deepak Bhatnagar
Current Opinion in Lipidology.2015; 26(2): 148. CrossRef
 PubReader
 Cite
Cite- Figure
-

- Related articles
-
- Diabetes Mellitus in the Elderly Adults in Korea: Based on Data from the Korea National Health and Nutrition Examination Survey 2019 to 2020
- Comparison of Operational Definition of Type 2 Diabetes Mellitus Based on Data from Korean National Health Insurance Service and Korea National Health and Nutrition Examination Survey
- Trends in the Prevalence of Obesity and Its Phenotypes Based on the Korea National Health and Nutrition Examination Survey from 2007 to 2017 in Korea


