
- Current
- Browse
- Collections
-
For contributors
- For Authors
- Instructions to authors
- Article processing charge
- e-submission
- For Reviewers
- Instructions for reviewers
- How to become a reviewer
- Best reviewers
- For Readers
- Readership
- Subscription
- Permission guidelines
- About
- Editorial policy
Articles
- Page Path
- HOME > Diabetes Metab J > Ahead-of print > Article
-
Original ArticleDrug/Regimen Efficacy and Safety of IDegAsp in a Real-World Korean Population with Type 2 Diabetes Mellitus
-
Shinae Kang1
 , Yu-Bae Ahn2, Tae Keun Oh3, Won-Young Lee4, Sung Wan Chun5, Boram Bae6, Amine Dahaoui7, Jin Sook Jeong6, Sungeun Jung7, Hak Chul Jang8
 -
DOI: https://doi.org/10.4093/dmj.2023.0297
Published online: February 27, 2024
- 683 Views
- 48 Download
1Division of Endocrinology, Department of Internal Medicine, Gangnam Severance Hospital, Yonsei University College of Medicine, Seoul, Korea
2Division of Endocrinology and Metabolism, Department of Internal Medicine, St. Vincent’s Hospital, College of Medicine, The Catholic University of Korea, Seoul, Korea
3Department of Internal Medicine, Chungbuk National University Hospital, Chungbuk National University College of Medicine, Cheongju, Korea
4Division of Endocrinology and Metabolism, Department of Internal Medicine, Kangbuk Samsung Hospital, Sungkyunkwan University School of Medicine, Seoul, Korea
5Division of Endocrinology and Metabolism, Department of Internal Medicine, Soonchunhyang University Cheonan Hospital, Soonchunhyang University College of Medicine, Cheonan, Korea
6Novo Nordisk Pharma Korea Limited, Seoul, Korea
7Novo Nordisk Region Asia Pacific, Dubai, United Arab Emirates
8Department of Internal Medicine, Seoul National University Bundang Hospital, Seoul National University College of Medicine, Seongnam, Korea
- Corresponding author: Hak Chul Jang Department of Internal Medicine, Seoul National University Bundang Hospital, Seoul National University College of Medicine, 82 Gumi-ro 173beon-gil, Bundang-gu, Seongnam 13620, Korea E-mail: janghak@snu.ac.kr
Copyright © 2024 Korean Diabetes Association
This is an Open Access article distributed under the terms of the Creative Commons Attribution Non-Commercial License (http://creativecommons.org/licenses/by-nc/4.0/) which permits unrestricted non-commercial use, distribution, and reproduction in any medium, provided the original work is properly cited.
ABSTRACT
-
Background
- This study investigated the real-world efficacy and safety of insulin degludec/insulin aspart (IDegAsp) in Korean adults with type 2 diabetes mellitus (T2DM), whose insulin treatment was switched to IDegAsp.
-
Methods
- This was a multicenter, retrospective, observational study comprising two 26-week treatment periods, before and after switching to IDegAsp, respectively. Korean adults with uncontrolled T2DM treated with basal or premix insulin (±oral antidiabetic drugs) were enrolled. The primary objective was to compare the degree of glycosylated hemoglobin (HbA1c) change in each 26-week observation period. The analyses included changes in HbA1c, fasting plasma glucose (FPG), body weight, proportion of participants achieving HbA1c <7.0%, hypoglycemic events, and total daily insulin dose (ClinicalTrials.gov, number NCT04656106).
-
Results
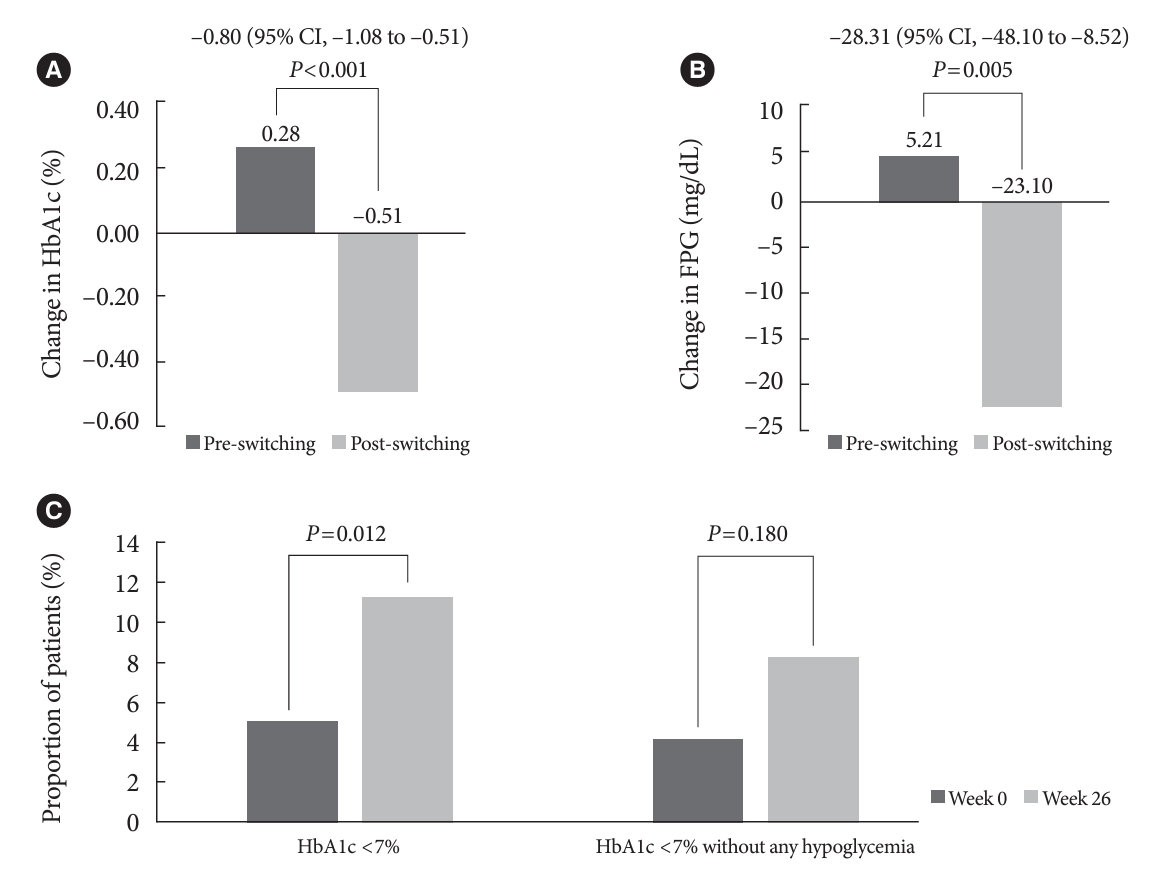
- In total, 196 adults (mean age, 65.95 years; mean T2DM duration, 18.99 years) were analyzed. The change in both HbA1c and FPG were significantly different between the pre-switching and the post-switching period (0.28% vs. –0.51%, P<0.001; 5.21 mg/dL vs. –23.10 mg/dL, P=0.005), respectively. After switching, the rate of achieving HbA1c <7.0% was significantly improved (5.10% at baseline vs. 11.22% with IDegAsp, P=0.012). No significant differences (before vs. after switching) were observed in body weight change, and total daily insulin dose. The rates of overall and severe hypoglycemia were similar in the two periods.
-
Conclusion
- In real-world clinical practice in Korea, the change of insulin regimen to IDegAsp was associated with an improvement in glycemic control without increase of hypoglycemia, supporting the use of IDegAsp for patients with T2DM uncontrolled with basal or premix insulin.
- • Switching uncontrolled T2D patients from basal or premix insulin to IDegAsp was studied in Korea.
- • Differences in HbA1c and FPG were significant between Pre-Switching and Post-Switching periods.
- • A greater proportion of patients achieved HbA1c<7.0% during the Post-Switching period.
- • No significant differences were observed in body weight change, and total daily insulin dose.
- • The rates of overall and severe hypoglycemia were similar in the two periods.
Highlights
- Type 2 diabetes mellitus (T2DM) is a progressive disease characterized by impaired glucose tolerance and deterioration of β-cell function [1]. With increase of the ageing population and changes in lifestyle, the estimated prevalence of diabetes in Korea was 16.7% in 2020 [2], and the mortality associated with T2DM was relatively higher than other countries from the Organisation for Economic Co-operation and Development (OECD) [3]. Given the increased morbidity, mortality, and health care expenditures associated with T2DM, the Clinical Practice Guidelines of the Korean Diabetes Association have emphasized the importance of individualised care and early initiation of oral antidiabetic drugs (OADs) followed by glucagon-like peptide-1 receptor agonists or insulins in parallel [4].
- In general, basal insulin is administered as the first form of the insulin therapy for T2DM. The second-generation basal insulin analogues such as insulin degludec (IDeg), provides effective glycemic control with lower rates of hypoglycemia owing to their longer duration of action and flat pharmacodynamic profile [5-7]. When uncontrolled with basal insulin, the addition of prandial insulin or switching to premix insulin can be a feasible option of insulin intensification in routine clinical practices [4,5].
- Insulin degludec/insulin aspart (IDegAsp) is a fixed ratio co-formulation of IDeg (70%) and insulin aspart (IAsp, 30%). It can be administered simply while each of insulin analogue’s components preserve their pharmacodynamic nature [8]. Given the shorter duration of action of basal insulin formulated in other premix insulins, IDegAsp can provide both better coverage of whole-day insulin needs with a lower day-to-day glucose variability (with an ultra-long duration of action with IDeg) and rapid mealtime onset (with relatively short duration of action with IAsp) for optimal glucose control with fewer injections [9]. These clinical benefits of the fixed ratio co-formulation of IDeg and IAsp were proven in several randomized controlled studies [10-14]. Although these randomized controlled studies found that IDegAsp was efficacious and safe, however, the generalizability of these findings into a real-world setting remains unclear. To date, several observational studies have been conducted but it remains uncertain whether IDegAsp results in better clinical outcomes in routine clinical settings due to heterogeneous baseline clinical and socioeconomic factors, previous treatments, and differences in study design. Recent real-world data from East Asia showed that even with the same ethnicity, glycemic control can be different across countries given different strategies of insulin intensification, practices of education and monitoring, and titration [15]. Furthermore, there is very limited data in patients uncontrolled with other premix insulins whereas 2021 Clinical Practice Guidelines in Korea positioned both basal insulin and premix insulin in parallel [4].
- Therefore, this study aimed to investigate the efficacy and related clinical outcomes of switching uncontrolled patients with T2DM with basal or premix insulin to IDegAsp in routine clinical practice in Korea.
INTRODUCTION
- This study was a multicenter, retrospective study based on a medical chart review that consisted of two consecutive 26-week treatment periods. The medical records of participants who were switched to IDegAsp from March 6, 2018 to September 2, 2020, were reviewed and collected.
- Patients with T2DM were enrolled if aged ≥19 years at the time of IDegAsp initiation; treated with basal or premix insulin±OADs for at least 26 weeks followed by changing the regimen to IDegAsp for at least 26 weeks. Patients treated by continuous subcutaneous insulin infusion prior to receiving IDegAsp were excluded from the study. The decision to change the regimen depended on each investigator’s clinical judgment in routine clinical practice in accordance with Korea Prescribing Information. IDegAsp was administered once or twice daily at each investigator’s discretion. Data were collected 26 weeks before (defined as the “pre-switching” period) and 26 weeks after switching to IDegAsp (defined as the “post-switching” period), allowing a time window of ±6 weeks for each period. The week 0 timepoint was defined as the timepoint where IDegAsp was initiated (also defined as the baseline) (Supplementary Fig. 1).
- The primary endpoint was to compare the degree of glycosylated hemoglobin (HbA1c) change between the pre-switching and the post-switching period. The secondary endpoints were to compare the changes in fasting plasma glucose (FPG), body weight, daily total insulin doses, and the incidence of overall and severe hypoglycemia during each 26-week period. The proportions of patients achieving HbA1c <7%, and <7% without any hypoglycemia were also assessed. The severity of hypoglycemia was categorized as per the Korean Clinical Practice Guidelines, defined as either overall hypoglycemia (levels 1, 2, and 3) and severe hypoglycemia (level 3) [4]. Subgroup analysis was conducted according to the previous insulin regimen before switching to IDegAsp.
- The data analysis was performed using IBM SPSS Statistics for Windows, version 21 (IBM Corp., Armonk, NY, USA). Categorical variables were reported as numbers (n) and percentages (%); continuous variables were presented as mean and standard deviation or confidence interval (CI). A Paired t-test was performed to assess changes in HbA1c, FPG, body weight, and daily total insulin dose between pre-switching and post-switching periods, and to determine the significance of the mean difference between these two periods. McNemar’s test was used to assess the proportion of patients achieving HbA1c <7%, and <7% without any hypoglycemia, and the incidence of overall and nocturnal hypoglycemia. In addition, subgroups of previous insulin regimens were compared using analysis of one-way variance (ANOVA) followed by Bonferroni’s post hoc analysis for pairwise differences. Multiple regression analysis was used to describe the relationship between HbA1c from week 0 to week 26 and the independent predictors. Missing data were not imputed, and a two-sided P<0.05 was considered significant. The P value was not adjusted for multiple testing.
- The study was conducted in accordance with the Declaration of Helsinki [16]. The study protocol was reviewed and approved by the Institutional Review Boards (IRBs) in all institutions (IRB no. CBNUH 2021-02-001-001, no. SCHCA 2021-02-001, no. KBSMC 2021-02-001, no. VC21RSDI0016, no. 3-2020-0531, no. B-2102/669-102). The study is registered with ClinicalTrials.gov, number NCT04656106.
- Availability of data and materials
- The data that support the findings of this study are available from the corresponding author upon reasonable request.
METHODS
- Baseline characteristics of the study population
- A total of 200 patients treated with either basal or premix insulin, with or without OADs were enrolled (Table 1). All patients successfully completed the study; however, four patients were excluded from the full analysis set due to deviation from the protocol. At baseline (week 0), the mean age of the participants was 65.95 years with 60.20% being male. The mean duration of T2DM was 18.99 years, with body weight 69.21 kg. The baseline HbA1c was 8.78%, and FPG 163.03 mg/dL. Among the 196 participants, 159 (81.12%) were diagnosed with hyperlipidemia, 140 (71.42%) with hypertension, 18 (9.18%) had experienced a stroke, and 60 (30.61%) had coronary artery disease. Prior to switching to IDegAsp, patients were being treated with either only basal insulin (53.57%), basal-prandial insulin (10.20%), or only premix insulin (36.22%) (Table 1, Supplementary Table 1).
- Glycemic control after switching to IDegAsp
- The HbA1c and FPG increased during the pre-switching period and decreased during the post-switching period (Table 2). Post-switching to IDegAsp, significant improvements in the HbA1c and FPG levels were observed (0.28% vs. –0.51%, P< 0.001; 5.21 mg/dL vs. –23.10 mg/dL, P=0.005) (Table 2, Fig. 1A and B). A greater proportion of patients achieved HbA1c <7% (5.10% for week 0 vs. 11.22% for week 26, P=0.012), and HbA1c <7% without any hypoglycemia (4.08% for week 0 vs. 8.16% for week 26, P=0.180) (Table 2, Fig. 1C) in the post-switching period.
- In a subgroup analysis according to the type of insulin regimen in the pre-switching period, significant differences in HbA1c levels were observed between the two periods for the group of patients previously treated with basal insulin (–1.02%; 95% CI, –1.43 to –0.62) and with premix insulin (–0.58%; 95% CI, –1.01 to –0.14) whereas no significant differences were seen in the subgroup with basal-prandial insulin therapy (–0.37%; 95% CI, –1.30 to 0.56). The FPG changes were significant only in the subgroup using premix insulin (Supplementary Table 2).
- Changes in body weight and total daily insulin dose post-switching to IDegAsp
- The change in body weight was 0.63 kg, and 0.01 kg in the pre-switching and the post-switching periods, which was not significantly different (P=0.113) (Table 2). The total daily insulin dose did not change significantly in the pre-switching period, whereas a small but significant increment up to 2 U was seen in the post-switching period (Table 2). The change in insulin dose was significant between the two observation periods only in the subgroup treated with basal-prandial insulin therapy (15.65 U; 95% CI, 2.84 to 28.46) (Supplementary Table 2).
- Incidence of hypoglycemia
- There were no significant differences in the rate of overall and nocturnal hypoglycemia between the pre-switching and post-switching periods (Table 3). In particular, there were no severe hypoglycemic events in any subjects. The incidence of nocturnal hypoglycemia was low in both periods (6% in each).
- Clinical predictors of HbA1c improvement during the post-switching period
- To identify predictors associated with improved glycemic control after switching to IDegAsp, a multiple regression analysis was performed with the degree of HbA1c change from baseline (week 0) to week 26 as a dependent variable (Table 4). Older age and higher HbA1c levels at baseline were significantly associated with HbA1c improvement on IDegAsp treatment in the post-switching period.
RESULTS
- The present study is a multicenter, retrospective observational study investigating the efficacy and safety of switching to IDegAsp from either basal or premix insulin in patients with T2DM. The findings from this study demonstrated that the switch to IDegAsp led to an improvement in glycemic control without an increase in body weight or hypoglycemia in real-world clinical practice. A 26-week treatment with basal or premix insulin therapy (pre-switching period) was associated with an increase in HbA1c with no significant change in FPG levels, and significantly small increase in body weight (0.63 kg). In contrast, switching to IDegAsp resulted in significant reductions in HbA1c and FPG, and greater proportions of patients achieved a target of HbA1c <7% with no increase of body weight. Importantly, no differences were reported in the incidence of overall, severe, and nocturnal hypoglycemia.
- The high baseline HbA1c (8.78%) and FPG (163.03 mg/dL) in this study highlights inadequate glycemic control under real-world conditions in patients receiving insulin regimen. This coupled with other characteristics like long standing T2DM, insulin treatment >6 years, implies a strong unmet need for newer insulin analogues in this patient population.
- Previous real-world studies demonstrated the effectiveness and safety of IDegAsp for the treatment of T2DM [15,17-19]. In two studies, compared to basal insulin, IDegAsp showed a significant reduction in HbA1c with no difference in FPG levels [17,18]. However, the changes in total daily insulin doses were inconsistent across studies, which may be attributed to different treatment approaches across countries under real-world clinical practice [15,17-19]. In the a ryzodeg initiation and switch effectiveness (ARISE) study for East Asian population, not only HbA1c but also FPG reduction was demonstrated after switching to IDegAsp. However, in contrast to the present study, the ARISE study included all patients with any antidiabetic medications, except IDegAsp before the switch, and the participants had higher HbA1c levels at baseline compared to the present study [15].
- The current study confirms the previous effect of IDegAsp for improving the glycemic parameters in patients with uncontrolled T2DM previously treated with basal or premix insulin (±OADs). Furthermore, our findings examined clinical factors associated with improved HbA1c which were not investigated in real-world data to date. Older age and higher baseline HbA1c levels were the predictors for greater HbA1c reduction at week 26 after switching to IDegAsp. Sex, body mass index, duration of T2DM, duration of insulin therapy, or baseline insulin doses were not associated with HbA1c reduction of IDegAsp.
- In the subgroup analysis by insulin regimen in the pre-switching period, significant HbA1c reduction changes between the two periods were shown in patients treated with ‘basal insulin’ or ‘premix insulin’ whereas these changes were not significant in the group previously treated with ‘basal-prandial insulin’ which has limited number of study population (n=20). To the best of our knowledge, there is only one observational study that evaluated the benefits of switching to IDegAsp from basal-prandial insulin therapy, which makes it difficult to compare the results with our study. Different levels of HbA1c at baseline (9.8% for the ARISE study [15] vs. 8.78% for the current study), and differences in titrations and monitoring practices might have contributed to varying results. However, considering the treatment complexity and number of injections, IDegAsp might also provide benefits to those using basal-prandial insulin therapy.
- There are several unique points in our study. The study was designed to compare the clinical outcomes 6 months before and after the treatment with IDegAsp, which enabled the investigators to assess the robust benefits of IDegAsp for a given treatment period of intensification under real-world clinical practice. Also, the predictors associated with HbA1c improvement will be able to provide further insights into clinical decisions. The subgroup analysis by previous insulin regimen before switching to IDegAsp may warrant larger, longer-term observational studies to further dissect our findings.
- This study also has potential limitations. First, due to the nature of retrospective design, First, due to the nature of retrospective design, there is the possibility that overall and nocturnal hypoglycemia may not have been adequately reported, with a recall bias. Also, the reasons of clinical decision for switching to IDegAsp were not assessed in the present study. It is pertinent to note that they may align with reasons elucidated in previous studies [15,17,19], including the needs for further glycemic control, reduction of hypoglycemia, and improvement of compliance. Second, factors such as insulin adherence, dietary habits, and physical activity levels, that could impact overall glycemic control, were not documented. Finally, subgroup analysis by previous insulin regimen was based on low sample size which may limit our findings in these subgroups. Nonetheless, given that limited data are available on clinical outcomes of IDegAsp in Korean adults with T2DM, our study provides important real-world insights on the use of IDegAsp in insulin intensification. Future investigations with larger sample size and various clinical parameters such as insulin secretion capacity are needed to further elucidate the effectiveness and safety of IDegAsp in the Korean population.
- To summarize, the current study demonstrated that when T2DM subjects are uncontrolled with conventional basal insulin therapy or premix insulin therapy, switching to IDegAsp can provide additional clinical benefits including improved glycemic control, with no difference in weight gain or incidence of hypoglycemia.
DISCUSSION
SUPPLEMENTARY MATERIALS
Supplementary Table 1.
Supplementary Table 2.
Supplementary Fig. 1.
-
CONFLICTS OF INTEREST
Boram Bae, Amine Dahaoui, Jin Sook Jeong, and Sungeun Jung are employees of Novo Nordisk. The other authors declare no conflict of interest with respect to the study.
-
AUTHOR CONTRIBUTIONS
Conception or design: S.K.
Acquisition, analysis, or interpretation of data: all authors.
Drafting the work or revising: all authors.
Final approval of the manuscript: all authors.
-
FUNDING
The study was funded by Novo Nordisk Pharma Korea Ltd.
NOTES
-
Acknowledgements
- The authors would like to thank all the participants, investigators, and study staff, as well as In Tae Kim (Novo Nordisk Pharma Korea Ltd., Seoul, Korea) for the inputs on study design and protocol, and Gyoung-rye Ham (PrimeCore Consulting Ltd., Seoul, Korea) for medical writing and editorial assistance (funded by Novo Nordisk Pharma Korea Ltd.).

Values are presented as mean±standard deviation or number (%).
T2DM, type 2 diabetes mellitus; BMI, body mass index; HbA1c, glycosylated hemoglobin; FPG, fasting plasma glucose; LDL-C, low-density lipoprotein cholesterol; HDL-C, high-density lipoprotein cholesterol; IDegAsp, insulin degludec/insulin aspart.
| Variable |
Pre-switching |
Post-switching |
P valuea,b (pre- vs. post-switching) | ||||
|---|---|---|---|---|---|---|---|
| Week –26 | Week 0 | P valuea | Week –26 | Week 0 | P valuea | ||
| HbA1c, % | 8.50±1.31 | 8.78±1.25 | 0.002 | 8.78±1.25 | 8.27±1.17 | <0.001 | - |
| Change in the 26-week period | 0.28±1.27 | - | –0.51±1.12 | - | <0.001 | ||
| FPG, mg/dL | 158.03±63.98 | 163.24±65.64 | 0.369 | 163.24±65.64 | 140.15±55.37 | <0.001 | - |
| Change in the 26-week period | 5.21±80.41 | - | –23.10±78.65 | - | 0.005 | ||
| Proportion of achieving HbA1c <7% | 18 (9.18) | 10 (5.10) | 0.057 | 10 (5.10) | 22 (11.22) | 0.012 | - |
| Proportion of achieving HbA1c <7% without any hypoglycemia | 6 (4.08) | - | 12 (8.16) | - | 0.180 | ||
| Body weight, kg | 69.11±13.54 | 69.74±13.97 | 0.010 | 69.74±13.97 | 69.75±13.74 | 0.980 | - |
| Change in the 26-week period | 0.63±2.84 | - | 0.01±2.36 | - | 0.113 | ||
| Daily total insulin dose, U | 37.42±21.80 | 39.15±20.92 | 0.079 | 39.15±20.92 | 41.14±22.91 | 0.001 | - |
| Change in the 26-week period | 1.72±13.69 | - | 1.98±8.54 | - | 0.828 | ||
| Daily total insulin dose, U/kg | 0.53±0.27 | 0.56±0.28 | 0.075 | 0.56±0.28 | 0.58±0.29 | 0.024 | - |
| Change in the 26-week period | 0.03±0.18 | - | 0.02±0.11 | - | 0.765 | ||
| Variable | Pre-switching | Post-switching | P valuea |
|---|---|---|---|
| Overall hypoglycemic events | 34 (23.13) | 32 (21.77) | 0.860 |
| Severe hypoglycemic events | 0 | 0 | NA |
| Nocturnal hypoglycemic events | 6 (4.76) | 6 (4.76) | 1.000 |
Values are presented as number (%) (with ≥1 hypoglycemic events).
Nocturnal hypoglycemia was an event for which the words ‘nocturnal’ or ‘night’ or their equivalent were recorded and/or the time of the event was recorded as being between midnight and 6:00 AM.
NA, not applicable.
a McNemar’s exact test.
Values are presented as unstandardized coefficients (B) and standardized coefficient (β) using multiple regression analysis (Enter method of independent variables). Dependent variable was baseline value in HbA1c at week 0; R square (adjusted R square): 0.315 (0.279); F=8.74. This analysis was performed using multiple regression (Enter method of independent variables).
HbA1c, glycosylated hemoglobin; IDegAsp, insulin degludec/insulin aspart; BMI, body mass index; T2DM, type 2 diabetes mellitus.
- 1. Butler AE, Janson J, Bonner-Weir S, Ritzel R, Rizza RA, Butler PC. Beta-cell deficit and increased beta-cell apoptosis in humans with type 2 diabetes. Diabetes 2003;52:102-10.PubMed
- 2. Bae JH, Han KD, Ko SH, Yang YS, Choi JH, Choi KM, et al. Diabetes fact sheet in Korea 2021. Diabetes Metab J 2022;46:417-26.ArticlePubMedPMCPDF
- 3. Organisation for Economic Co-operation and Development. OECD Health Statistics 2022. Available from: https://stats.oecd.org/Index.aspx?QueryId=30115 (cited 2024 Jan 16).
- 4. Ko SH. 2021 Clinical practice guidelines for diabetes mellitus in Korea. J Korean Diabetes 2021;22:244-9.ArticlePDF
- 5. American Diabetes Association Professional Practice Committee. 9. Pharmacologic approaches to glycemic treatment: standards of medical care in diabetes-2022. Diabetes Care 2022;45(Suppl 1):S125-43.ArticlePubMedPDF
- 6. Rodbard HW, Cariou B, Zinman B, Handelsman Y, PhilisTsimikas A, Skjoth TV, et al. Comparison of insulin degludec with insulin glargine in insulin-naive subjects with type 2 diabetes: a 2-year randomized, treat-to-target trial. Diabet Med 2013;30:1298-304.ArticlePubMedPMCPDF
- 7. Zinman B, Philis-Tsimikas A, Cariou B, Handelsman Y, Rodbard HW, Johansen T, et al. Insulin degludec versus insulin glargine in insulin-naive patients with type 2 diabetes: a 1-year, randomized, treat-to-target trial (BEGIN Once Long). Diabetes Care 2012;35:2464-71.PubMedPMC
- 8. Haahr H, Fita EG, Heise T. A review of insulin degludec/insulin aspart: pharmacokinetic and pharmacodynamic properties and their implications in clinical use. Clin Pharmacokinet 2017;56:339-54.ArticlePubMedPDF
- 9. Novo Nordisk A/S. Ryzodeg summary of product characteristics. Available from: https://www.ema.europa.eu/en/documents/product-information/ryzodeg-epar-product-information_en.pdf (cited 2024 Jan 16).
- 10. Franek E, Haluzik M, Canecki Varzic S, Sargin M, Macura S, Zacho J, et al. Twice-daily insulin degludec/insulin aspart provides superior fasting plasma glucose control and a reduced rate of hypoglycaemia compared with biphasic insulin aspart 30 in insulin-naïve adults with type 2 diabetes. Diabet Med 2016;33:497-505.ArticlePubMedPDF
- 11. Fulcher GR, Christiansen JS, Bantwal G, Polaszewska-Muszynska M, Mersebach H, Andersen TH, et al. Comparison of insulin degludec/insulin aspart and biphasic insulin aspart 30 in uncontrolled, insulin-treated type 2 diabetes: a phase 3a, randomized, treat-to-target trial. Diabetes Care 2014;37:2084-90.ArticlePubMedPDF
- 12. Kaneko S, Chow F, Choi DS, Taneda S, Hirao K, Park Y, et al. Insulin degludec/insulin aspart versus biphasic insulin aspart 30 in Asian patients with type 2 diabetes inadequately controlled on basal or pre-/self-mixed insulin: a 26-week, randomised, treat-to-target trial. Diabetes Res Clin Pract 2015;107:139-47.ArticlePubMed
- 13. Niskanen L, Leiter LA, Franek E, Weng J, Damci T, Munoz-Torres M, et al. Comparison of a soluble co-formulation of insulin degludec/insulin aspart vs biphasic insulin aspart 30 in type 2 diabetes: a randomised trial. Eur J Endocrinol 2012;167:287-94.ArticlePubMedPMC
- 14. Yang W, Ma J, Hong T, Liu M, Miao H, Peng Y, et al. Efficacy and safety of insulin degludec/insulin aspart versus biphasic insulin aspart 30 in Chinese adults with type 2 diabetes: a phase III, open-label, 2:1 randomized, treat-to-target trial. Diabetes Obes Metab 2019;21:1652-60.ArticlePubMedPMCPDF
- 15. Fulcher GR, Akhtar S, Al-Jaser SJ, Medina J, Mohamed M, Nicodemus NA Jr, et al. Initiating or switching to insulin degludec/insulin aspart in adults with type 2 diabetes: a real-world, prospective, non-interventional study across six countries. Adv Ther 2022;39:3735-48.ArticlePubMedPMCPDF
- 16. World Medical Association. World Medical Association Declaration of Helsinki: ethical principles for medical research involving human subjects. JAMA 2013;310:2191-4.ArticlePubMed
- 17. Jang HN, Yang YS, Lee SO, Oh TJ, Koo BK, Jung HS. Favorable glycemic control with once-daily insulin degludec/insulin aspart after changing from basal insulin in adults with type 2 diabetes. Endocrinol Metab (Seoul) 2019;34:382-9.PubMedPMC
- 18. Jang HN, Yang YS, Oh TJ, Koo BK, Lee SO, Park KS, et al. Low fasting glucose-to-estimated average glucose ratio was associated with superior response to insulin degludec/aspart compared with basal insulin in patients with type2 diabetes. J Diabetes Investig 2022;13:85-93.ArticlePubMedPDF
- 19. Shigiyama F, Liu L, Nordahl H, Suzuki R, Yamamoto Y, Hirose T. A real-world, prospective, non-interventional study of adults with T2D switching to IDegAsp from glargine U100 or U300 in Japan. Diabetes Ther 2021;12:2405-21.ArticlePubMedPMCPDF
REFERENCES
Figure & Data
References
Citations
 PubReader
 ePub Link
 Cite
Cite- Figure
-


- Related articles
-
- Risk Prediction and Management of Chronic Kidney Disease in People Living with Type 2 Diabetes Mellitus
- Clinical and Lifestyle Determinants of Continuous Glucose Monitoring Metrics in Insulin-Treated Patients with Type 2 Diabetes Mellitus
- Safety of COVID-19 Vaccines among Patients with Type 2 Diabetes Mellitus: Real-World Data Analysis
- Cardiovascular Outcomes according to Comorbidities and Low-Density Lipoprotein Cholesterol in Korean People with Type 2 Diabetes Mellitus
- Intensified Multifactorial Intervention in Patients with Type 2 Diabetes Mellitus


