ABSTRACT
-
Background
- Both type 1 diabetes mellitus (T1DM) and metabolic syndrome (MetS) are associated with an elevated risk of morbidity and mortality yet with increasing heterogeneity. This study primarily aimed to evaluate the prevalence of MetS among adult patients with T1DM in China and investigate its associated risk factors, and relationship with microvascular complications.
-
Methods
- We included adult patients who had been enrolled in the Guangdong T1DM Translational Medicine Study conducted from June 2010 to June 2015. MetS was defined according to the updated National Cholesterol Education Program criterion. Logistic regression models were used to estimate the odds ratio (OR) for the association between MetS and the risk of diabetic kidney disease (DKD) and diabetic retinopathy (DR).
-
Results
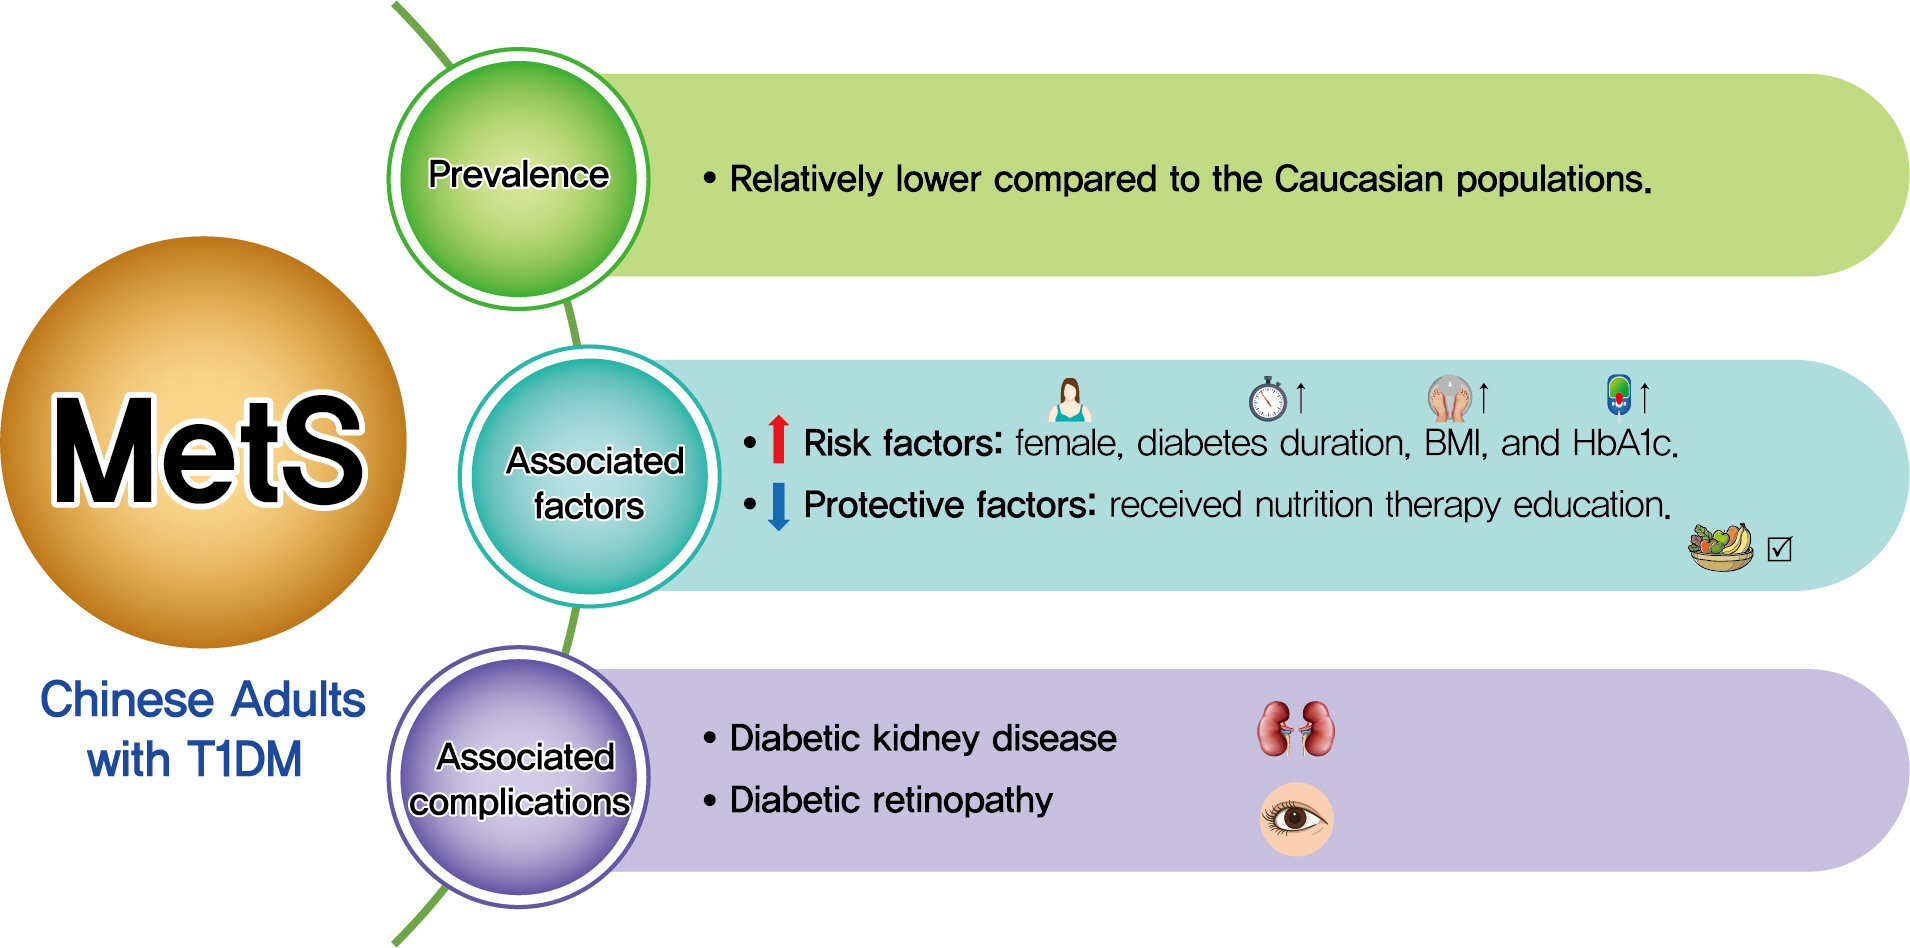
- Among the 569 eligible patients enrolled, the prevalence of MetS was 15.1%. While female gender, longer diabetes duration, higher body mass index, and glycosylated hemoglobin A1c (HbA1c) were risk factors associated with MetS (OR, 2.86, 1.04, 1.14, and 1.23, respectively), received nutrition therapy education was a protective factor (OR, 0.46). After adjustment for gender, age, diabetes duration, HbA1c, socioeconomic and lifestyle variables, MetS status was associated with an increased risk of DKD and DR (OR, 2.14 and 3.72, respectively; both P<0.05).
-
Conclusion
- Although the prevalence of MetS in adult patients with T1DM in China was relatively low, patients with MetS were more likely to have DKD and DR. A comprehensive management including lifestyle modification might reduce their risk of microvascular complications in adults with T1DM.
-
Keywords: Adult; Diabetes mellitus, type 1; Diabetic nephropathies; Diabetic retinopathy; Metabolic syndrome
Graphical abstract
INTRODUCTION
- Metabolic syndrome (MetS) is characterized by glucose intolerance, central obesity, hypertension, and dyslipidemia [1]. MetS is not only generally associated with an increased risk of cardiovascular disease and type 2 diabetes mellitus [2] but is also increasingly observed in patients with type 1 diabetes mellitus (T1DM) [3-5].
- As known, T1DM prevalence and clinical characteristics vary among populations. The prevalence of MetS and its components in various populations also differed [6,7]. For example, T1DM patients have a higher risk for long-term microvascular complications than the general population, causing a high health burden and excessive mortality. MetS and T1DM may have a different impact on the development of microvascular complications among diverse populations. In nondiabetic adults, both MetS and all its components were associated with an increased risk for chronic kidney disease and retinopathy [8-11]. However, these effects remain controversial in T1DM patients: some studies showed that MetS was associated with a higher risk of diabetic kidney disease (DKD) and diabetic retinopathy (DR) [3,5,12], whereas others failed to establish such associations [13,14]. Therefore, investigations are necessary on the relationship between MetS and microvascular complications in different T1DM populations.
- To date, the evidence concerning the coexistence of MetS and T1DM has mostly been established in Caucasian populations. According to the National Cholesterol Education Program, Adult Treatment Panel III (NCEP-ATPIII) criterion, the prevalence of MetS among Caucasian patients with T1DM was 25% to 42% [3-5,15]. It is well known that obesity epidemics and dietary patterns vary considerably between Caucasian and Asian populations. In patients with T1DM, the proportion of obesity among adult patients in the T1DM Exchange clinic registry [16] and our previous T1DM registry study in China [17] were 22% and 0.9%, respectively, suggesting that obesity was more prevalent among Caucasian patients with T1DM. Moreover, previous studies demonstrated that the adherence to the western dietary pattern was associated with an increased risk of MetS [18]. In contrast, the adherence to the Mediterranean diet was associated with a reduced risk of MetS [19]. As obesity and insulin resistance are closely linked and are both associated with MetS [20], a discrepancy between obesity epidemic and dietary patterns may impact the prevalence of MetS in different populations.
- Only a few studies investigated the MetS status in Asian patients with T1DM and reported varied prevalence rates for MetS. Research conducted in southern India, Korea, and China reported that MetS occurred in 22.2%, 55.1%, and 10.1% of patients with T1DM, respectively [21-23]. However, all these studies were performed in all-age populations. Previous studies among the Caucasian population showed that adults with T1DM had a higher prevalence of MetS than children and adolescent patients (25.5%–39.0% vs. 7.0%–9.5%) [24-26]. Hence, identifying the disease burden in the adult population would enable the prioritization and implementation of interventions. Although the study from China [23] enrolled patients from two different cities from northern and southern China (Beijing and Shantou), the International Diabetes Federation (IDF) criterion was applied for the diagnosis of MetS, which hindered the comparison of their results with those of other studies.
- Therefore, we conducted this retrospective, cross-sectional study, using data at the enrollment from the Guangdong T1DM Translational Medicine (GTT) study. We aimed to fully present the MetS status in adult T1DM patients in China and compare data of other populations, using the NCEP-ATPIII criterion of MetS. The characteristics of MetS among adult Chinese patients with T1DM were investigated, including the prevalence, and its risk factors, and relationship with microvascular complications.
METHODS
- Study design and participants
- Patients from the GTT study, which was initiated in June 2010, were included. The GTT study has established the T1DM network database system, which comprised 16 tertiary hospitals throughout 12 cities in Guangdong, China and whose details were previously reported [17,27]. It was approved by the Ethics Committee of the Third Affiliated Hospital of Sun Yat-sen University (IRB No. [2014] 2-55). Each participant provided a written informed consent.
- The inclusion criteria for T1DM patients were essentially based on the descriptions of T1DM by the American Diabetes Association (ADA) and the World Health Organization (WHO), and the inclusion criteria of the Search for Diabetes in Youth Study (SEARCH) and the Diabetes Control and Complications Trial (DCCT), as outlined in a previous report [17]. In brief, patients enrolled in the GTT study were diagnosed with T1DM by an endocrinologist and characterized by insulin dependency shortly after diagnosis. In addition, they had to meet at least one of the following criteria: (1) symptoms of hyperglycemia at diagnosis; (2) a history of diabetic ketoacidosis or ketosis; (3) tested positive for T1DM associated autoantibodies; and (4) fasting and stimulated C-peptide levels <200 pmol/L. After the initial diagnosis, we ensured that the patients would be followed-up for no less than 18 months to confirm their insulin-dependency to avoid misdiagnosis [28].
- We included adult patients (aged ≥18 years) with T1DM and with diabetes duration ≥1 year, whose data at enrollment were analyzed. As thyroid function has an impact on lipid and glucose metabolism as well as blood pressure [29], patients with abnormal thyroid-stimulating hormone (TSH) levels (reference range, 0.35 to 4.94 µIU/mL) were excluded. We further excluded patients who had missing measurements regarding MetS components (waist circumference, fasting blood glucose, blood pressure, serum triglyceride, and high-density lipoprotein cholesterol [HDL-C]).
- Definitions
- We collected participants’ demographic and clinical information from their medical records or self-reports (obtained using a standardized questionnaire) at enrollment. A physical examination was performed, and blood and urine samples were also collected for biochemical measurements. Participants aged between 1 and 17 years that were diagnosed with T1DM were classified to have a childhood-onset form of T1DM, whereras those diagnosed at 18 years or older were categorized to have an adult-onset form of the disease. A family history of diabetes or T1DM was defined as at least one first-degree family member with a positive history of diabetes or T1DM, respectively.
- Based on the nutrition recommendations and interventions for diabetes by the ADA [30], a recommended diabetic diet included a proper amount of carbohydrate intake based on insulin-to-carbohydrate ratios and good-quality protein, low-saturated fat and dietary cholesterol. Each participant’s meal condition during a week was recorded, and ≥50% of the participant’s meals following the above instruction were defined as adhering to a diabetic diet. Nutrition therapy education received was defined as the education received from physicians, nurses, nutritionists, or other healthcare providers. We defined the patients who reported to have received nutrition therapy education and to be adherent to diabetic diet as ‘effectively educated for nutrition therapy.’
- “Physically active” was defined as having an exercise time ≥150 min/week. “Smoker” was any current smokers or a patients that had ever smoked any amount of tobacco during the last year before enrollment. “Alcohol drinker” was a patient who was a current alcohol drinkers or had ever drunk any alcohol in the year preceding enrollment. “Active-clinic-visit status” was defined as clinic visit times per year ≥12. The insulin regimen was categorized as insulin pump, basal-bolus insulin therapy, and others. “Basal-bolus insulin therapy” was defined as basal insulin plus bolus insulin injections ≥3 times per day. “Others” represented basal insulin therapy or bolus insulin therapy, or premixed insulin regimen alone.
- Body mass index (BMI) cut-off values for underweight, normal weight, overweight and obesity were set at <18.5, 18.5– 24.9, 25.0–29.9, and ≥30 kg/m2, respectively. Poor glycemic control was defined as glycosylated hemoglobin A1c (HbA1c) ≥9%. Insulin resistance was calculated by a model derived from Chinese adult patients with T1DM: napierian logarithm of glucose disposal rate (lnGDR) =4.964–0.121 ×HbA1c (%)–0.012×diastolic blood pressure (mm Hg)–1.409×waist-to-hip ratio [31].
- The diagnosis of MetS was based on the updated NCEP-ATPIII criterion [1]. All participants were assumed to have hyperglycemia. Participants were diagnosed with MetS if they had two or more of the following four components: (1) central obesity (waist circumference ≥90 cm in men or ≥80 cm in women); (2) hypertension (systolic blood pressure ≥130 and/or diastolic blood pressure ≥85 mm Hg and/or a history of antihypertensive therapy); (3) hypertriglyceridemia (serum triglyceride levels ≥1.7 mmol/L); and (4) low HDL-C level (HDL-C <1.0 mmol/L in men or <1.3 mmol/L in women). The primary outcomes are the proportion of MetS and its relationship with DKD and DR in T1DM patients.
- According to the Modification of Diet in Renal Disease (MDRD) formula recalibrated for the Chinese population, estimated glomerular filtration rate (eGFR) expressed in mL/min/ 1.73 m2 was calculated using the following formula: eGFR= 175×(serum creatinine×0.011)–1.234×(age)–0.179 (×0.79 if female), where serum creatinine was expressed in μmol/L [32]. DKD was defined as a urinary albumin-creatinine ratio of ≥30 mg/g or by an eGFR <60 mL/min/1.73 m2 or associated treatment history. The presence of DR was determined on stereoscopic fundal photography or a retinopathy treatment history [33].
- Measurements
- Waist circumference was measured at the mid-point between the lowest rib and the iliac crest. Hip circumference was measured at the widest point of the gluteal muscles. Resting systolic and diastolic blood pressure values were the averages of two measurements taken in a sitting position with a random zero sphygmomanometer. HbA1c, lipid profile, serum creatinine levels, urine albumin, and creatinine levels were measured as previous studies reported [3,15,27].
- Statistical analysis
- We used descriptive statistics to describe participants’ characteristics. Normally distributed variables were expressed as mean±standard deviation. Non-normally distributed variables were presented as median (interquartile range). Categorical variables were described as numbers and percentages. A two-sample Student’s t-test, Wilcoxon rank-sum test, or chi-square test was used to compare the characteristics of patients with and without MetS. The receiver operating characteristic (ROC) curve was applied to assess the sensitivity and specificity of using variables, including diabetes duration, BMI, HbA1c levels, or a combination of the above variables to diagnose MetS in T1DM patients. Logistic regression models were implemented to examine the association between MetS, DKD, and DR. Estimate odds ratio (OR) and 95% confidence interval (CI) were calculated. A two-tailed P value <0.05 was considered statistically significant. All statistical analyses were performed using SPSS software version 20.0 (IBM Co., Armonk, NY, USA).
RESULTS
- Study population and metabolic syndrome
- A total number of 1,412 patients with T1DM were enrolled in the GTT study between June 2010 and June 2015. We excluded those with diabetes duration <1 year, aged <18 years at enrollment, with missing data on at least one MetS component or with an abnormal TSH level. Finally, 569 patients with T1DM (55.4% female) were included in this analysis. Details are presented in Fig. 1.
- The mean age was 34.8 years, and the median diabetes duration was 5.9 years. The proportion of participants who met the updated NCEP-ATPIII definition of MetS was 15.1%. The proportions of the patients having 1, 2, 3, or 4 MetS components were 51.0%, 33.9%, 11.4%, and 3.7%, respectively. The proportions of participants with central obesity, hypertension, hypertriglyceridemia, and low HDL-C were 14.2%, 19.5%, 16.9%, and 17.2%, correspondingly.
- Compared to adult-onset patients, childhood-onset patients had a higher percentage of MetS (13.3% vs. 21.2%, P=0.026). In addition, childhood-onset patients had a longer diabetes duration and higher HbA1c level than the adult-onset patients (9.3% vs. 5.1%, P<0.001; and 9.0% vs. 8.4%, P=0.044, respectively). It is also noteworthy that the prevalence of DKD in childhood-onset patients was higher than that in adult-onset patients (28.0% vs. 19.5%, P=0.026) (Supplementary Tables 1 and 2).
- The proportion of women with MetS was higher than that of men with MetS (21.3% vs. 7.5%, P<0.001). Additionally, female patients with T1DM had a higher proportion of central obesity and lower HDL-C level than male patients (23.5% vs. 2.8%, and 24.4% vs. 8.3%, respectively; both P<0.001).
- Demographic, socioeconomic, and lifestyle characteristics of the patients with and without MetS at the enrollment are provided in Table 1. Diabetes duration was longer in patients with MetS than in those without MetS. Participants with MetS were more likely to be female and childhood-onset. Besides, patients with MetS had a lower rate for received nutrition therapy education than those without MetS.
- The clinical characteristics of the patients with and without MetS at enrollment are listed in Table 2. The participants with MetS were more likely to be overweight or obese, and to have higher levels of HbA1c, and a higher percentage of poor glycemic control (HbA1c ≥9%). Furthermore, the patients with T1DM and MetS presented lower lnGDR (1.7 vs. 1.9, P<0.001), suggesting lower GDR and more severe insulin resistance.
- Risk factors associated with MetS
- The logistic regression analysis results, inlcluding the risk factors significantly associated with MetS in the univariate analysis have been summarized in Table 3. We found that female gender (OR, 2.86; 95% CI, 1.63 to 5.02), longer diabetes duration (OR, 1.04; 95% CI, 1.00 to 1.08), higher BMI (OR, 1.14; 95% CI, 1.03 to 1.25) and HbA1c (OR, 1.23; 95% CI, 1.11 to 1.36) were risk factors associated with MetS. By contrast, received nutrition therapy education (OR, 0.46; 95% CI, 0.26 to 0.78) was protective against MetS (all P<0.05). Logistic regression analysis showed that the number of hypoglycemic events per month is not associated with being overweight/obese in our participants (OR, 0.92; P=0.154).
- As shown in Fig. 2, the ROC curve was used to evaluate the diagnosis of MetS with different variables among T1DM patients. The area under curve (AUC) for the combination of diabetes duration, BMI, and HbA1c was 0.68 (95% CI, 0.61 to 0.75; P<0.001). Among these three variables, AUC for BMI appeared to be the highest, which was 0.66 (95% CI, 0.59 to 0.73; P<0.001). Moreover, the AUC for diabetes duration and HbA1c alone were 0.59 (95% CI, 0.52 to 0.66; P=0.012) and 0.57 (95% CI, 0.50 to 0.63; P=0.055), respectively. Youden index indicated that BMI value of 21.6 kg/m2, diabetes duration of 9.5 years, and the HbA1c level of 9.4% correlated best with the presence of MetS, respectively.
- Relationship between MetS and microvascular complications
- The prevalence of DKD and DR in all participants was 21.5% and 10.4%, correspondingly. The prevalence of DKD and DR among patients with MetS was approximately twice than that without MetS (36.5% vs. 18.9%, 19.8% vs. 8.7%, respectively; both P<0.001). Regarding the association between MetS status and microvascular complications, logistic regression analysis showed that MetS increased the risk of DKD (OR, 2.14; 95% CI, 1.12 to 4.11) and DR (OR, 3.72; 95% CI, 1.59 to 8.72) after adjustment for potential confounding factors (Table 4).
DISCUSSION
- To our knowledge, this is the first study to investigate MetS status, its associated risk factors, and the relationship with microvascular complications in Chinese adult patients with T1DM. Our results showed that the prevalence of MetS in Chinese adult patients with T1DM was relatively low. Importantly, longer diabetes duration, female gender, higher BMI, and HbA1c were risk factors associated with MetS, whereas received nutrition therapy education is protective against MetS. MetS status was also associated with an increased risk for DKD and DR after adjustment for confounding variables.
- MetS was far more prevalent among Caucasian patients with T1DM than in Chinese patients with T1DM. For example, 42.1%, 39.0%, 33.7%, and 25.4% of T1DM patients from Australia, Finland, Italy, Germany, and Austria, respectively, met the NCEP-ATPIII criterion of MetS [3,4,12,15]. As for MetS components, participants from the FinnDiane study had a markedly higher percentage of hypertension and a lower HDL-C level than our participants. Moreover, the patients in the FinnDiane study were also more obese than the participants included in this investigation regardless of their MetS status. The difference in diabetes duration also accounted for MetS prevalence difference between the FinnDiane study and our study, which as supported by our finding that MetS was associated with diabetes duration.
- The prevalence of Mets among Asian patients with T1DM varied considerably across countries. A study in adult and children patients with T1DM conducted in southern India showed MetS prevalence of 22.2% [21]. In Korea, age and sex-adjusted patients with T1DM of all ages showed MetS prevalence of 55.1% [22]. However, the authors of the Korean study admitted that they might have overestimated the percentage of MetS as they expanded the criteria of high triglyceride and low HDL-C level for MetS to lipid-lowing therapy. One Chinese survey enrolled 849 patients with T1DM and reported that the percentage of MetS was 10.1% [23]. However, these researches adopted the IDF criterion for the diagnosis of MetS and enrolled both adult and children patients, which hindered the comparison with data from other populations.
- We found that longer diabetes duration, higher BMI, and HbA1c were associated with MetS, which is consistent with the results of previous studies [12,21]. Intensive insulin therapy in long-standing patients may play a role in this phenomenon. Intensively treated patients gained an average of 4.8 kgs more than the conventionally treated group after 6-year follow-up in the DCCT study [34]. A European investigation of 3,250 patients with T1DM revealed that patients with significant weight gain had higher blood pressure and lipids levels [35]. In these patients, insulin therapy and obesity might have also induced and aggravated insulin resistance. Under the condition of insulin resistance and multiple metabolic abnormalities, patients not only required a higher insulin dose but also had poor glycemic control. Thus, the clustering of the above abnormalities poses great difficulty in treating long-standing patients. In support of this, we found that the childhood-onset patients in our study had longer diabetes duration, higher HbA1c level and a higher proportion of MetS. The aforementioned findings call for comprehensive management of the above risk factors in clinical care.
- In the current study, we found that MetS was much more common among women than among men (22.8% vs. 7.4%, respectively; P<0.001), which was in agreement with the findings of the studies conducted in Finland, Italy, and Korea [3,4,22]. The differences between women and men were due mainly to the higher percentage of central obesity and low HDL-C level in the women. However, the underlying reason for this discrepancy is unclear. Moreover, we did not notice a significant difference in risk factors of MetS between childhood-onset and adult-onset T1DM patients in our study (Supplementary Table 3).
- Our results also showed that a history of nutrition therapy education was protective against MetS in patients with T1DM. A study from Brazil found that patients with T1DM who reported adherence to the diet prescribed by health care professionals had better BMI and lower HbA1c, diastolic blood pressure, and triglyceride levels [36]. The underlying mechanisms may be related to the improvement of inflammation and endothelial dysfunction [37,38]. Consistent with this result, a randomized trial revealed that MetS patients following a Mediterranean-style diet had improved their endothelial dysfunction and vascular inflammation, and decreased the prevalence of MetS [39]. Therefore, from a practical perspective, education on nutrition therapy of T1DM-MetS patients should be promoted.
- Previous studies have shown that MetS are associated with a higher risk of DKD [3,4,14,21] and DR [4] in patients with T1DM. For instance, the FinnDiane study showed that patients with MetS had a 3.75-fold OR for diabetic nephropathy. Moreover, an Indian study showed that MetS was positively associated with DR (OR, 2.82). Consistent with the above results, our investigation found that the MetS status was associated with DKD and DR. Most probably, central obesity, hypertension, and dyslipidemia contributed to the interaction between insulin resistance, oxidative stress, chronic inflammation, endothelial dysfunction, as well as microvascular damage and remodeling, which led to the onset and progression of microvascular complications [4]. The DCCT study has shown that intensive glycemic control significantly reduced the risk of microvascular complications in patients with T1DM [40,41]. The Diabetic Retinopathy Candesartan Trials (DIRECT) and the Ace-Inhibitor Trial to Lower Albuminuria in Normotensive Insulin-Dependent Subjects Study (ATLANTIS) have revealed that lowering the blood pressure reduced the risk of the incidence or progression of DR and DKD in T1DM [42,43]. The aforementioned evidence necessitated multifactorial management among T1DM-MetS patients for better long-term outcomes.
- The current study has some limitations. First, it was hospital-based. However, for the diagnosis of T1DM in Chinese patients was confirmed in tertiary hospitals. After diagnosis, patients with T1DM were subsequently followed up in the same tertiary hospitals or primary care centers. Therefore, through the recruitment of patients from these tertiary hospitals, we could access most T1DM patients in China. Second, cross-sectional nature of this investigation revealed only associations rather than causative relationships. Hence, a follow-up study with measurements of MetS components and HbA1c during the follow-up period would be more appropriate to conduct. Lastly, data were missing because of our study’s retrospective data acquisition, such as insulin doses, hypertension and hyperlipidemia treatments. However, the demographic characteristics of the participants were similar with and without the missing data.
- In conclusion, we found that the prevalence of MetS in Chinese adult patients with T1DM was relatively low. Importantly, longer diabetes duration, female gender, higher BMI, and HbA1c are risk factors associated with MetS, whereas the received nutrition therapy education is protective against MetS. MetS status was associated with an increased risk for DKD and DR. Efforts are required to identify such patients, and comprehensive management, including lifestyle modification, might reduce their risk of microvascular complications.
Supplementary Materials
Supplementary materials related to this article can be found online at https://doi.org/10.4093/dmj.2020.0240.
Supplementary Table 1.
Demographic and socioeconomic characteristics of patients with childhood-onset and adult-onset T1DM
dmj-2020-0240-suppl1.pdf
Supplementary Table 2.
Clinical characteristics of patients with childhood-onset and adult-onset type 1 diabetes mellitus
dmj-2020-0240-suppl2.pdf
Supplementary Table 3.
Logistic regression analysis of risk factors associated with metabolic syndrome between patients with childhood-onset and adult-onset type 1 diabetes mellitus
dmj-2020-0240-suppl3.pdf
NOTES
-
CONFLICTS OF INTEREST
No potential conflict of interest relevant to this article was reported.
-
AUTHOR CONTRIBUTIONS
Conception or design: Q.H., D.Y., S.L., J.W.
Acquisition, analysis, or interpretation of data: Q.H., D.Y., H.D., H.L., X.Z., J.Y., W.X., X.L., B.Y., S.L., J.W.
Drafting the work or revising: Q.H., D.Y., S.L., J.W.
Final approval of the manuscript: Q.H., D.Y., H.D., H.L., X.Z., J.Y., W.X., X.L., B.Y., S.L., J.W.
-
FUNDING
This study was supported by the National Key R&D Program of China (Grant Number: 2017YFC1309600), National Natural Science Foundation of China (Grant Number: 81530025), National Natural Science Foundation of China (Grant Number: 81941022), Guangdong Basic and Applied Basic Research Foundation (Grant Number: 2019A1515010979), and Natural Science Foundation of Anhui Province (Grant Number: 2008-085MH278).
Acknowledgements- We acknowledge all the healthcare providers, nurses, technicians, and patients in the 16 participating tertiary hospitals for their dedication to this study.
Fig. 1.Flow chart of patient selection process. T1DM, type 1 diabetes mellitus; MetS, metabolic syndrome; TSH, thyroid-stimulating hormone.
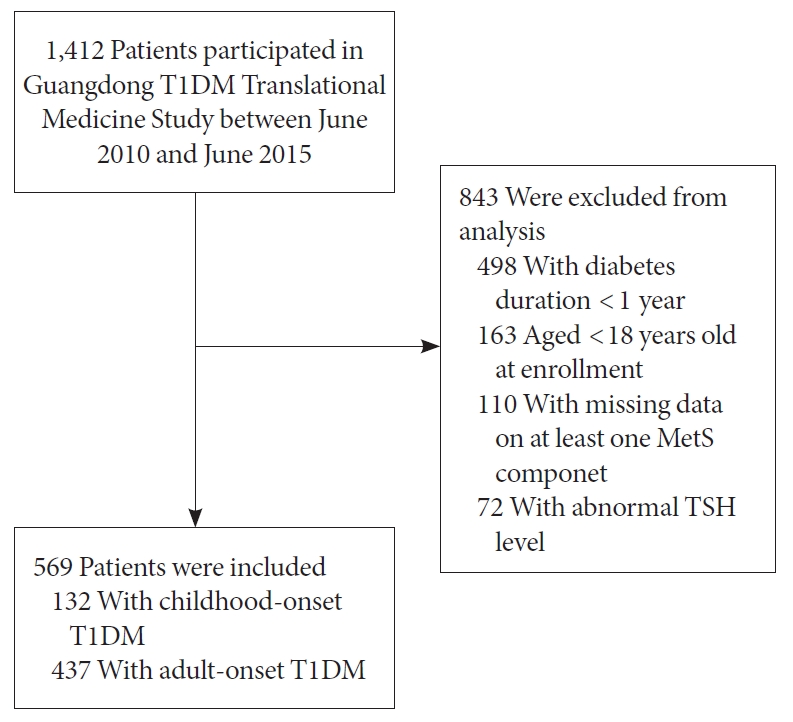
Fig. 2.Receiver operating characteristics (ROC) curves of diabetes duration, body mass index (BMI) and glycosylated hemoglobin A1c (HbA1c) correlating with the presence of metabolic syndrome in adult patients with type 1 diabetes mellitus. The area under curve for BMI, HbA1c, diabetes duration, and combination of the above variable are 0.66, 0.59, 0.57, and 0.68, respectively.


Table 1.Demographic and socioeconomic characteristics of adults with T1DM according to metabolic syndrome status
|
Parameter |
Alla (n=569) |
MetS present (n=86) |
MetS absent (n=483) |
P value |
|
Female sex |
315 (55.4) |
67 (77.9) |
248 (51.3) |
<0.001 |
|
Age at enrollment, yr |
34.8±12.4 |
35.7±15.1 |
34.6±11.9 |
0.440 |
|
Diabetes duration, yr |
5.9 (3.1–10.3) |
6.7 (3.9–11.9) |
5.8 (3.1–9.5) |
0.028 |
|
Age at diagnosis, yr |
25.6 (18.3–33.8) |
24.7 (16.0–34.2) |
25.8 (18.6–33.8) |
0.307 |
|
Childhood-onset cases |
132 (23.2) |
28 (32.6) |
104 (21.5) |
0.026 |
|
Family history of diabetes |
149 (26.5) |
29 (34.1) |
120 (25.1) |
0.083 |
|
Family history of T1DM |
25 (4.4) |
3 (3.5) |
22 (4.6) |
1.000 |
|
Education level: less than university |
177 (31.4) |
20 (23.5) |
157 (2.8) |
0.088 |
|
Having insurance |
490 (86.1) |
70 (81.4) |
420 (87.0) |
0.169 |
|
Marital status (married) |
344 (61.3) |
47 (56.0) |
297 (62.3) |
0.273 |
|
Living status (alone) |
45 (8.3) |
7 (9.0) |
38 (8.2) |
0.812 |
|
Diabetic education |
432 (77.6) |
58 (67.4) |
374 (77.4) |
0.109 |
|
Received nutrition therapy education |
239 (42.0) |
23 (26.7) |
216 (44.7) |
0.002 |
|
Adhering to diabetic diet |
398 (71.2) |
53 (63.9) |
345 (72.5) |
0.109 |
|
Exercise ≥150 min/week |
228 (49.0) |
33 (47.8) |
195 (49.2) |
0.828 |
|
Smoker |
92 (16.2) |
9 (10.6) |
83 (17.2) |
0.128 |
|
Alcohol drinker |
50 (8.8) |
2 (2.4) |
48 (9.9) |
0.023 |
|
Clinical visit times per year <12 |
289 (53.7) |
37 (46.8) |
252 (54.9) |
0.184 |
Table 2.Clinical characteristics of adults with type 1 diabetes mellitus according to metabolic syndrome status
|
Parameter |
Alla (n=569) |
MetS present (n=86) |
MetS absent (n=483) |
P value |
|
BMI, kg/m2
|
20.7±2.6 |
21.8±2.9 |
20.5±2.4 |
<0.001 |
|
Underweight |
110 (19.4) |
13 (15.1) |
97 (20.2) |
0.005 |
|
Normal weight |
424 (74.9) |
61 (70.9) |
363 (75.6) |
|
|
Overweight/Obesity |
32 (5.7) |
12 (14) |
20 (4.2) |
|
|
Waist circumference, cm |
74.5±7.6 |
79.2±8.1 |
73.7±7.2 |
<0.001 |
|
In female |
73.8±7.5 |
79.5±7.8 |
72.3±6.7 |
<0.001 |
|
In male |
75.4±7.7 |
78.3±9.2 |
75.0±7.5 |
0.081 |
|
WHR |
0.8±0.1 |
0.9±0.1 |
0.8±0.1 |
<0.001 |
|
SBP, mm Hg |
114.3±14.3 |
122.9±16.9 |
112.8±13.2 |
<0.001 |
|
DBP, mm Hg |
72.9±9.2 |
78.0±10.9 |
71.9±8.6 |
<0.001 |
|
HbA1c, % |
8.4 (7.1–10.1) |
9.2 (7.5–10.5) |
8.4 (7.1–10.1) |
0.057 |
|
HbA1c ≥9% |
223 (40.9) |
42 (50.6) |
181 (39.2) |
0.051 |
|
TC, mmol/L |
4.8±1.2 |
5.3±2.0 |
4.7±1.0 |
<0.001 |
|
Triglyceride, mmol/L |
0.9 (0.7–1.4) |
1.9 (1.1–2.4) |
0.9 (0.7–1.3) |
<0.001 |
|
HDL-C, mmol/L |
1.5±0.4 |
1.2±0.4 |
1.5±0.4 |
<0.001 |
|
LDL-C, mmol/L |
2.5 (2.0–3.2) |
2.7 (2.0–3.6) |
2.5 (2.0–3.1) |
0.030 |
|
lnGDR |
1.8±0.4 |
1.7±0.4 |
1.9±0.4 |
<0.001 |
|
UACR, mg/g |
11.5 (5.9–25.6) |
22.3 (7.2–83.7) |
10.7 (5.8–21.7) |
<0.001 |
|
UACR ≥30 mg/g |
117 (22.7) |
30 (40.5) |
87 (19.7) |
<0.001 |
|
eGFR, mL/min/1.73 m2
|
119.9 (94.3–149.0) |
119.0 (92.3–139.1) |
120.4 (94.4–150.2) |
0.335 |
|
eGFR <60 mL/min/1.73 m2
|
32 (6.0) |
6 (7.9) |
26 (5.7) |
0.437 |
|
Diabetic complications |
|
|
|
|
|
Hypoglycemic events, /mo |
1 (0–4) |
1 (0–4) |
1 (0–4) |
0.680 |
|
Diabetic kidney disease |
122 (21.5) |
31 (36.5) |
91 (18.9) |
<0.001 |
|
Diabetic retinopathy |
59 (10.4) |
17 (19.8) |
42 (8.7) |
0.002 |
|
Insulin regimen |
|
|
|
0.749 |
|
Insulin pump |
65 (11.5) |
8 (9.5) |
57 (11.9) |
|
|
Basal-bolus insulin therapy |
195 (34.6) |
28 (33.3) |
167 (34.8) |
|
|
Others |
304 (53.9) |
48 (57.2) |
256 (53.3) |
|
|
MetS components |
|
|
|
|
|
Abdominal obesity |
81 (14.2) |
44 (51.2) |
37 (7.6) |
<0.001 |
|
Hypertension |
111 (19.5) |
47 (54.7) |
64 (13.3) |
<0.001 |
|
Abnormal TG |
96 (16.9) |
49 (57.0) |
47 (9.7) |
<0.001 |
|
Abnormal HDL |
98 (17.2) |
53 (61.6) |
45 (9.3) |
<0.001 |
Table 3.Logistic regression analysis of risk factors associated with metabolic syndrome in patients with type 1 diabetes mellitus
|
Variable |
OR |
95% CI |
P value |
|
Female sex |
2.86 |
1.63–5.02 |
0.047 |
|
Diabetes duration, yr |
1.04 |
1.00–1.08 |
<0.001 |
|
BMI, kg/m2
|
1.14 |
1.03–1.25 |
0.009 |
|
HbA1c, % |
1.23 |
1.11–1.36 |
<0.001 |
|
Received nutrition therapy education |
0.46 |
0.26–0.78 |
0.005 |
Table 4.Logistic regression analysis of metabolic syndrome and microvascular complications in patients with type 1 diabetes mellitus
|
Variable |
OR |
95% CI |
P value |
|
Diabetic kidney disease |
|
|
|
|
Model 1 |
2.47 |
1.50–4.06 |
<0.001 |
|
Model 2 |
2.40 |
1.43–4.03 |
0.001 |
|
Model 3 |
2.27 |
1.34–3.85 |
0.002 |
|
Model 4 |
2.14 |
1.12–4.11 |
0.022 |
|
Diabetic retinopathy |
|
|
|
|
Model 1 |
2.59 |
1.40–4.80 |
0.003 |
|
Model 2 |
2.48 |
1.25–4.91 |
<0.001 |
|
Model 3 |
2.75 |
1.37–5.51 |
0.004 |
|
Model 4 |
3.72 |
1.59–8.72 |
0.002 |
REFERENCES
- 1. Alberti KG, Eckel RH, Grundy SM, Zimmet PZ, Cleeman JI, Donato KA, et al. Harmonizing the metabolic syndrome: a joint interim statement of the International Diabetes Federation Task Force on Epidemiology and Prevention; National Heart, Lung, and Blood Institute; American Heart Association; World Heart Federation; International Atherosclerosis Society; and International Association for the Study of Obesity. Circulation 2009;120:1640-5.ArticlePubMed
- 2. Povel CM, Beulens JW, van der Schouw YT, Dolle ME, Spijkerman AM, Verschuren WM, et al. Metabolic syndrome model definitions predicting type 2 diabetes and cardiovascular disease. Diabetes Care 2013;36:362-8.ArticlePubMedPMCPDF
- 3. Thorn LM, Forsblom C, Fagerudd J, Thomas MC, Pettersson-Fernholm K, Saraheimo M, et al. Metabolic syndrome in type 1 diabetes: association with diabetic nephropathy and glycemic control (the FinnDiane study). Diabetes Care 2005;28:2019-24.PubMed
- 4. Metascreen Writing Committee, Bonadonna R, Cucinotta D, Fedele D, Riccardi G, Tiengo A. The metabolic syndrome is a risk indicator of microvascular and macrovascular complications in diabetes: results from Metascreen, a multicenter diabetes clinic-based survey. Diabetes Care 2006;29:2701-7.PubMed
- 5. Pambianco G, Costacou T, Orchard TJ. The prediction of major outcomes of type 1 diabetes: a 12-year prospective evaluation of three separate definitions of the metabolic syndrome and their components and estimated glucose disposal rate: the Pittsburgh Epidemiology of Diabetes Complications Study experience. Diabetes Care 2007;30:1248-54.PubMed
- 6. Saklayen MG. The global epidemic of the metabolic syndrome. Curr Hypertens Rep 2018;20:12.ArticlePubMedPMCPDF
- 7. Li R, Li W, Lun Z, Zhang H, Sun Z, Kanu JS, et al. Prevalence of metabolic syndrome in Mainland China: a meta-analysis of published studies. BMC Public Health 2016;16:296.ArticlePubMedPMC
- 8. Kurella M, Lo JC, Chertow GM. Metabolic syndrome and the risk for chronic kidney disease among nondiabetic adults. J Am Soc Nephrol 2005;16:2134-40.ArticlePubMed
- 9. Peng XY, Wang FH, Liang YB, Wang JJ, Sun LP, Peng Y, et al. Retinopathy in persons without diabetes: the Handan Eye Study. Ophthalmology 2010;117:531-7.ArticlePubMed
- 10. Zhang X, Lerman LO. The metabolic syndrome and chronic kidney disease. Transl Res 2017;183:14-25.ArticlePubMed
- 11. Mbata O, Abo El-Magd NF, El-Remessy AB. Obesity, metabolic syndrome and diabetic retinopathy: beyond hyperglycemia. World J Diabetes 2017;8:317-29.ArticlePubMedPMC
- 12. Merger SR, Kerner W, Stadler M, Zeyfang A, Jehle P, Muller-Korbsch M, et al. Prevalence and comorbidities of double diabetes. Diabetes Res Clin Pract 2016;119:48-56.ArticlePubMed
- 13. Kilpatrick ES, Rigby AS, Atkin SL. Insulin resistance, the metabolic syndrome, and complication risk in type 1 diabetes: “double diabetes” in the Diabetes Control and Complications Trial. Diabetes Care 2007;30:707-12.PubMed
- 14. Rodrigues TC, Canani LH, Schvartzman P, Gross JL. Hypertension is the metabolic syndrome component most strongly associated with microvascular complications and coronary artery calcification in type 1 diabetes. J Endocrinol Invest 2011;34:e58-63.ArticlePubMedPDF
- 15. Davis TM, Bruce DG, Davis WA. Prevalence and prognostic implications of the metabolic syndrome in community-based patients with type 1 diabetes: the Fremantle Diabetes Study. Diabetes Res Clin Pract 2007;78:412-7.ArticlePubMed
- 16. McCarthy MM, Funk M, Grey M. Cardiovascular health in adults with type 1 diabetes. Prev Med 2016;91:138-43.ArticlePubMedPMC
- 17. Yang D, Deng H, Luo G, Wu G, Lin S, Yuan L, et al. Demographic and clinical characteristics of patients with type 1 diabetes mellitus: a multicenter registry study in Guangdong, China. J Diabetes 2016;8:847-53.ArticlePubMedPDF
- 18. Fabiani R, Naldini G, Chiavarini M. Dietary patterns and metabolic syndrome in adult subjects: a systematic review and meta-analysis. Nutrients 2019;11:2056.ArticlePubMedPMC
- 19. Kastorini CM, Milionis HJ, Esposito K, Giugliano D, Goudevenos JA, Panagiotakos DB. The effect of Mediterranean diet on metabolic syndrome and its components: a meta-analysis of 50 studies and 534,906 individuals. J Am Coll Cardiol 2011;57:1299-313.PubMed
- 20. Lusis AJ, Attie AD, Reue K. Metabolic syndrome: from epidemiology to systems biology. Nat Rev Genet 2008;9:819-30.ArticlePubMedPMCPDF
- 21. Billow A, Anjana RM, Ngai M, Amutha A, Pradeepa R, Jebarani S, et al. Prevalence and clinical profile of metabolic syndrome among type 1 diabetes mellitus patients in southern India. J Diabetes Complications 2015;29:659-64.ArticlePubMed
- 22. Lee YB, Han K, Kim B, Jin SM, Lee SE, Jun JE, et al. High proportion of adult cases and prevalence of metabolic syndrome in type 1 diabetes mellitus population in Korea: a nationwide study. Diabetes Metab J 2019;43:76-89.ArticlePubMedPDF
- 23. Huo L, Ji L, Deng W, Shaw JE, Zhang P, Zhao F, et al. Age distribution and metabolic disorders in people with type 1 diabetes in Beijing and Shantou, China: a cross-sectional study. Diabet Med 2018;35:721-8.ArticlePubMedPDF
- 24. Szadkowska A, Pietrzak I, Szlawska J, Kozera A, Gadzicka A, Mlynarski W. Abdominal obesity, metabolic syndrome in type 1 diabetic children and adolescents. Pediatr Endocrinol Diabetes Metab 2009;15:233-9.PubMed
- 25. Valerio G, Iafusco D, Zucchini S, Maffeis C; Study-Group on Diabetes of Italian Society of Pediatric Endocrinology and Diabetology (ISPED). Abdominal adiposity and cardiovascular risk factors in adolescents with type 1 diabetes. Diabetes Res Clin Pract 2012;97:99-104.ArticlePubMed
- 26. Kim G, Divers J, Fino NF, Dabelea D, Lawrence JM, Reynolds K, et al. Trends in prevalence of cardiovascular risk factors from 2002 to 2012 among youth early in the course of type 1 and type 2 diabetes. The SEARCH for Diabetes in Youth Study. Pediatr Diabetes 2019;20:693-701.PubMedPMC
- 27. Liu L, Yang D, Zhang Y, Lin S, Zheng X, Lin S, et al. Glycaemic control and its associated factors in Chinese adults with type 1 diabetes mellitus. Diabetes Metab Res Rev 2015;31:803-10.ArticlePubMed
- 28. Weng J, Zhou Z, Guo L, Zhu D, Ji L, Luo X, et al. Incidence of type 1 diabetes in China, 2010-13: population based study. BMJ 2018;360:j5295.ArticlePubMedPMC
- 29. Liu YY, Brent GA. Thyroid hormone crosstalk with nuclear receptor signaling in metabolic regulation. Trends Endocrinol Metab 2010;21:166-73.ArticlePubMed
- 30. American Diabetes Association, Bantle JP, Wylie-Rosett J, Albright AL, Apovian CM, Clark NG, et al. Nutrition recommendations and interventions for diabetes: a position statement of the American Diabetes Association. Diabetes Care 2008;31 Suppl 1:S61-78.PubMed
- 31. Zheng X, Huang B, Luo S, Yang D, Bao W, Li J, et al. A new model to estimate insulin resistance via clinical parameters in adults with type 1 diabetes. Diabetes Metab Res Rev 2017;33:e2880.ArticlePDF
- 32. Ma YC, Zuo L, Chen JH, Luo Q, Yu XQ, Li Y, et al. Modified glomerular filtration rate estimating equation for Chinese patients with chronic kidney disease. J Am Soc Nephrol 2006;17:2937-44.ArticlePubMed
- 33. American Diabetes Association. 11. Microvascular complications and foot care: standards of medical care in diabetes-2020. Diabetes Care 2020;43(Suppl 1):S135-51.
- 34. The Diabetes Control And Complications Trial Research Group. Influence of intensive diabetes treatment on body weight and composition of adults with type 1 diabetes in the Diabetes Control and Complications Trial. Diabetes Care 2001;24:1711-21.ArticlePubMedPDF
- 35. Ferriss JB, Webb D, Chaturvedi N, Fuller JH, Idzior-Walus B; EURODIAB Prospective Complications Group. Weight gain is associated with improved glycaemic control but with adverse changes in plasma lipids and blood pressure isn type 1 diabetes. Diabet Med 2006;23:557-64.ArticlePubMed
- 36. Davison KA, Negrato CA, Cobas R, Matheus A, Tannus L, Palma CS, et al. Relationship between adherence to diet, glycemic control and cardiovascular risk factors in patients with type 1 diabetes: a nationwide survey in Brazil. Nutr J 2014;13:19.PubMedPMC
- 37. Kloting N, Bluher M. Adipocyte dysfunction, inflammation and metabolic syndrome. Rev Endocr Metab Disord 2014;15:277-87.ArticlePubMedPDF
- 38. Tziomalos K, Athyros VG, Karagiannis A, Mikhailidis DP. Endothelial dysfunction in metabolic syndrome: prevalence, pathogenesis and management. Nutr Metab Cardiovasc Dis 2010;20:140-6.ArticlePubMed
- 39. Esposito K, Marfella R, Ciotola M, Di Palo C, Giugliano F, Giugliano G, et al. Effect of a mediterranean-style diet on endothelial dysfunction and markers of vascular inflammation in the metabolic syndrome: a randomized trial. JAMA 2004;292:1440-6.ArticlePubMed
- 40. de Boer IH; DCCT/EDIC Research Group. Kidney disease and related findings in the diabetes control and complications trial/epidemiology of diabetes interventions and complications study. Diabetes Care 2014;37:24-30.ArticlePubMedPDF
- 41. Aiello LP; DCCT/EDIC Research Group. Diabetic retinopathy and other ocular findings in the diabetes control and complications trial/epidemiology of diabetes interventions and complications study. Diabetes Care 2014;37:17-23.ArticlePubMedPDF
- 42. O’Hare P, Bilbous R, Mitchell T, O’ Callaghan CJ, Viberti GC; Ace-Inhibitor Trial to Lower Albuminuria in Normotensive Insulin-Dependent Subjects Study Group. Low-dose ramipril reduces microalbuminuria in type 1 diabetic patients without hypertension: results of a randomized controlled trial. Diabetes Care 2000;23:1823-9.ArticlePubMedPDF
- 43. Chaturvedi N, Porta M, Klein R, Orchard T, Fuller J, Parving HH, et al. Effect of candesartan on prevention (DIRECT-Prevent 1) and progression (DIRECT-Protect 1) of retinopathy in type 1 diabetes: randomised, placebo-controlled trials. Lancet 2008;372:1394-402.ArticlePubMed
Citations
Citations to this article as recorded by

- Prevalence of Metabolic Syndrome and Its Risk Factors Influence on Microvascular Complications in Patients With Type 1 and Type 2 Diabetes Mellitus
Asad Riaz, Shoaib Asghar, Salman Shahid, Haider Tanvir, Muhammad Hamza Ejaz, Mamuna Akram
Cureus.2024;[Epub] CrossRef - Simplified integration of optimal self-management behaviors is associated with improved HbA1c in patients with type 1 diabetes
C. Deng, Y. Xie, F. Liu, X. Tang, L. Fan, X. Yang, Y. Chen, Z. Zhou, X. Li
Journal of Endocrinological Investigation.2024;[Epub] CrossRef - Dynamic Changes in Metabolic Status Are Associated With Risk of Ocular Motor Cranial Nerve Palsies
Daye Diana Choi, Kyung-Ah Park, Kyungdo Han, Sei Yeul Oh
Journal of Neuro-Ophthalmology.2023;[Epub] CrossRef - Development and validation of an age-sex-ethnicity-specific metabolic syndrome score in the Chinese adults
Shujuan Yang, Bin Yu, Wanqi Yu, Shaoqing Dai, Chuanteng Feng, Ying Shao, Xing Zhao, Xiaoqing Li, Tianjing He, Peng Jia
Nature Communications.2023;[Epub] CrossRef - Association of Endotoxemia with Low-Grade Inflammation, Metabolic Syndrome and Distinct Response to Lipopolysaccharide in Type 1 Diabetes
Aleksejs Fedulovs, Leonora Pahirko, Kaspars Jekabsons, Liga Kunrade, Jānis Valeinis, Una Riekstina, Valdis Pīrāgs, Jelizaveta Sokolovska
Biomedicines.2023; 11(12): 3269. CrossRef - Association between Metabolic Syndrome and Microvascular Complications in Chinese Adults with Type 1 Diabetes Mellitus (Diabetes Metab J 2022;46:93-103)
Qianwen Huang, Sihui Luo
Diabetes & Metabolism Journal.2022; 46(3): 515. CrossRef - Association between Metabolic Syndrome and Microvascular Complications in Chinese Adults with Type 1 Diabetes Mellitus (Diabetes Metab J 2022;46:93-103)
Gyuri Kim
Diabetes & Metabolism Journal.2022; 46(3): 512. CrossRef - Metabolic syndrome associated with higher glycemic variability in type 1 diabetes: A multicenter cross-sectional study in china
Keyu Guo, Liyin Zhang, Jianan Ye, Xiaohong Niu, Hongwei Jiang, Shenglian Gan, Jian Zhou, Lin Yang, Zhiguang Zhou
Frontiers in Endocrinology.2022;[Epub] CrossRef

 , Daizhi Yang1*
 PubReader
 ePub Link
 Cite
Cite