- Current
- Browse
- Collections
-
For contributors
- For Authors
- Instructions to authors
- Article processing charge
- e-submission
- For Reviewers
- Instructions for reviewers
- How to become a reviewer
- Best reviewers
- For Readers
- Readership
- Subscription
- Permission guidelines
- About
- Editorial policy
Articles
- Page Path
- HOME > Diabetes Metab J > Volume 37(4); 2013 > Article
-
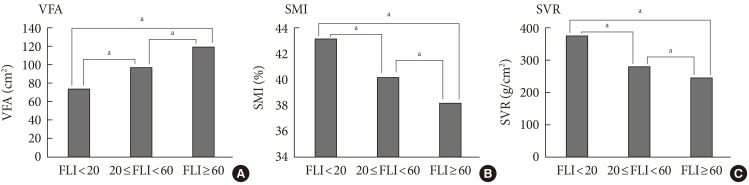
Original ArticleObesity and Metabolic Syndrome The Role of Skeletal Muscle in Development of Nonalcoholic Fatty Liver Disease
- Jun Sung Moon, Ji Sung Yoon, Kyu Chang Won, Hyoung Woo Lee
-
Diabetes & Metabolism Journal 2013;37(4):278-285.
DOI: https://doi.org/10.4093/dmj.2013.37.4.278
Published online: August 14, 2013
Department of Internal Medicine, Yeungnam University College of Medicine, Daegu, Korea.
- Corresponding author: Hyoung Woo Lee. Department of Internal Medicine, Yeungnam University College of Medicine1, 70 Hyeonchung-ro, Nam-gu, Daegu 705-717, Korea. helee@ynu.ac.kr
- *Jun Sung Moon and Ji Sung Yoon contributed equally to this study as first authors.
• Received: June 30, 2013 • Accepted: July 22, 2013
Copyright © 2013 Korean Diabetes Association
This is an Open Access article distributed under the terms of the Creative Commons Attribution Non-Commercial License (http://creativecommons.org/licenses/by-nc/3.0/) which permits unrestricted non-commercial use, distribution, and reproduction in any medium, provided the original work is properly cited.


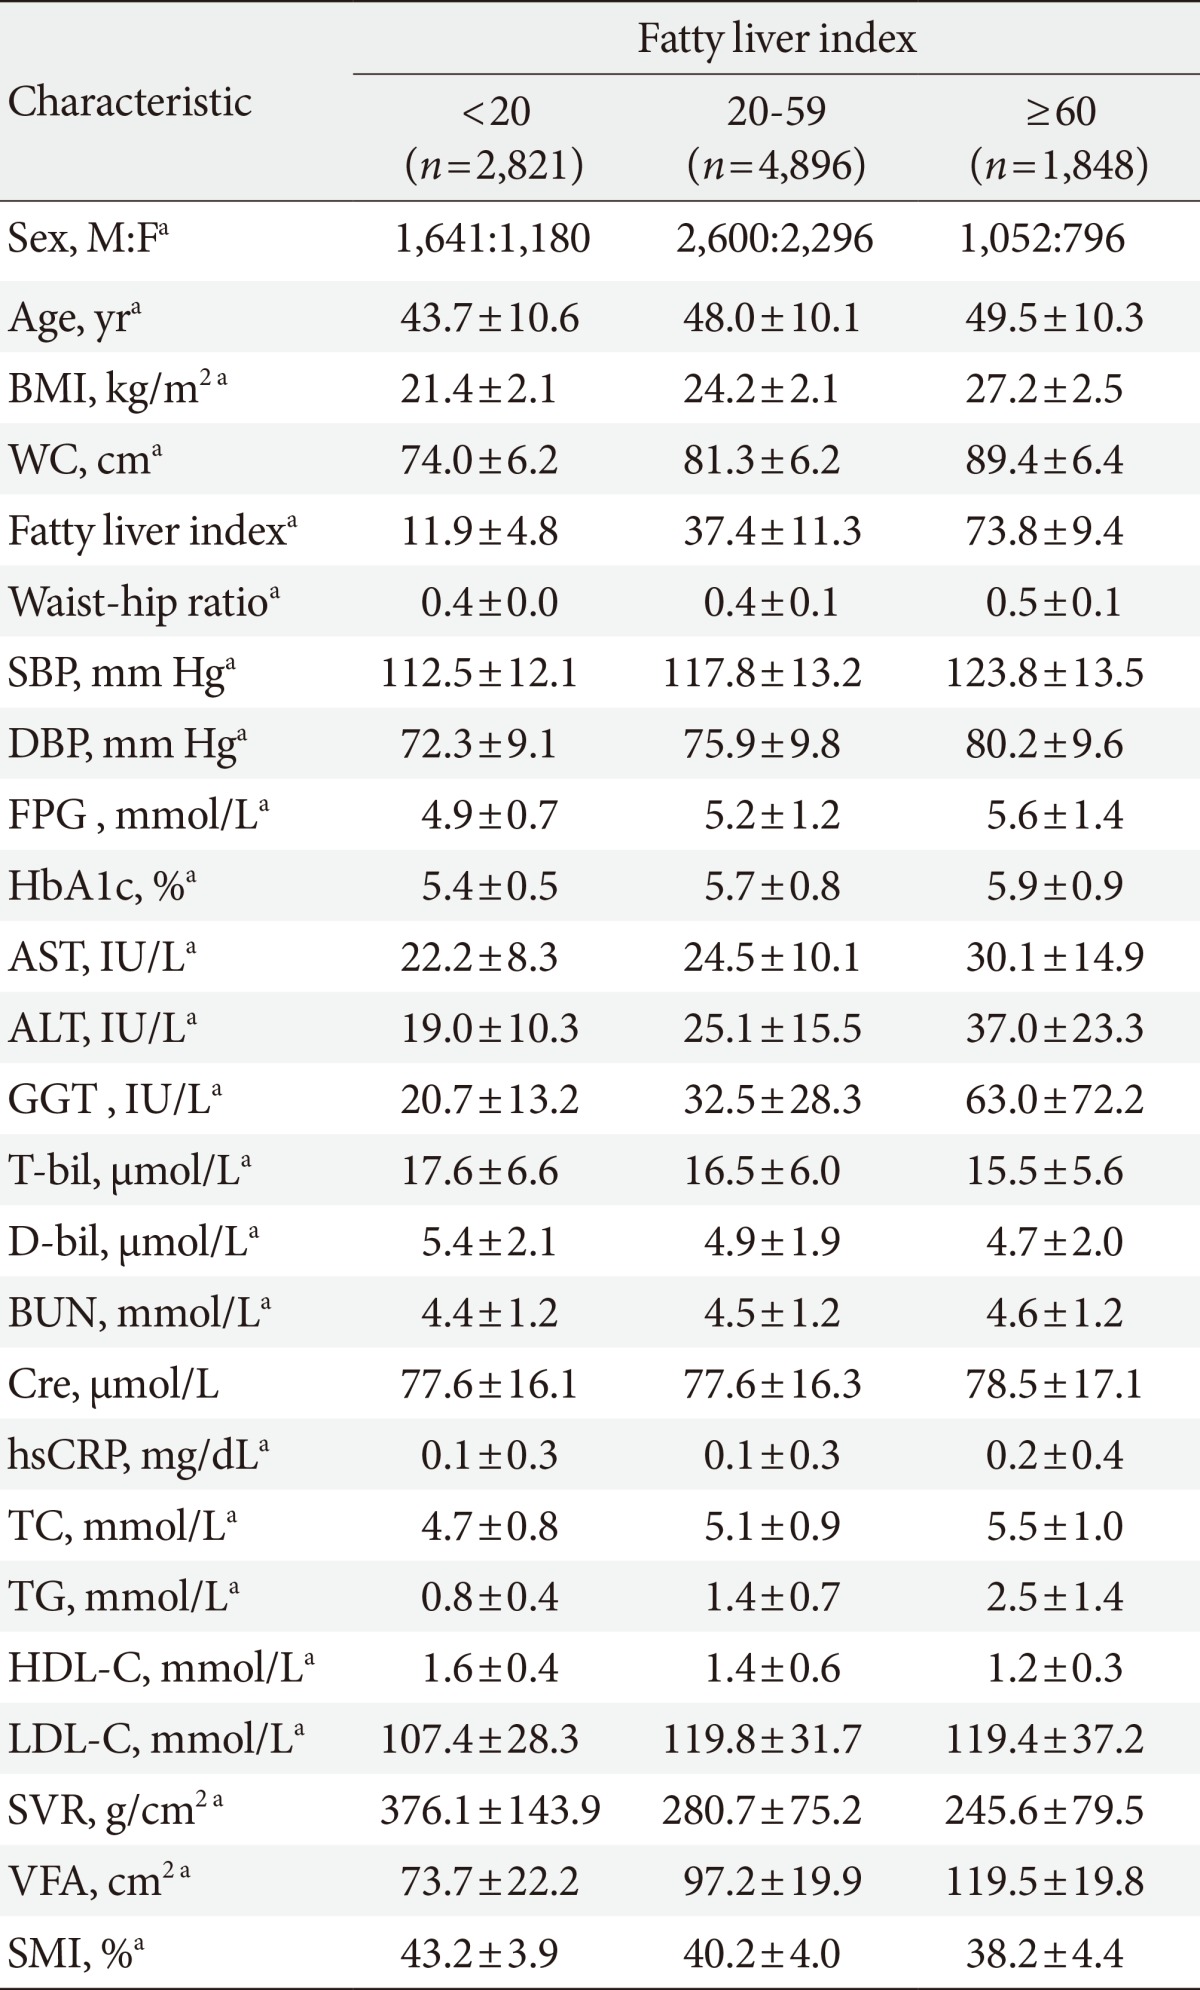
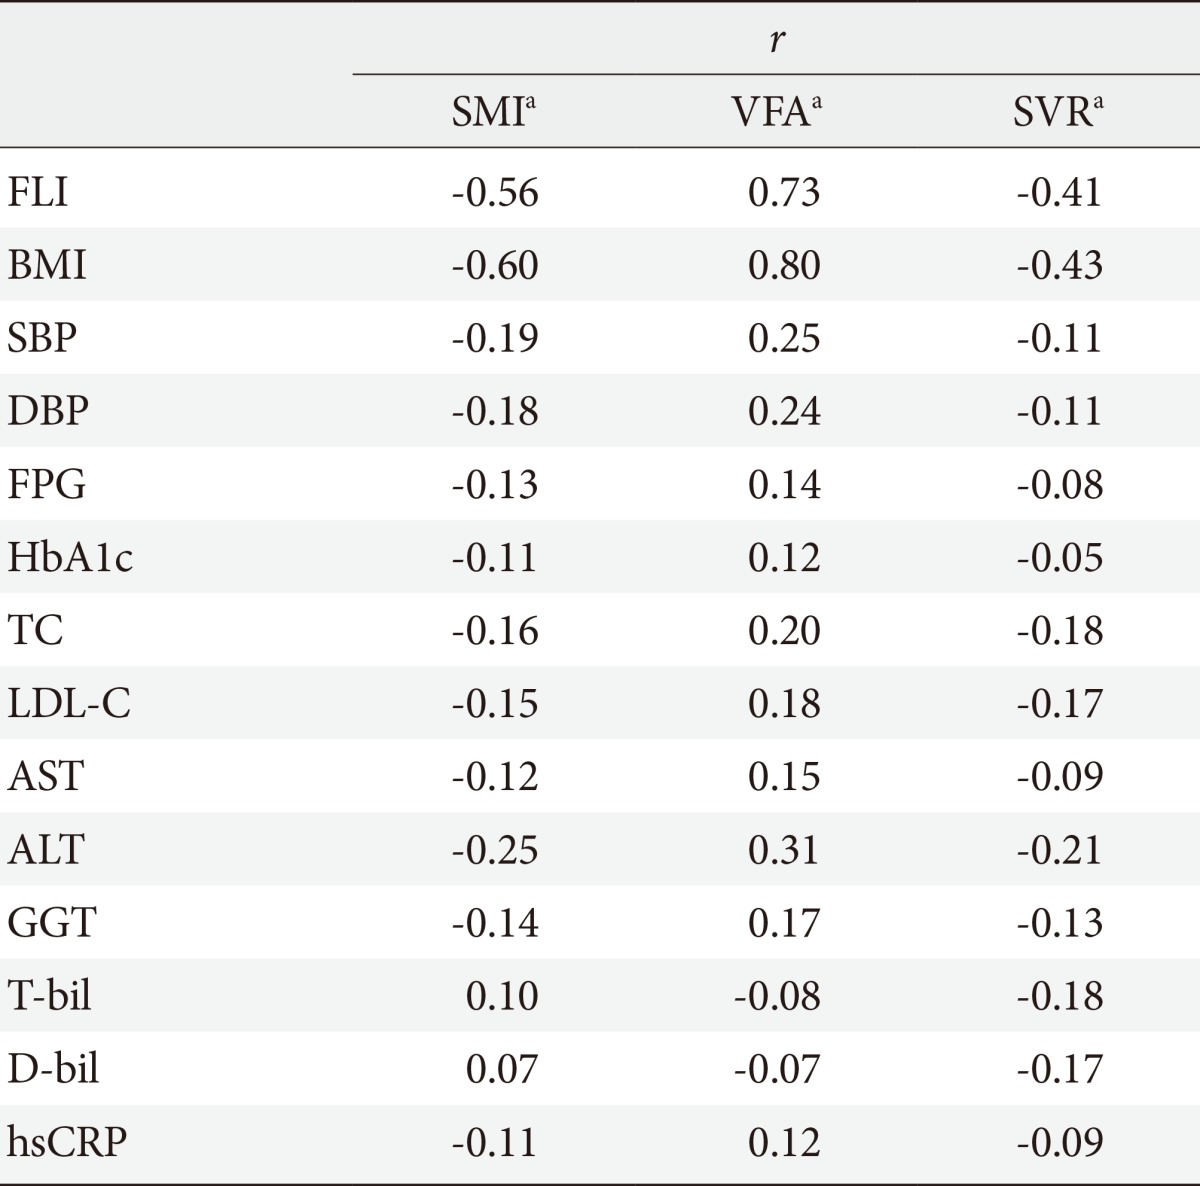
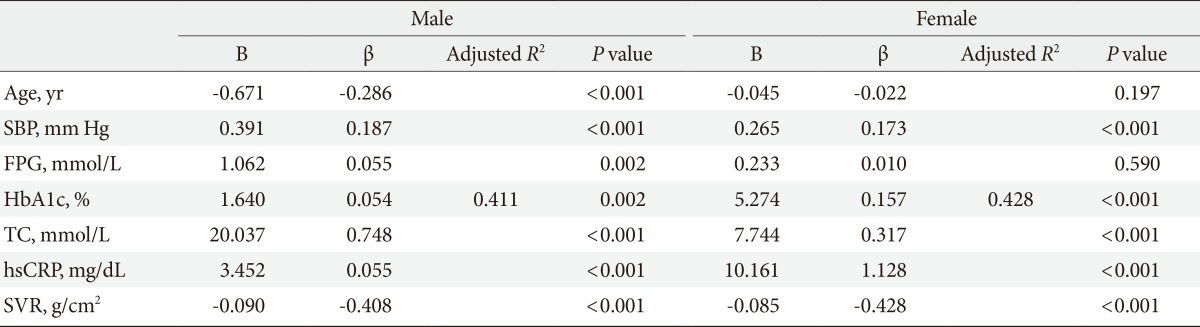
Figure & Data
References
Citations
Citations to this article as recorded by 
- Effects of nonalcoholic fatty liver disease on sarcopenia: evidence from genetic methods
Jiaqin Yuan, Jinglin Zhang, Qiang Luo, Lipeng Peng
Scientific Reports.2024;[Epub] CrossRef - Influence of Sugar-Sweetened Beverages Intake on Sarcopenic Obesity, Visceral Obesity, and Sarcopenia in Lebanese Patients with MASLD: A Case-Control Study
Maha Hoteit, Myriam Dagher, Nikolaos Tzenios, Najat Al Kaaki, Ghadir Rkein, Abdul Rahman Chahine, Yonna Sacre, Samer Hotayt, Rami Matar, Mahmoud Hallal, Micheal Maitar, Bilal Hotayt
Healthcare.2024; 12(5): 591. CrossRef - Increased visceral fat area to skeletal muscle mass ratio is positively associated with the risk of metabolic dysfunction-associated steatotic liver disease in a Chinese population
Chenbing Liu, Nan Li, Di Sheng, Yahong Shao, Lihong Qiu, Chao Shen, Zhong Liu
Lipids in Health and Disease.2024;[Epub] CrossRef - Using hyperhomocysteinemia and body composition to predict the risk of non-alcoholic fatty liver disease in healthcare workers
Xiaoyan Hao, Honghai He, Liyuan Tao, Peng Wang
Frontiers in Endocrinology.2023;[Epub] CrossRef - Diagnostic Criteria and Prognostic Relevance of Sarcopenia in Patients with Inflammatory Bowel Disease—A Systematic Review
Claudia-Gabriela Potcovaru, Petruța Violeta Filip, Oana-Maria Neagu, Laura Sorina Diaconu, Teodor Salmen, Delia Cinteză, Anca Pantea Stoian, Florin Bobirca, Mihai Berteanu, Corina Pop
Journal of Clinical Medicine.2023; 12(14): 4713. CrossRef - Association between Muscle Mass Deficits and Metabolic Dysfunction-Associated Fatty Liver Disease in Adults with Body Mass Index Less than 23 kg/m2
Mi Young Lee, Hee Jeong Choi, Han Jin Oh
Korean Journal of Family Practice.2023; 13(3): 171. CrossRef - Sex influences the association between appendicular skeletal muscle mass to visceral fat area ratio and non-alcoholic steatohepatitis in patients with biopsy-proven non-alcoholic fatty liver disease
Gang Li, Rafael S. Rios, Xin-Xin Wang, Yue Yu, Kenneth I. Zheng, Ou-Yang Huang, Liang-Jie Tang, Hong-Lei Ma, Yi Jin, Giovanni Targher, Christopher D. Byrne, Xiao-Yan Pan, Ming-Hua Zheng
British Journal of Nutrition.2022; 127(11): 1613. CrossRef - 2019 Global NAFLD Prevalence: A Systematic Review and Meta-analysis
Michael H. Le, Yee Hui Yeo, Xiaohe Li, Jie Li, Biyao Zou, Yuankai Wu, Qing Ye, Daniel Q. Huang, Changqing Zhao, Jie Zhang, Chenxi Liu, Na Chang, Feng Xing, Shiping Yan, Zi Hui Wan, Natasha Sook Yee Tang, Maeda Mayumi, Xinting Liu, Chuanli Liu, Fajuan Rui,
Clinical Gastroenterology and Hepatology.2022; 20(12): 2809. CrossRef - Impact of Sarcopenia and Myosteatosis in Non-Cirrhotic Stages of Liver Diseases: Similarities and Differences across Aetiologies and Possible Therapeutic Strategies
Annalisa Cespiati, Marica Meroni, Rosa Lombardi, Giovanna Oberti, Paola Dongiovanni, Anna Ludovica Fracanzani
Biomedicines.2022; 10(1): 182. CrossRef - Impact of Sarcopenia on the Severity of the Liver Damage in Patients With Non-alcoholic Fatty Liver Disease
Vittoria Zambon Azevedo, Cristina Alina Silaghi, Thomas Maurel, Horatiu Silaghi, Vlad Ratziu, Raluca Pais
Frontiers in Nutrition.2022;[Epub] CrossRef - Fatty Liver Index and Skeletal Muscle Density
Julie A. Pasco, Sophia X. Sui, Emma C. West, Kara B. Anderson, Pamela Rufus-Membere, Monica C. Tembo, Natalie K. Hyde, Lana J. Williams, Zoe S. J. Liu, Mark A. Kotowicz
Calcified Tissue International.2022; 110(6): 649. CrossRef - Skeletal muscle mass to visceral fat area ratio as a predictor of NAFLD in lean and overweight men and women with effect modification by sex
Yoosun Cho, Yoosoo Chang, Seungho Ryu, Hyun‐Suk Jung, Chan‐won Kim, Hyungseok Oh, Mi Kyung Kim, Won Sohn, Hocheol Shin, Sarah H. Wild, Christopher D. Byrne
Hepatology Communications.2022; 6(9): 2238. CrossRef - Association of Low Skeletal Muscle Mass with the Phenotype of Lean Non-Alcoholic Fatty Liver Disease
Jun-Hyeon Byeon, Min-Kyu Kang, Min-Cheol Kim
Healthcare.2022; 10(5): 850. CrossRef - Muscle strength, but not body mass index, is associated with mortality in patients with non‐alcoholic fatty liver disease
Phunchai Charatcharoenwitthaya, Khemajira Karaketklang, Wichai Aekplakorn
Journal of Cachexia, Sarcopenia and Muscle.2022; 13(5): 2393. CrossRef - Effect of progressive resistance training with weight loss compared with weight loss alone on the fatty liver index in older adults with type 2 diabetes: secondary analysis of a 12-month randomized controlled trial
Christine L Freer, Elena S George, Sze-Yen Tan, Gavin Abbott, David W Dunstan, Robin M Daly
BMJ Open Diabetes Research & Care.2022; 10(5): e002950. CrossRef - Muscle Krüppel-like factor 15 regulates lipid flux and systemic metabolic homeostasis
Liyan Fan, David R. Sweet, Domenick A. Prosdocimo, Vinesh Vinayachandran, Ernest R. Chan, Rongli Zhang, Olga Ilkayeva, Yuan Lu, Komal S. Keerthy, Chloe E. Booth, Christopher B. Newgard, Mukesh K. Jain
Journal of Clinical Investigation.2021;[Epub] CrossRef - “Bioelectrical impedance analysis in managing sarcopenic obesity in NAFLD”
David J. Hanna, Scott T. Jamieson, Christine S. Lee, Christopher A. Pluskota, Nicole J. Bressler, Peter N. Benotti, Sandeep Khurana, David D. K. Rolston, Christopher D. Still
Obesity Science & Practice.2021; 7(5): 629. CrossRef - Decreased Muscle-to-Fat Mass Ratio Is Associated with Low Muscular Fitness and High Alanine Aminotransferase in Children and Adolescent Boys in Organized Sports Clubs
Kai Ushio, Yukio Mikami, Hiromune Obayashi, Hironori Fujishita, Kouki Fukuhara, Tetsuhiko Sakamitsu, Kazuhiko Hirata, Yasunari Ikuta, Hiroaki Kimura, Nobuo Adachi
Journal of Clinical Medicine.2021; 10(11): 2272. CrossRef - Association of Skeletal Muscle and Adipose Tissue Distribution with Histologic Severity of Non-Alcoholic Fatty Liver
Min-Kyu Kang, Jung-Hun Baek, Young-Oh Kweon, Won-Young Tak, Se-Young Jang, Yu-Rim Lee, Keun Hur, Gyeonghwa Kim, Hye-Won Lee, Man-Hoon Han, Joon-Hyuk Choi, Soo-Young Park, Jung-Gil Park
Diagnostics.2021; 11(6): 1061. CrossRef - Association of Body Composition and Sarcopenia with NASH in Obese Patients
Sophia Marie-Therese Schmitz, Lena Schooren, Andreas Kroh, Alexander Koch, Christine Stier, Ulf Peter Neumann, Tom Florian Ulmer, Patrick Hamid Alizai
Journal of Clinical Medicine.2021; 10(15): 3445. CrossRef - Patchouli alcohol ameliorates skeletal muscle insulin resistance and NAFLD via AMPK/SIRT1-mediated suppression of inflammation
Do Hyeon Pyun, Tae Jin Kim, Seung Yeon Park, Hyun Jung Lee, A.M. Abd El-Aty, Ji Hoon Jeong, Tae Woo Jung
Molecular and Cellular Endocrinology.2021; 538: 111464. CrossRef - Hepatic Steatosis Contributes to the Development of Muscle Atrophy via Inter-Organ Crosstalk
Kenneth Pasmans, Michiel E. Adriaens, Peter Olinga, Ramon Langen, Sander S. Rensen, Frank G. Schaap, Steven W. M. Olde Damink, Florian Caiment, Luc J. C. van Loon, Ellen E. Blaak, Ruth C. R. Meex
Frontiers in Endocrinology.2021;[Epub] CrossRef - Muscle mass and cellular membrane integrity assessment in patients with nonalcoholic fatty liver disease
Iasmin dos Santos Barreto, Raquel Oliveira dos Santos, Raquel Rocha, Claudineia de Souza, Naiade Almeida, Luiza Valois Vieira, Rafael Leiróz, Manoel Sarno, Carla Daltro, Helma Pinchemel Cotrim
Revista da Associação Médica Brasileira.2021; 67(9): 1233. CrossRef - A significant association of non-obese non-alcoholic fatty liver disease with sarcopenic obesity
Kazuhiro Kashiwagi, Michiyo Takayama, Kayoko Fukuhara, Ryoko Shimizu-Hirota, Po-Sung Chu, Nobuhiro Nakamoto, Nagamu Inoue, Yasushi Iwao, Takanori Kanai
Clinical Nutrition ESPEN.2020; 38: 86. CrossRef - Improvement in Menopause-Associated Hepatic Lipid Metabolic Disorders by Herbal Formula HPC03 on Ovariectomized Rats
BoYoon Chang, Dae Sung Kim, SungYeon Kim
Evidence-Based Complementary and Alternative Medicine.2020; 2020: 1. CrossRef - Sarcopenia is associated with non-alcoholic fatty liver disease in men with type 2 diabetes
D.H. Seo, Y.-h. Lee, S.W. Park, Y.J. Choi, B.W. Huh, E. Lee, K.B. Huh, S.H. Kim, B.-S. Cha
Diabetes & Metabolism.2020; 46(5): 362. CrossRef - Nonalcoholic fatty liver disease and sarcopenia: pathophysiological connections and therapeutic implications
Tiziana Fernández-Mincone, Felipe Contreras-Briceño, Maximiliano Espinosa-Ramírez, Patricio García-Valdés, Antonio López-Fuenzalida, Arnoldo Riquelme, Juan Pablo Arab, Daniel Cabrera, Marco Arrese, Francisco Barrera
Expert Review of Gastroenterology & Hepatology.2020; 14(12): 1141. CrossRef - Association between Atrial Fibrillation and Advanced Liver Fibrosis in Patients with Non-Alcoholic Fatty Liver Disease
Min Kyu Kang, Jung Gil Park, Min Cheol Kim
Yonsei Medical Journal.2020; 61(10): 860. CrossRef - Relative fat mass at baseline and its early change may be a predictor of incident nonalcoholic fatty liver disease
Hwi Young Kim, Su Jung Baik, Hye Ah Lee, Byoung Kwon Lee, Hye Sun Lee, Tae Hun Kim, Kwon Yoo
Scientific Reports.2020;[Epub] CrossRef - Fisetin Alleviates Hepatic and Adipocyte Fibrosis and Insulin Resistance in Diet-Induced Obese Mice
Myung-Sook Choi, Ji-Young Choi, Eun-Young Kwon
Journal of Medicinal Food.2020; 23(10): 1019. CrossRef - Relationship between relative skeletal muscle mass and nonalcoholic fatty liver disease: a systematic review and meta-analysis
Changzhou Cai, Xin Song, Yishu Chen, Xueyang Chen, Chaohui Yu
Hepatology International.2020; 14(1): 115. CrossRef - Sarcopenia Is a New Risk Factor of Nonalcoholic Fatty Liver Disease in Patients with Inflammatory Bowel Disease
Min Kyu Kang, Kyeong Ok Kim, Min Cheol Kim, Jung Gil Park, Byung Ik Jang
Digestive Diseases.2020; 38(6): 507. CrossRef - Relationship between Muscle Mass/Strength and Hepatic Fat Content in Post-Menopausal Women
Yajie Zhang, Dajiang Lu, Renwei Wang, Weijie Fu, Shengnian Zhang
Medicina.2019; 55(10): 629. CrossRef - Lower hand grip strength in older adults with non-alcoholic fatty liver disease: a nationwide population-based study
Beom-Jun Kim, Seong Hee Ahn, Seung Hun Lee, Seongbin Hong, Mark W. Hamrick, Carlos M. Isales, Jung-Min Koh
Aging.2019; 11(13): 4547. CrossRef - Nonalcoholic Fatty Liver Disease in Nonobese Subjects of African Origin Has Atypical Metabolic Characteristics
Debbie S Thompson, Ingrid A Tennant, Deanne P Soares, Clive Osmond, Chris D Byrne, Terrence E Forrester, Michael S Boyne
Journal of the Endocrine Society.2019; 3(11): 2051. CrossRef - Sarcopenia in patients with non‐alcoholic fatty liver disease: is it a clinically significant entity?
C. H. De Fré, M. A. De Fré, W. J. Kwanten, B. J. Op de Beeck, L. F. Van Gaal, S. M. Francque
Obesity Reviews.2019; 20(2): 353. CrossRef - Nonalcoholic Fatty Liver Disease in The Rotterdam Study: About Muscle Mass, Sarcopenia, Fat Mass, and Fat Distribution
Louise Johanna Maria Alferink, Katerina Trajanoska, Nicole Stephanie Erler, Josje Dorothea Schoufour, Robert Jacobus de Knegt, M. Arfan Ikram, Harry Leonardus Antonius Janssen, Oscar H. Franco, Herold J. Metselaar, Fernando Rivadeneira, Sarwa Darwish Mura
Journal of Bone and Mineral Research.2019; 34(7): 1254. CrossRef - Sarcopenia Is Significantly Associated with Presence and Severity of Nonalcoholic Fatty Liver Disease
Goh Eun Chung, Min Joo Kim, Jeong Yoon Yim, Joo Sung Kim, Ji Won Yoon
Journal of Obesity & Metabolic Syndrome.2019; 28(2): 129. CrossRef - Association of low skeletal muscle mass with advanced liver fibrosis in patients with non‐alcoholic fatty liver disease
Min Kyu Kang, Jung Gil Park, Heon Ju Lee, Min Cheol Kim
Journal of Gastroenterology and Hepatology.2019; 34(9): 1633. CrossRef - Whole‐body vibration for patients with nonalcoholic fatty liver disease: a 6‐month prospective study
Sechang Oh, Natsumi Oshida, Noriko Someya, Tsuyoshi Maruyama, Tomonori Isobe, Yoshikazu Okamoto, Taeho Kim, Bokun Kim, Junichi Shoda
Physiological Reports.2019; 7(9): e14062. CrossRef - L-Lysine Attenuates Hepatic Steatosis in Senescence-Accelerated Mouse Prone 8 Mice
Tomonori SATO, Nao MURAMATSU, Yoshiaki ITO, Yoshio YAMAMOTO, Takashi NAGASAWA
Journal of Nutritional Science and Vitaminology.2018; 64(3): 192. CrossRef - Short-term treatment with metformin reduces hepatic lipid accumulation but induces liver inflammation in obese mice
Alexandre Abilio de Souza Teixeira, Camila O. Souza, Luana A. Biondo, Loreana Sanches Silveira, Edson A. Lima, Helena A. Batatinha, Adriane Pereira Araujo, Michele Joana Alves, Sandro Massao Hirabara, Rui Curi, José Cesar Rosa Neto
Inflammopharmacology.2018; 26(4): 1103. CrossRef - Vitamin D and Related Deficiencies, Sarcopenia and Visceral Obesity in Obese People with NAFLD
Mihaela Petrova
Gastroenterology & Hepatology: Open Access.2018;[Epub] CrossRef - Grip Strength Moderates the Association between Anthropometric and Body Composition Indicators and Liver Fat in Youth with an Excess of Adiposity
Robinson Ramírez-Vélez, Mikel Izquierdo, Jorge Correa-Bautista, Alejandra Tordecilla-Sanders, María Correa-Rodríguez, Jacqueline Schmidt Rio-Valle, Emilio González-Jiménez, Katherine González-Ruíz
Journal of Clinical Medicine.2018; 7(10): 347. CrossRef - Longitudinal Changes in Muscle Mass and Strength, and Bone Mass in Older Adults: Gender-Specific Associations Between Muscle and Bone Losses
Kyoung Min Kim, Soo Lim, Tae Jung Oh, Jae Hoon Moon, Sung Hee Choi, Jae Young Lim, Ki Woong Kim, Kyong Soo Park, Hak Chul Jang
The Journals of Gerontology: Series A.2018; 73(8): 1062. CrossRef - Non-alcoholic fatty liver disease connections with fat-free tissues: A focus on bone and skeletal muscle
Eleonora Poggiogalle, Lorenzo Maria Donini, Andrea Lenzi, Claudio Chiesa, Lucia Pacifico
World Journal of Gastroenterology.2017; 23(10): 1747. CrossRef - Sarcopenia and non-alcoholic fatty liver disease: Is there a relationship? A systematic review
Cristiane V Tovo, Sabrina A Fernandes, Caroline Buss, Angelo A de Mattos
World Journal of Hepatology.2017; 9(6): 326. CrossRef - Multiple molecular targets in the liver, adipose tissue and skeletal muscle in ginger-elicited amelioration of nonalcoholic fatty liver disease
Chunxia Wang, Robert Batey, Johji Yamahara, Yuhao Li
Journal of Functional Foods.2017; 36: 43. CrossRef - Importance of Lean Muscle Maintenance to Improve Insulin Resistance by Body Weight Reduction in Female Patients with Obesity
Yaeko Fukushima, Satoshi Kurose, Hiromi Shinno, Ha Cao Thu, Nana Takao, Hiromi Tsutsumi, Yutaka Kimura
Diabetes & Metabolism Journal.2016; 40(2): 147. CrossRef - Fatty Liver Index Associates with Relative Sarcopenia and GH/ IGF- 1 Status in Obese Subjects
Eleonora Poggiogalle, Carla Lubrano, Lucio Gnessi, Stefania Mariani, Andrea Lenzi, Lorenzo Maria Donini, Rasheed Ahmad
PLOS ONE.2016; 11(1): e0145811. CrossRef - The relationship between hepatic steatosis and skeletal muscle mass index in men with type 2 diabetes
Yoshitaka Hashimoto, Takafumi Osaka, Takuya Fukuda, Muhei Tanaka, Masahiro Yamazaki, Michiaki Fukui
Endocrine Journal.2016; 63(10): 877. CrossRef - Sarcopenia and the cardiometabolic syndrome: A narrative review
G. Bahat, B. İlhan
European Geriatric Medicine.2016; 7(3): 220. CrossRef - Low skeletal muscle mass is associated with non-alcoholic fatty liver disease in Korean adults: the Fifth Korea National Health and Nutrition Examination Survey
Hee Yeon Kim, Chang Wook Kim, Chung-Hwa Park, Jong Young Choi, Kyungdo Han, Anwar T Merchant, Yong-Moon Park
Hepatobiliary & Pancreatic Diseases International.2016; 15(1): 39. CrossRef - Non-alcoholic fatty liver disease and cardiovascular risk: Pathophysiological mechanisms and implications
Sven M. Francque, Denise van der Graaff, Wilhelmus J. Kwanten
Journal of Hepatology.2016; 65(2): 425. CrossRef - Differences among skeletal muscle mass indices derived from height-, weight-, and body mass index-adjusted models in assessing sarcopenia
Kyoung Min Kim, Hak Chul Jang, Soo Lim
The Korean Journal of Internal Medicine.2016; 31(4): 643. CrossRef - Relationship between grip strength and newly diagnosed nonalcoholic fatty liver disease in a large-scale adult population
Ge Meng, Hongmei Wu, Liyun Fang, Chunlei Li, Fei Yu, Qing Zhang, Li Liu, Huanmin Du, Hongbin Shi, Yang Xia, Xiaoyan Guo, Xing Liu, Xue Bao, Qian Su, Yeqing Gu, Huijun Yang, Bin Yu, Yuntang Wu, Zhong Sun, Kaijun Niu
Scientific Reports.2016;[Epub] CrossRef - Volume-dependent effect of supervised exercise training on fatty liver and visceral adiposity index in subjects with type 2 diabetes The Italian Diabetes Exercise Study (IDES)
Stefano Balducci, Patrizia Cardelli, Luca Pugliese, Valeria D’Errico, Jonida Haxhi, Elena Alessi, Carla Iacobini, Stefano Menini, Lucilla Bollanti, Francesco G. Conti, Antonio Nicolucci, Giuseppe Pugliese
Diabetes Research and Clinical Practice.2015; 109(2): 355. CrossRef - Sarcopenia is a risk factor for elevated aminotransferase in men independently of body mass index, dietary habits, and physical activity
Ki Deok Yoo, Dae Won Jun, Kang Nyeong Lee, Hang Lak Lee, Oh Young Lee, Byung Chul Yoon, Ho Soon Choi
Digestive and Liver Disease.2015; 47(4): 303. CrossRef
 PubReader
 Cite
Cite