
- Current
- Browse
- Collections
-
For contributors
- For Authors
- Instructions to authors
- Article processing charge
- e-submission
- For Reviewers
- Instructions for reviewers
- How to become a reviewer
- Best reviewers
- For Readers
- Readership
- Subscription
- Permission guidelines
- About
- Editorial policy
Articles
- Page Path
- HOME > Diabetes Metab J > Volume 45(2); 2021 > Article
-
Brief ReportCardiovascular risk/Epidemiology Clinical Impact of Dysglycemia in Patients with an Acute Myocardial Infarction
-
Jae-Wook Chung1
 , Yeong-Seon Park1, Jeong-Eon Seo1, Yeseul Son1, Cheol-Woo Oh1, Chan-Hee Lee1,2, Jong-Ho Nam1,2, Jung-Hee Lee1,2, Jang-Won Son1,2, Ung Kim1,2, Jong-Seon Park1,2, Kyu-Chang Won1,3, Dong-Gu Shin1,2
 -
Diabetes & Metabolism Journal 2021;45(2):270-274.
DOI: https://doi.org/10.4093/dmj.2019.0164
Published online: April 16, 2020
1Yeungnam University College of Medicine, Daegu, Korea
2Division of Cardiology, Department of Internal Medicine, Yeungnam University Medical Center, Daegu, Korea
3Division of Endocrinology, Department of Internal Medicine, Yeungnam University Medical Center, Daegu, Korea
-
Corresponding author: Chan-Hee Lee Division of Cardiology, Department of Internal Medicine, Yeungnam University Medical Center, Yeungnam University College of Medicine, 170 Hyunchoong-ro, Nam-gu, Daegu 42415, Korea. chanheebox@naver.com
• Received: September 3, 2019 • Accepted: November 11, 2019
Copyright © 2021 Korean Diabetes Association
This is an Open Access article distributed under the terms of the Creative Commons Attribution Non-Commercial License (http://creativecommons.org/licenses/by-nc/4.0/) which permits unrestricted non-commercial use, distribution, and reproduction in any medium, provided the original work is properly cited.
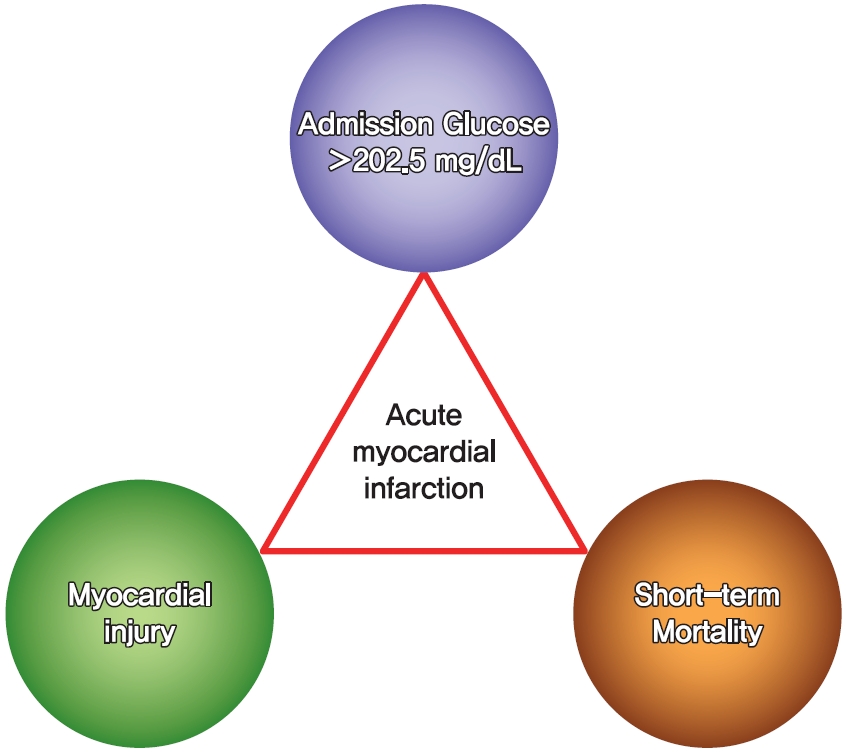
Figure & Data
References
Citations
Citations to this article as recorded by 
- Optimal Low-Density Lipoprotein Cholesterol Levels in Adults Without Diabetes Mellitus: A Nationwide Population-Based Study Including More Than 4 Million Individuals From South Korea
Ji Hye Huh, Sang Wook Park, Tae-Hwa Go, Dae Ryong Kang, Sang-Hak Lee, Jang-Young Kim
Frontiers in Cardiovascular Medicine.2022;[Epub] CrossRef - Association of admission hyperglycemia and all-cause mortality in acute myocardial infarction with percutaneous coronary intervention: A dose–response meta-analysis
Shao-Yong Cheng, Hao Wang, Shi-Hua Lin, Jin-Hui Wen, Ling-Ling Ma, Xiao-Ce Dai
Frontiers in Cardiovascular Medicine.2022;[Epub] CrossRef - Fenofibrate add-on to statin treatment is associated with low all-cause death and cardiovascular disease in the general population with high triglyceride levels
Kyung-Soo Kim, Sangmo Hong, Kyungdo Han, Cheol-Young Park
Metabolism.2022; 137: 155327. CrossRef - Basic types of the first-day glycemia in acute myocardial infarction: Prognostic, diagnostic, threshold and target glycemia
Goran Koracevic, Milan Djordjevic
Primary Care Diabetes.2021; 15(3): 614. CrossRef - Clinical Impact of Dysglycemia in Patients with an Acute Myocardial Infarction (Diabetes Metab J 2021;45:270-4)
Bo-Yeon Kim
Diabetes & Metabolism Journal.2021; 45(5): 787. CrossRef - Clinical Impact of Dysglycemia in Patients with an Acute Myocardial Infarction (Diabetes Metab J 2021;45:270-4)
Chan-Hee Lee
Diabetes & Metabolism Journal.2021; 45(5): 791. CrossRef - The Effects of Glucose Lowering Agents on the Secondary Prevention of Coronary Artery Disease in Patients with Type 2 Diabetes
Inha Jung, Hyemi Kwon, Se Eun Park, Kyung-Do Han, Yong-Gyu Park, Eun-Jung Rhee, Won-Young Lee
Endocrinology and Metabolism.2021; 36(5): 977. CrossRef - Effect of Admission Hyperglycemia on Short-Term Prognosis of Patients with Non-ST Elevation Acute Coronary Syndrome without Diabetes Mellitus
Wei Liu, Zhijuan Li, Shiying Xing, Yanwei Xu, Gaetano Santulli
Journal of Diabetes Research.2021; 2021: 1. CrossRef
 PubReader
 ePub Link
 Cite
Cite


