- Current
- Browse
- Collections
-
For contributors
- For Authors
- Instructions to authors
- Article processing charge
- e-submission
- For Reviewers
- Instructions for reviewers
- How to become a reviewer
- Best reviewers
- For Readers
- Readership
- Subscription
- Permission guidelines
- About
- Editorial policy
Articles
- Page Path
- HOME > Diabetes Metab J > Volume 35(2); 2011 > Article
-
Original ArticleThe Association of Unintentional Changes in Weight, Body Composition, and Homeostasis Model Assessment Index with Glycemic Progression in Non-Diabetic Healthy Subjects
- Eun-Jung Rhee1, Ji-Hun Choi1, Seung-Hyun Yoo1, Ji-Cheol Bae1, Won-Jun Kim1, Eun-Suk Choi1, Se Eun Park1, Cheol-Young Park1, Seok Won Park2, Ki-Won Oh1, Sung-Woo Park1, Sun-Woo Kim1, Won-Young Lee1
-
Diabetes & Metabolism Journal 2011;35(2):138-148.
DOI: https://doi.org/10.4093/dmj.2011.35.2.138
Published online: April 30, 2011
1Department of Endocrinology and Metabolism, Kangbuk Samsung Hospital, Sungkyunkwan University School of Medicine, Seoul, Korea.
2Department of Internal Medicine, CHA University, Pocheon, Korea.
- Corresponding author: Won-Young Lee. Department of Endocrinology and Metabolism, Kangbuk Samsung Hospital, Sungkyunkwan University School of Medicine, 78 Saemunan-gil, Jongno-gu, Seoul 110-746, Korea. drlwy@hanmail.net
• Received: August 3, 2010 • Accepted: December 27, 2010
Copyright © 2011 Korean Diabetes Association
This is an Open Access article distributed under the terms of the Creative Commons Attribution Non-Commercial License (http://creativecommons.org/licenses/by-nc/3.0/) which permits unrestricted non-commercial use, distribution, and reproduction in any medium, provided the original work is properly cited.


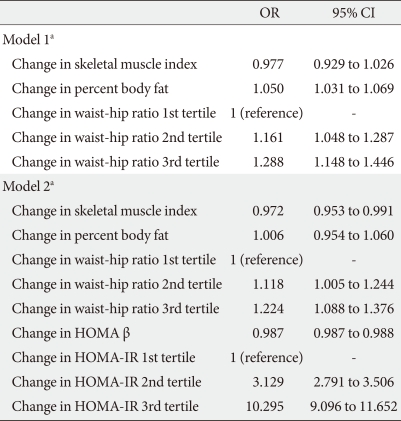
Figure & Data
References
Citations
Citations to this article as recorded by 
- Increased Risk of Nonalcoholic Fatty Liver Disease in Individuals with High Weight Variability
Inha Jung, Dae-Jeong Koo, Mi Yeon Lee, Sun Joon Moon, Hyemi Kwon, Se Eun Park, Eun-Jung Rhee, Won-Young Lee
Endocrinology and Metabolism.2021; 36(4): 845. CrossRef - Effects of nutritional supplementation on glucose metabolism and insulin function among people with HIV initiating ART
Hiwot Amare, Mette F. Olsen, Henrik Friis, Pernille Kæstel, Åse B. Andersen, Alemseged Abdissa, Daniel Yilma, Tsinuel Girma, Daniel Faurholt-Jepsen
BMC Nutrition.2021;[Epub] CrossRef - The ratio of estimated average glucose to fasting plasma glucose level as an indicator of insulin resistance in young adult diabetes
Jun Guo, Sisi Lei, Yu Zhou, Congqing Pan
Medicine.2020; 99(40): e22337. CrossRef - Reduced Skeletal Muscle Volume and Increased Skeletal Muscle Fat Deposition Characterize Diabetes in Individuals after Pancreatitis: A Magnetic Resonance Imaging Study
Andre E. Modesto, Juyeon Ko, Charlotte E. Stuart, Sakina H. Bharmal, Jaelim Cho, Maxim S. Petrov
Diseases.2020; 8(3): 25. CrossRef - Insulin resistance increases the risk of incident type 2 diabetes mellitus in patients with non‐alcoholic fatty liver disease
Yuya Seko, Yoshio Sumida, Saiyu Tanaka, Kojiroh Mori, Hiroyoshi Taketani, Hiroshi Ishiba, Tasuku Hara, Akira Okajima, Atsushi Umemura, Taichiro Nishikawa, Kanji Yamaguchi, Michihisa Moriguchi, Kazuyuki Kanemasa, Kohichiroh Yasui, Shunsuke Imai, Keiji Shim
Hepatology Research.2018;[Epub] CrossRef - Use of Novel High-Protein Functional Food Products as Part of a Calorie-Restricted Diet to Reduce Insulin Resistance and Increase Lean Body Mass in Adults: A Randomized Controlled Trial
Carol Johnston, Barry Sears, Mary Perry, Jessica Knurick
Nutrients.2017; 9(11): 1182. CrossRef - Gender differences in the association between food insecurity and insulin resistance among U.S. adults: National Health and Nutrition Examination Survey, 2005–2010
Junxiu Liu, Yong-Moon Mark Park, Seth A. Berkowitz, Qingwei Hu, Kyungdo Han, Andrew Ortaglia, Robert E. McKeown, Angela D. Liese
Annals of Epidemiology.2015; 25(9): 643. CrossRef - 1,5-Anhydroglucitol Is Associated with Early-Phase Insulin Secretion in Chinese Patients with Newly Diagnosed Type 2 Diabetes Mellitus
Xiaojing Ma, Yaping Hao, Xiang Hu, Yuqi Luo, Zixuan Deng, Jian Zhou, Yuqian Bao, Weiping Jia
Diabetes Technology & Therapeutics.2015; 17(5): 320. CrossRef - Serum glycated albumin as a new glycemic marker in pediatric diabetes
Ji Woo Lee, Hyung Jin Kim, Young Se Kwon, Yong Hoon Jun, Soon Ki Kim, Jong Weon Choi, Ji Eun Lee
Annals of Pediatric Endocrinology & Metabolism.2013; 18(4): 208. CrossRef - The Association of Maximum Body Weight on the Development of Type 2 Diabetes and Microvascular Complications: MAXWEL Study
Soo Lim, Kyoung Min Kim, Min Joo Kim, Se Joon Woo, Sung Hee Choi, Kyong Soo Park, Hak Chul Jang, James B. Meigs, Deborah J. Wexler, Noel Christopher Barengo
PLoS ONE.2013; 8(12): e80525. CrossRef - Relative contributions of insulin resistance and β‐cell dysfunction to the development of Type 2 diabetes in Koreans
C.‐H. Kim, H.‐K. Kim, E. H. Kim, S. J. Bae, J.‐Y. Park
Diabetic Medicine.2013; 30(9): 1075. CrossRef - Body Mass Index and Waist Circumference According to Glucose Tolerance Status in Korea: The 2005 Korean Health and Nutrition Examination Survey
Hye Mi Kang, Dong-Jun Kim
Journal of Korean Medical Science.2012; 27(5): 518. CrossRef - The Relationship between β-cell Function and Nutrient Intakes in Korean Adult - Using 4thKorea National Health and Nutrition Examination Survey 2009 -
You Mi Lee, Hye Kyung Chung, Heejin Kimm, Sun Ha Jee
Korean Journal of Community Nutrition.2012; 17(2): 243. CrossRef - The ratio of glycated albumin to glycated haemoglobin correlates with insulin secretory function
Daham Kim, Kwang J. Kim, Ji H. Huh, Byung‐Wan Lee, Eun S. Kang, Bong S. Cha, Hyun C. Lee
Clinical Endocrinology.2012; 77(5): 679. CrossRef
 PubReader
 Cite
Cite