
- Current
- Browse
- Collections
-
For contributors
- For Authors
- Instructions to authors
- Article processing charge
- e-submission
- For Reviewers
- Instructions for reviewers
- How to become a reviewer
- Best reviewers
- For Readers
- Readership
- Subscription
- Permission guidelines
- About
- Editorial policy
Articles
- Page Path
- HOME > Diabetes Metab J > Volume 34(1); 2010 > Article
-
Original ArticleEffects of Aerobic Exercise on Abdominal Fat, Thigh Muscle Mass and Muscle Strength in Type 2 Diabetic Subject
- Hwi Ryun Kwon1, Kyung Wan Min2, Hee Jung Ahn1, Hee Geum Seok1, Bo Kyung Koo3, Ho Chul Kim4, Kyung Ah Han2
-
Korean Diabetes Journal 2010;34(1):23-31.
DOI: https://doi.org/10.4093/kdj.2010.34.1.23
Published online: February 28, 2010
- 3,671 Views
- 44 Download
- 18 Crossref
1Diabetes Center, Eulji Hospital, Seoul, Korea.
2Department of Internal Medicine, Eulji University College of Medicine, Daejeon, Korea.
3Department of Internal Medicine, Seoul National University College of Medicine, Seoul, Korea.
4Kim Ho Chul Radiology Clinic, Seoul, Korea.
- Corresponding author: Kyung Ah Han. Department of Internal Medicine, Eulji University College of Medicine, 280-1 Hagye 1-dong, Nowon-gu, Seoul 139-872, Korea. hka1114@yahoo.co.kr
• Received: October 19, 2009 • Accepted: December 17, 2009
Copyright © 2010 Korean Diabetes Association
This is an Open Access article distributed under the terms of the Creative Commons Attribution Non-Commercial License (http://creativecommons.org/licenses/by-nc/3.0/) which permits unrestricted non-commercial use, distribution, and reproduction in any medium, provided the original work is properly cited.
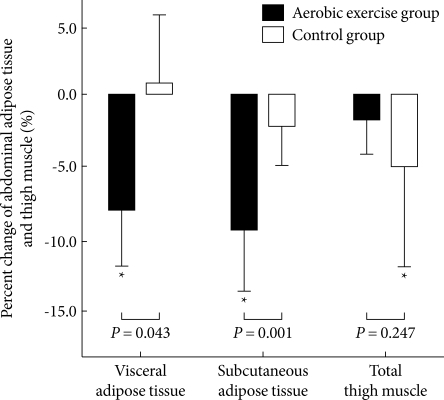
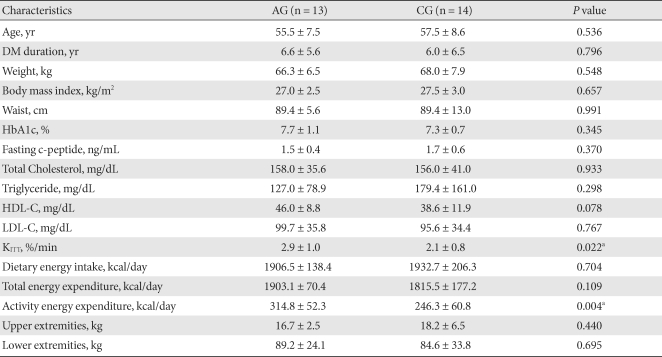
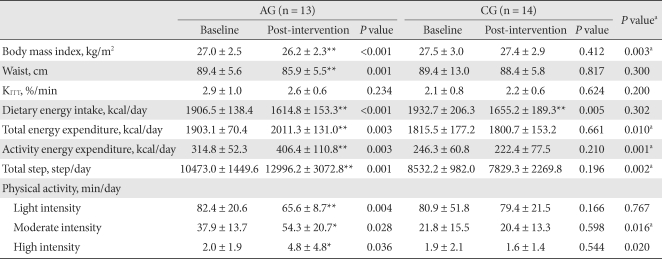
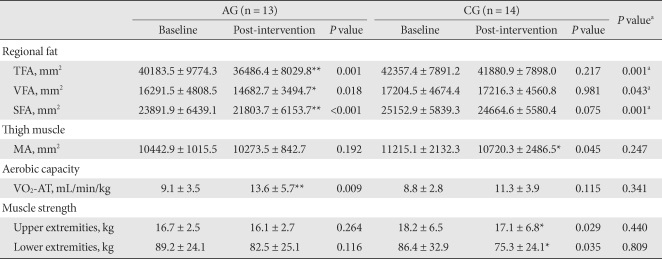
Figure & Data
References
Citations
Citations to this article as recorded by 
- Relationship Between Visceral Fat Tissue and Exercise
Ebru Ceviz
Türk Spor Bilimleri Dergisi.2024;[Epub] CrossRef - Walking for subjects with type 2 diabetes: a systematic review and joint AMD/SID/SISMES evidence-based practical guideline
P. Moghetti, S. Balducci, L. Guidetti, P. Mazzuca, E. Rossi, F. Schena, P. Moghetti, S. Balducci, L. Guidetti, F. Schena, P. Mazzuca, E. Rossi
Sport Sciences for Health.2021; 17(1): 1. CrossRef - Effect of exercise intervention dosage on reducing visceral adipose tissue: a systematic review and network meta-analysis of randomized controlled trials
Yu-Hsuan Chang, Hui-Ying Yang, Shiow-Ching Shun
International Journal of Obesity.2021; 45(5): 982. CrossRef - Comparison between different types of exercise training in patients with type 2 diabetes mellitus: A systematic review and network metanalysis of randomized controlled trials
Edoardo Mannucci, Allegra Bonifazi, Matteo Monami
Nutrition, Metabolism and Cardiovascular Diseases.2021; 31(7): 1985. CrossRef - The Therapeutic Effects of Mild to Moderate Intensity Aerobic Exercise on Glycemic Control in Patients with Type 2 Diabetes Mellitus: A Meta-Analysis of Randomized Trials
Siyao Gao, Jialing Tang, Guozhong Yi, Zhong Li, Zhenyin Chen, Ling Yu, Feng Zheng, Yajing Hu, Zhangui Tang
Diabetes Therapy.2021; 12(10): 2767. CrossRef - Walking for subjects with type 2 diabetes: A systematic review and joint AMD/SID/SISMES evidence-based practical guideline
P. Moghetti, S. Balducci, L. Guidetti, P. Mazzuca, E. Rossi, F. Schena
Nutrition, Metabolism and Cardiovascular Diseases.2020; 30(11): 1882. CrossRef - Effect of Coordinative Locomotor Training Program on Body Fat and Muscle mass of Male University students
Hyung chun Nam, Nam jeong Cho, Jae yong Choi
Archives of Orthopedic and Sports Physical Therapy.2019; 15(2): 109. CrossRef - Exercise training modalities in patients with type 2 diabetes mellitus: a systematic review and network meta-analysis
Bei Pan, Long Ge, Yang-qin Xun, Ya-jing Chen, Cai-yun Gao, Xue Han, Li-qian Zuo, Hou-qian Shan, Ke-hu Yang, Guo-wu Ding, Jin-hui Tian
International Journal of Behavioral Nutrition and Physical Activity.2018;[Epub] CrossRef - Exercise and ectopic fat in type 2 diabetes: A systematic review and meta-analysis
A. Sabag, K.L. Way, S.E. Keating, R.N. Sultana, H.T. O’Connor, M.K. Baker, V.H. Chuter, J. George, N.A. Johnson
Diabetes & Metabolism.2017; 43(3): 195. CrossRef - A systematic review and meta‐analysis on the effects of exercise training versus hypocaloric diet: distinct effects on body weight and visceral adipose tissue
R. J. H. M. Verheggen, M. F. H. Maessen, D. J. Green, A. R. M. M. Hermus, M. T. E. Hopman, D. H. T. Thijssen
Obesity Reviews.2016; 17(8): 664. CrossRef - Effects of Aerobic Exercise Associated with Abdominal Microcurrent: A Preliminary Study
Andreia Noites, Rita Nunes, Ana Isabel Gouveia, Alexandra Mota, Cristina Melo, Ágata Viera, Nuno Adubeiro, José Mesquita Bastos
The Journal of Alternative and Complementary Medicine.2015; 21(4): 229. CrossRef - Brain-derived neurotrophic factor correlated with muscle strength in subjects undergoing stationary bicycle exercise training
Sen-Wei Tsai, Yin-Ching Chan, Francois Liang, Chiann-Yi Hsu, I-Te Lee
Journal of Diabetes and its Complications.2015; 29(3): 367. CrossRef - Impact of Walking on Glycemic Control and Other Cardiovascular Risk Factors in Type 2 Diabetes: A Meta-Analysis
Shanhu Qiu, Xue Cai, Uwe Schumann, Martina Velders, Zilin Sun, Jürgen Michael Steinacker, Lamberto Manzoli
PLoS ONE.2014; 9(10): e109767. CrossRef - A systematic review and meta‐analysis of the effect of aerobic vs. resistance exercise training on visceral fat
I. Ismail, S. E. Keating, M. K. Baker, N. A. Johnson
Obesity Reviews.2012; 13(1): 68. CrossRef - The Effects of Regular Pilates Exercise on Blood pressure and Pulmonary Variables
Gyu-Chang Lee, Dong-Yeop Lee, Jae-Ho Yu
Journal of the Korea Academia-Industrial cooperation Society.2011; 12(7): 3088. CrossRef - The Effects of Aerobic/Resistance Exercise on Body Fat Mass, Muscle Strength and Endothelial Function in Korean Type 2 Diabetes mellitus Patients
Kyung Wan Min
Journal of Korean Diabetes.2011; 12(1): 6. CrossRef - The Evaluation of Workplace Obesity Intervention Program using Six Sigma Methodology
Ji Yeon Kang, Ill Keun Park, Yun Kyun Chang, Sook Hee Sung, Yoo Kyoung Park, Sang Woon Cho, Yun Mi Paek, Tae In Choi
The Korean Journal of Obesity.2011; 20(4): 193. CrossRef - How Can We Measure the Effects of Exercise in Daily Life?
Sang Yong Kim
Korean Diabetes Journal.2010; 34(1): 21. CrossRef
 PubReader
 Cite
Cite


