Skip Navigation
Skip to contents

Diabetes Metab J : Diabetes & Metabolism Journal

Search
OPEN ACCESS

Articles

Page Path
HOME > Diabetes Metab J > Volume 35(4); 2011 > Article
Original Article
A Comparative Study of Eating Habits and Food Intake in Women with Gestational Diabetes according to Early Postpartum Glucose Tolerance Status
You Jeong Hwang1, Bo Kyung Park1, Sunmin Park2, Sung-Hoon Kim3
Diabetes & Metabolism Journal 2011;35(4):354-363.
DOI: https://doi.org/10.4093/dmj.2011.35.4.354
Published online: August 31, 2011
  • 65,535 Views
  • 45 Download
  • 7 Crossref
  • 5 Scopus

1Department of Nutrition, Cheil General Hospital & Women's Healthcare Center, Kwandong University College of Medicine, Seoul, Korea.

2Department of Food and Nutrition, Hoseo University, Asan, Korea.

3Division of Endocrinology and Metabolism, Department of Medicine, Cheil General Hospital and Women's Healthcare Center, Kwandong University College of Medicine, Seoul, Korea.

corresp_icon Corresponding authors: Sung-Hoon Kim. Division of Endocrinology and Metabolism, Department of Medicine, Cheil General Hospital and Women's Healthcare Center Kwandong University College of Medicine, 1-19 Mukjeong-dong, Jung-gu, Seoul 100-380, Korea. hoonie.kim@cgh.co.kr, Sunmin Park. Department of Food and Nutrition, Hoseo University, 165 Sechul-ri, Baebang-eup, Asan 336-795, Korea. smpark@hoseo.edu
• Received: July 12, 2010   • Accepted: December 27, 2010

Copyright © 2011 Korean Diabetes Association

This is an Open Access article distributed under the terms of the Creative Commons Attribution Non-Commercial License (http://creativecommons.org/licenses/by-nc/3.0/) which permits unrestricted non-commercial use, distribution, and reproduction in any medium, provided the original work is properly cited.

prev next
  • Background
    Women with gestational diabetes mellitus (GDM) are at high risk for type 2 diabetes mellitus (T2DM) and cardiovascular disease (CVD); continuous life-style intervention, especially diet, is central to managing T2DM and CVD. However, little is known about the dietary patterns of women with GDM after delivery. The goal of this study was to compare the eating habits and food intakes of women diagnosed with GDM during the early postpartum period.
  • Methods
    We performed a 75 g oral glucose tolerance test (OGTT) in 184 women with GDM between 6 and 12 weeks after delivery. Based on the results of the OGTT, the subjects were divided into three groups according to the American Diabetes Association criteria; normal glucose tolerance (NGT) (n=100), pre-diabetes (n=73), and diabetes mellitus (DM) (n=11). Eating habits and usual food intake after delivery were investigated using a questionnaire, based on 24 hour-recall, which was administered by a trained dietitian. The daily intake data were analyzed using CAN Pro 3.0. Blood tests were performed pre- and post-delivery.
  • Results
    Eating habits were not significantly different among the three groups. However, animal fat consumption was significantly different among the three groups. The intake ratio of fat calories to total calories was also significantly higher in the pre-diabetes and DM groups.
  • Conclusion
    Although diet in the period 6 to 12 weeks postpartum did not influence glucose level, it may be important to educate women with GDM about the risks of excessive animal fat intake during pregnancy and the postpartum period in order to prevent later onset of T2DM.
Diabetes is defined as a chronic metabolic disorder characterized by a dysfunction in insulin secretion and/or insulin action, also known as hyperglycemia, and is divided into type 1 diabetes mellitus, type 2 diabetes mellitus (T2DM), and gestational diabetes mellitus (GDM) [1]. GDM is a common complication of pregnancy [2], occurring in approximately 7% of all pregnancies while based on other study subjects and the different diagnostic criteria, the prevalence range of various ethnic populations was reported to be between 1% and 14% [3], and that number steadily increasing [4,5]. Additionally, the prevalence of GDM is similar in Korea as in other countries (approximately 2% to 3%) [5]; moreover, when the diagnostic criteria were updated, a 4% increase in the prevalence was reported [6]. In some women with GDM, impaired glucose tolerance persists even after delivery, or they are diagnosed with diabetes. Although women with GDM return to normal glucose level after delivery, many of these women may develop diabetes later in life. The prevalence of diabetes at postpartum has been reported variously and increases significantly within five years after delivery for women previously diagnosed with GDM. During follow-up in previous studies, up to 70% of women with GDM developed T2DM [7,8].
T2DM is a major risk factor for cardiovascular disease (CVD), and a recent study has shown that it is the largest cause of death in diabetes patients [9]. Additionally, women who had GDM, even after returning to normal blood glucose levels after delivery, are at greater risk for developing abnormal vascular function [10]. As compared to diabetes patients who have no history of GDM, the incidence of chronic diabetes complications is high in those with a GDM history, especially the mortality rate due to cardiovascular complications [11]. Thus, it is very important to manage and reduce complications early in women with a history of GDM who are at high risk of developing diabetes and CVD. The risk factors for GDM and T2DM are similar - environmental factors such as diet, exercise, and smoking, all considered to be significant. Dietary factors that induce obesity, especially the consumption of saturated fatty acids were reported to be strongly linked with insulin resistance and CVD [12,13].
Studies on Korean GDM patients were performed to determine dietary factors that affect the pathogenesis of GDM [14] and an effective diet for glycemic control during pregnancy [15] and/or to describe the progression of GDM itself. However, there are very few studies which observe the types of meals consumed after delivery. Because GDM is considered to put patients at high risk for T2DM and CVD, studies on dietary habits after delivery are considered to be very important and may help in the prevention and management of further progression to T2DM.
In this study, blood tests were performed 6 to 12 weeks after delivery. Based on the blood glucose results, patients were separated into groups: a normal glucose tolerance (NGT) group, a pre-diabetes group, and a diabetes mellitus (DM) group. After separating participants into their respective groups, eating habits and dietary intake were compared. In order to give direction to preventing T2DM and CVD, we observed difference of diet among three groups.
Subjects
At Cheil General Hospital, Kwandong University College of Medicine, 196 women diagnosed with GDM between February 2008 and September 2009 were observed at 6 to 12 weeks after delivery for post-gestational diabetes management. Among those diagnosed with GDM, those who were diagnosed 24 weeks prior to pregnancy, did not agree to the terms of the study and those who had given birth to twins were excluded from the study, resulting in a total of 184 surveyed patients who participated in this study. A diagnosis of GDM was utilizing two step procedure, screening test and diagnostic test with Carpenter & Coustan method [1]. Dietary education for diabetes management was provided to all study subjects. Additionally, at the 6 to 12 weeks after delivery, a 75 g oral glucose tolerance test (OGTT) was performed on each woman. Based on the criteria provided by the American Diabetes Association (ADA) [16], participants were classified as follows: NGT, impaired fasting glucose (IFG), impaired glucose tolerance (IGT) and combined symptoms of IFG/IGT and DM. This study separated the patients into three groups: the NGT group, the pre-diabetes group included the IFG, IGT and IFG+IGT, and the DM group. For our study, there were 100 patients in the NGT group, 73 patients in the pre-diabetes group, and 11 in the DM group. This study was approved by the Cheil General Hospital Institutional Review Board, and all participants provided written consent.
Nutritional education and recommended daily allowance
After being diagnosed with GDM, all participants received a three-phase education regarding dietary management. Phase 1 of the education was administered individually at the diagnosis of GDM and focused on calculating the required daily calories. After the education, meal record papers were provided. Phase 2 of the education was performed two weeks after the phase 1 education. The meal record was reviewed in order to correct improper dietary intake in the previously planned diet. Phase 3 of the education was administered during the hospitalization after delivery, that the education from phase 1 was reviewed. The food exchange list from the Korean Diabetes Association and life-size food models (Korea Mirage model) were used to educate the participants. In order to calculate the required caloric intake, a standard body mass index (BMI) was used. Considering the subjects were in the recovery of delivery, obesity was not taken into account and all activities of daily life were considered as light activities. The amount of calories required for breastfeeding is 320 kcal per day [17]. Therefore, that amount was added to the meal plan for those patients who were breastfeeding; no additional calories were added for those subjects who were not breastfeeding. The caloric intake required by breastfeeding women after delivery is set by the following formula [18]:
Estimated energy requirement during breastfeeding (kcal)=height (m2)×21×30+320
Additionally, in order to use the same ratio of carbohydrates, proteins, and lipids consumed during the gestational diabetes treatment period, meals were composed using a 50:20:30 ratio [15], and consumptions of high fat meat and fish and simple sugars were restricted. The benefits of proper exercise and weight management were also mentioned. At 6 to 12 weeks after delivery, eating habits and food intakes were investigated, and blood tests were performed.
Survey information
Using a questionnaire, general information and diet were investigated. General information included age, height, weight before pregnancy, weight at delivery, difference between before and after pregnancy weight, BMI prior to pregnancy, whether patients were breastfeeding, intensity of activity, household income, family history, insulin use during pregnancy and parity. Dietary habits after delivery until readmission for check-up were surveyed, including the number of meals per day, whether or not breakfast was consumed, the regularity of meal time, the time taken to consume a meal, whether patients overate, frequency of meals eaten at restaurants, main foods eaten when patients dined out, the number of grains, fish, vegetables and high fat foods consumed, average number of snacks consumed, types of foods consumed as snacks, as well as the amounts of sweets, salty foods, high fat meat and fish and instant foods consumed except for main foods eaten when patients dined out, all items in the questionnaire were scored in order to compare the study groups. Good eating habits received a score of 3, moderate eating habits received a score of 2, and poor eating habits received a score of 1. The sums for each group were calculated. A dietician surveyed the usual daily food intake by a 24 hour-recall method using pictures of food to help patients recall before their check-up day. The CAN Pro 3.0 (Computer Aided Nutritional Analysis Program, version 3.0; Korean Nutrition Society, Seoul, Korea) was used to analyze dietary information, such as calories and nutrients in the foods consumed.
Blood tests were performed during the diagnosis of GDM and again 6 to 12 weeks after delivery. The blood test performed 6 to 12 weeks after delivery included measures for a 2-hour postprandial blood glucose, glycated hemoglobin (HbA1c), total cholesterol (TC), high density lipoprotein cholesterol (HDL-C), low density lipoprotein cholesterol (LDL-C), triglycerides (TG), high-sensitive C-reactive protein (hs-CRP), C-peptide, systolic blood pressure (SBP), and diastolic blood pressure (DBP). During diagnosis of GDM, the blood test included all of the above plus 1 hour blood glucose, 3 hour blood glucose, body weight 6 to 12 weeks after delivery, BMI and body fat percentage.
Statistical analysis
The SAS program version 9.1 (SAS Institute, Cary, NC, USA) was used for data processing. Those who responded to the survey were separated into three groups: NGT, pre-diabetes, and DM groups. The differences among the three groups were compared, and the median and interquartile range (IQR) of all items were calculated. In order to investigate the statistical significance among the three groups, the Kruskal-Wallis non-parametric test was used for variables with irregular distribution. In order to compare the dietary habits of subjects, a chi-square test was used for the differences in frequency. Results with P values less than 0.05 were considered to be statistically significant.
General information and survey of dietary habits
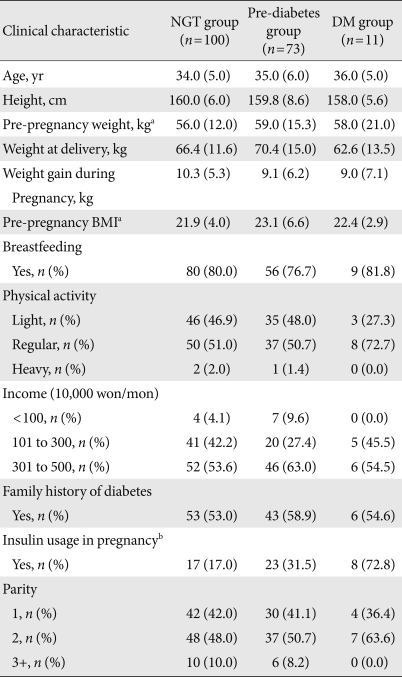
After women with GDM gave birth, the subsequent management percentage was 67.8%. The distribution of postpartum patients with GDM was 52.5% in the NGT group, 39.3% in the pre-diabetes group, and 8.2% in the DM group. The general characteristics of the study participants (Table 1) showed that there was a significant difference in body weight and BMI prior to pregnancy among the three groups (P<0.05). About whether to use insulin, 72.7% of patients in DM group, 31.5% of patients in the pre-diabetes group and only 17.0% of patients in the NGT group reported using insulin. As blood glucose levels increased after delivery among patients who had received treatment for GDM, a significant increase in the use of insulin was observed (P<0.001). Other factors, including age, height, weight at delivery, weight gain during pregnancy, breastfeeding status, physical activity, income, family history and fertility, were not significantly different among the groups.
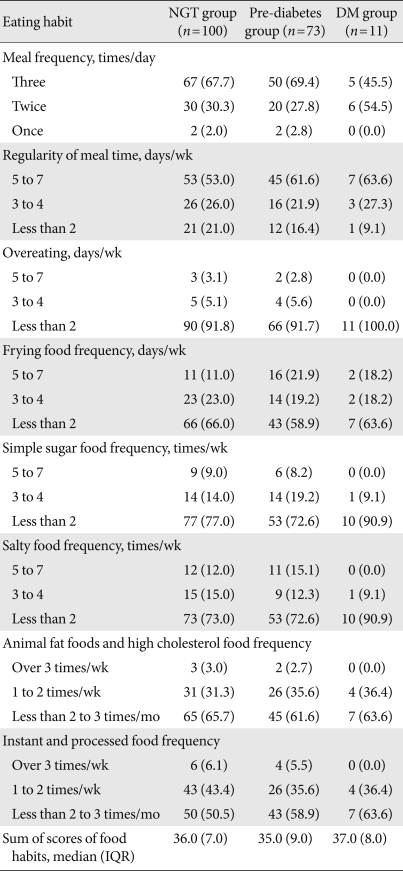
Seventeen items from the diets of subjects 6 to 12 weeks after delivery were investigated, but there were no significant differences among groups. The dietary score and the fat score from the questionnaire totals did not show any significant differences. Based on the survey responses, results of scores regarding the number of meals consumed per day, regularity, overeating, amount of fatty foods, foods containing simple sugars, salty foods, foods high in cholesterol, instant foods and processed foods consumed, were shown in Table 2.
Comparison of amounts consumed during meals
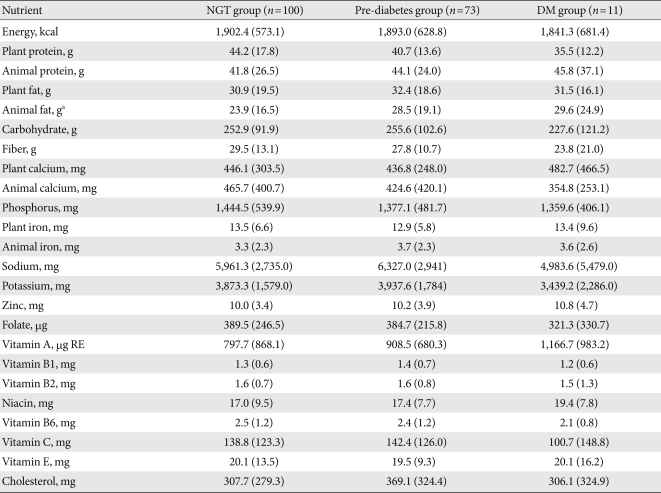
The results for the dietary intake of each group are presented in Table 3. Groups of higher blood glucose were consumed animal fat more and there was a significant difference in the increase among the three groups (P<0.05). Other than animal fats, no other nutrient intakes showed a significant difference among the three groups. Protein, calcium and iron from foods were separated by whether they were from vegetables or animal products and were then compared. However, the results from this comparison were not statistically significant.
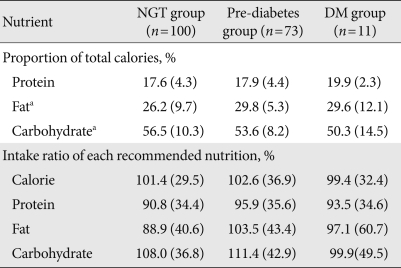
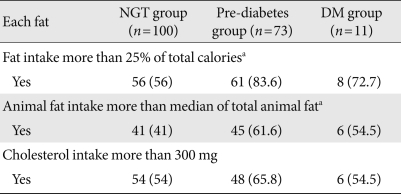
In order to investigate the frequency of proper dietary practices in the study subjects, total calories consumed from protein, lipids, carbohydrates and sugars were transformed to percentages and then compared individually to the recommended daily intakes taught during the educational period (Table 4). The increase in caloric intake from fats was higher, but the decrease in caloric intake from carbohydrates was higher in DM group (P<0.05). The protein intake of all groups was less than 20% of total caloric intake, which is recommended to consume, and there was no significant difference among the three groups. The number of participants who exceeded the recommended amounts of total lipids, animal fat and cholesterol in each study group was determined (Table 5). Recommended allowance is less than 25% consumption of lipids, 300 mg of cholesterol and median value of animal fat [19]. In lipids and animal fat consumption, there was a statistically significant difference among the study groups (P<0.05); however, the difference in cholesterol consumption was not significant.
Comparison of blood test results at diagnosis in patients with gestational diabetes
Results from blood tests that were performed during the diagnosis of GDM in the study subjects were examined and are presented in Table 6. In the diagnostic test of GDM, the 100 g OGTT, fasting blood glucose levels (P<0.001) and blood glucose levels after 1 hour (P<0.001), 2 hours (P<0.001), and 3 hours (P<0.05) were significantly different among the three groups. There was also a significant difference in HbA1c among the three groups (P<0.001). In addition, TC, HDL-C, and LDL-C decreased as the blood glucose levels increased, with a significant difference (P<0.05). In contrast, TG had a tendency to be high in the DM group; however, this was not statistically significant. SBP and DBP were also significantly different among the groups (P<0.05), while C-peptide and hs-CRP showed no statistical difference.
Comparison of blood test results after delivery
The results from the blood tests performed 6 to 12 weeks after delivery are shown in Table 7. Body weight, BMI, and body fat were statistically different among the groups (P<0.05). As the blood glucose increased, HDL-C decreased significantly (P<0.05), but TG (P<0.05), SBP (P<0.05), and DBP (P<0.001) increased significantly. TC, LDL-C, hs-CRP, and C-peptide did not show a significant difference among the groups.
The percentages of participants in the NGT group, the pre-diabetes group and the DM group were 52.5%, 39.3%, and 8.2%, respectively. However, this is different from the results reported by Jang et al. [20] who reported 23.2% IGT and 15.1% diabetes in an examination 6 weeks after delivery and those of Rivas et al. [21] who reported 18.8% diabetes, 15.38% IGT, and 11.97% IFG in an examination performed two to four months after delivery. However, since pre-diabetes has also abnormal glucose metabolism, a proportion near 50% has abnormal glucose metabolism at postpartum seen in all of these studies. In studies on the dietary habits of diabetes patients [22] compared to those of non-diabetes subjects, diabetic patients had poor eating habits such as more irregular meal intake, more frequent overeating and preference for salty and greasy foods. Even in studies on GDM patients [14], the scores for dietary habits are significantly lower and participants report improper dietary habits. However, differences based on the three groups were not observed in the dietary habits in this study; preferred foods were similar between the groups, because of limited period after delivery. So the gestational diabetes diet is thought to be maintained because patients have given birth very recently and persists due to lingering habits.
However, when compared to actual intake, as blood glucose increases, the consumption of animal fats increased significantly, and patients reporting consumption of foods high in animal fats and high in cholesterol may not be reflected their bad consumption habits.
In foreign papers studied the relationship between high cholesterol intake and GDM, 50 mg/1,000 kcal increase in cholesterol consumption [23] increases the risk of GDM by 88% and is thought to have a stronger correlation on GDM than other fats. Additionally, dietary cholesterol in diabetic patients is associated with CVD, and in particular, when more than one egg was consumed per day increases the risk of CVD unlike non-diabetic people [24]. Although dietary cholesterol in this study did not show a significant difference among groups, more than 50% of the patients in all groups consumed more than 300 mg over the recommended amount (Table 5). Although the body weight, BMI, and body fat among the three groups in this study were not statistically significant, after delivery, unlike the normal group, the blood cholesterol level did not decrease in the diabetes group. Therefore, it is thought that training is required regarding dietary cholesterol restrictions to prevent CVD in the high-risk diabetes group. Regarding this nutritional education, it is thought that more education on the specific criteria for limiting high fat foods and foods that are high in cholesterol is needed.
Regarding the consumption of lipids, unlike in Western countries, in South Korea, it is assumed that individuals do not generally consume fats in excessive amounts [22]. However, in this study, the consumption ratios of total fat and animal fat over the standard amount were significantly different among the three groups (Table 5), and dietary changes and the consumption of lipids have increased in this society. There are several different studies about total fat and animal fat intakes. Some of the studies reported consumption of fat increases the risk of diabetes [25], whereas others reported that there was no relationship between these measures [26], even when adjusted for BMI. Similar to results from Western studies, the consumption of animal fats and saturated fats are considered to be associated with the increase in risk factors of cardiovascular complications [12], suggesting that appropriate management of these factors is required.
Based on studies on the effects of carbohydrate restriction in meals during the management of GDM, the recommended carbohydrate:protein:fats ratio during education was 50:20:30 [15]. However, in contrast to techniques of the past, rather than focusing on exclusion of carbohydrates, it is deemed important to emphasize the reduction of high fat food consumption. In the high blood glucose group in the present study, it was common for more than 25% of calories consumed to be from fats. In addition, when the nutrient consumption ratios of the normal group after delivery were considered, the percentages were adjusted to 55% carbohydrates and 25% lipids. We felt that re-education would be helpful to prevent postpartum diabetes, and that another study on proper allocation of carbohydrates, proteins and lipids is required. Regarding protein and iron intake, it has been reported that animal protein, or processed meat consumption increases the risk of diabetes [26,27] and animal iron intakes increase the risk of diabetes [28,29]. However, in the present study, when iron from vegetable and animal proteins were analyzed and compared, there were no significant differences. However, compared to the NGT group, it can be seen that the consumption of animal proteins was higher in the pre-diabetes and DM group (Table 3). For people with diabetes, the recommended protein consumption is 15% to 20% of their total caloric intake [18]. In this study, all subjects consumed the recommended range of protein intake, and this is thought to be an effect of the nutritional education. There was no significant difference in the intake of folic acid among the three groups, and when compared to the proposed average folic acid requirement to breastfeed (450 µg from the 7th revision of the Korean dietary reference) [17], all three groups had been consuming less than the recommended amount. This is consistent with the nutritional intake survey from all adults with IFG [30]. There are many cases in which the nutritional status of folic acid worsens during breastfeeding, and given that diabetes patients have deficiencies of folic acid, this could increase the risk of developing atherosclerotic disease [30]. So after GDM patients give birth, the necessity to mention the need for folic acid in education has been noted. In mothers exhibiting high blood glucose, we feel that folic acid supplements should be considered.
Like in prior studies of women with GDM, increases in blood lipid levels and the risk of CVD [31,32] can be observed. In this study, TG and high blood pressure were significantly higher in the pre-diabetes and DM group. As a result, it is thought that this information should also be included in pre- and postnatal dietary education.
This study has limitations that short period (6 to 12 weeks after delivery), the number of patients in the DM group was insufficient compared to those in the NGT group. Therefore, in order to recruit new patients for the DM group in future studies, an extended study is required. Despite these limitations, because lifestyles that include proper eating habits were not changed short-term, and GDM patients are at high risk for T2DM and CVD, meal management shortly after birth is considered to be the first step toward preventing from GDM developing into T2DM. Further studies on additional factors regarding eating habits and types of foods consumed at six months and one year after giving birth are needed. In addition, this study started immediately after women gave birth, so patients were separated based on whether they were breast-feeding or not. When the lactation period progresses, mixed breastfeeding often takes place; therefore, further studies regarding nutrients required for mixed breastfeeding women who had GDM are required.
In conclusion, the short window of this study was not sufficient to effect on the blood glucose level at 6 to 12 weeks after giving birth. However, considering long-term dieting does have an effect on diabetes patients and as mentioned earlier, when we consider the fact that eating habits cannot be corrected in such a short period of time, for women with GDM who are at risk for developing T2DM and CVD, the first step toward prevention is starting at delivery, diet management, particularly cholesterols from animal fats. And we feel strongly that a specific educational plan that can be easily understood by patients must be implemented.
Acknowledgements
This study was supported by a grant from the Korea Health 21 R & D Project, Ministry of Health of Health & Welfare, Republic of Korea (Grant no. A050463) and from the Korean Research Foundation in Korea (R04-2008-000-10078-0).

No potential conflict of interest relevant to this article was reported.

  • 1. The Expert Committee on the Diagnosis and Classification of Diabetes Mellitus. Report of the Expert Committee on the Diagnosis and Classification of Diabetes Mellitus. Diabetes Care 2002;25(Suppl 1):S5-S20.ArticlePDF
  • 2. Moses RG, Cheung NW. Point: universal screening for gestational diabetes mellitus. Diabetes Care 2009;32:1349-1351. ArticlePubMedPMCPDF
  • 3. American Diabetes Association. Gestational diabetes mellitus. Diabetes Care 2004;27(Suppl 1):S88-S90. ArticlePubMedPDF
  • 4. Dabelea D, Snell-Bergeon JK, Hartsfield CL, Bischoff KJ, Hamman RF, McDuffie RS. Kaiser Permanente of Colorado GDM Screening Program. Increasing prevalence of gestational diabetes mellitus (GDM) over time and by birth cohort: Kaiser Permanente of Colorado GDM Screening Program. Diabetes Care 2005;28:579-584. PubMed
  • 5. Jang HC, Jung KB, Cho NH, Metzger BE. Gestational diabetes mellitus in Korea: is universal screening necessary? Korean J Obstet Gynecol 1996;39:519-530.
  • 6. Jang HC, Cho YM, Park KS, Kim SY, Lee HK, Kim MY, Yang JH, Shin SM. Pregnancy outcome in Korean women with gestational diabetes mellitus diagnosed by the Carpenter-Coustan criteria. J Korean Diabetes Assoc 2004;28:122-130.
  • 7. Setji TL, Brown AJ, Feinglos MN. Gestational diabetes mellitus. Clin Diabetes 2005;23:17-24.ArticlePDF
  • 8. Kim C, Newton KM, Knopp RH. Gestational diabetes and the incidence of type 2 diabetes: a systematic review. Diabetes Care 2002;25:1862-1868. PubMed
  • 9. Park SK, Park MK, Suk JH, Kim MK, Kim YK, Kim IJ, Kang YH, Lee KJ, Lee HS, Lee CW, Kim BH, Lee KI, Kim MK, Kim DK. Cause-of-death trends for diabetes mellitus over 10 years. Korean Diabetes J 2009;33:65-72.Article
  • 10. Hu J, Norman M, Wallensteen M, Gennser G. Increased large arterial stiffness and impaired acetylcholine induced skin vasodilatation in women with previous gestational diabetes mellitus. Br J Obstet Gynaecol 1998;105:1279-1287. ArticlePubMed
  • 11. Jang HC. High risk group of type II DM: gestational diabetes mellitus. J Korean Diabetes Assoc 2005;29:11-17.
  • 12. Yu SY, Hong HS, Lee HS, Choi YJ, Huh KB, Kim WY. The association of insulin resistance with cardiovascular disease risk and dietary factors in Korean type 2 DM patients. Korean J Nutr 2007;40:31-40.
  • 13. Dandona P, Aljada A, Chaudhuri A, Mohanty P, Garg R. Metabolic syndrome: a comprehensive perspective based on interactions between obesity, diabetes, and inflammation. Circulation 2005;111:1448-1454. ArticlePubMed
  • 14. Ji SK, Jang HC, Choi H. A case-control study of food habits and diet intakes of women with gestational diabetes mellitus. Korean J Nutr 2008;41:41-53.
  • 15. Park BK. The effects of carbohydrate-restricted diet therapy in gestational diabetes [master's thesis]. 2001. [Seoul]: Yonsei University.
  • 16. American Diabetes Association. Diagnosis and classification of diabetes mellitus. Diabetes Care 2008;31(Suppl 1):S55-S60. ArticlePubMedPDF
  • 17. The Korean Nutrition Society. Dietary reference intakes for Koreans. 2005. Seoul: The Korean Nutrition Society; p. 22.
  • 18. The Korean Dietetic Association. Manual of medical nutrition therapy. 2008. 3rd ed. Seoul: The Korean Dietetic Association; p. 18p. 39.
  • 19. American Association of Diabetes Educators. A core curriculum for diabetes education. 2003. 5th ed. Chicago: American Association of Diabetes Educators; p. 3-58.
  • 20. Jang HC, Yim CH, Han KO, Yoon HK, Han IK, Kim MY, Yang JH, Cho NH. Gestational diabetes mellitus in Korea: prevalence and prediction of glucose intolerance at early postpartum. Diabetes Res Clin Pract 2003;61:117-124. ArticlePubMed
  • 21. Rivas AM, Gonzalez N, Gonzalez J. High frequency of diabetes in early post-partum assessment of women with gestational diabetes mellitus. Diabetes Metab Syndr 2007;1:159-165.Article
  • 22. Yang EJ, Kim WY. The influence of dietary factors on the incidence of non-insulin dependent diabetes mellitus. Korean J Nutr 1999;32:407-418.
  • 23. Gonzalez-Clemente JM, Carro O, Gallach I, Vioque J, Humanes A, Sauret C, Abella M, Gimenez-Perez G, Mauricio D. Increased cholesterol intake in women with gestational diabetes mellitus. Diabetes Metab 2007;33:25-29. ArticlePubMed
  • 24. Lau DC. Dietary cholesterol and other nutritional considerations in people with diabetes. Int J Clin Pract Suppl 2009;(163):15-21. 44-51. ArticlePubMed
  • 25. Thanopoulou AC, Karamanos BG, Angelico FV, Assaad-Khalil SH, Barbato AF, Del Ben MP, Djordjevic PB, Dimitrijevic-Sreckovic VS, Gallotti CA, Katsilambros NL, Migdalis IN, Mrabet MM, Petkova MK, Roussi DP, Tenconi MT. Dietary fat intake as risk factor for the development of diabetes: multinational, multicenter study of the Mediterranean Group for the Study of Diabetes (MGSD). Diabetes Care 2003;26:302-307. PubMed
  • 26. van Dam RM, Willett WC, Rimm EB, Stampfer MJ, Hu FB. Dietary fat and meat intake in relation to risk of type 2 diabetes in men. Diabetes Care 2002;25:417-424. ArticlePubMedPDF
  • 27. Sluijs I, Beulens JW, van der A DL, Spijkerman AM, Grobbee DE, van der Schouw YT. Dietary intake of total, animal, and vegetable protein and risk of type 2 diabetes in the European Prospective Investigation into Cancer and Nutrition (EPIC)-NL study. Diabetes Care 2010;33:43-48. ArticlePubMedPDF
  • 28. Zhang C, Schulze MB, Solomon CG, Hu FB. A prospective study of dietary patterns, meat intake and the risk of gestational diabetes mellitus. Diabetologia 2006;49:2604-2613. ArticlePubMedPDF
  • 29. Rajpathak S, Ma J, Manson J, Willett WC, Hu FB. Iron intake and the risk of type 2 diabetes in women: a prospective cohort study. Diabetes Care 2006;29:1370-1376. PubMed
  • 30. Hwang MR, Shin MH, Rhee JA, Kweon SS, Lim HS. Effects of folic acid or ascorbate supplementation on plasma homocysteine levels and oxidative stress in Korean adults with impaired fasting glucose. Korean J Community Nutr 2008;13:263-275.
  • 31. Kitzmiller JL, Dang-Kilduff L, Taslimi MM. Gestational diabetes after delivery. Short-term management and long-term risks. Diabetes Care 2007;30(Suppl 2):S225-S235. PubMed
  • 32. Meyers-Seifer CH, Vohr BR. Lipid levels in former gestational diabetic mothers. Diabetes Care 1996;19:1351-1356. ArticlePubMedPDF
Table 1
Clinical characteristics and life style of women with gestational diabetes according to postpartum glucose tolerance status
dmj-35-354-i001.jpg

Values are presented as median (interquartile range) or number (%).

NGT, normal glucose tolerance; DM, diabetes mellitus; BMI, body mass index.

aAverage ranks to be significantly different at P<0.05 by Kruskal-Wallis test, bProportions at P<0.001 by chi-square test among the three groups.

Table 2
Eating habits of women with gestational diabetes according to postpartum glucose tolerance status
dmj-35-354-i002.jpg

Values are presented as number (%) or median (interquartile range).

There are no significantly different values for any parameter.

NGT, normal glucose tolerance; DM, diabetes mellitus.

Table 3
Daily nutrient intakes of women with gestational diabetes according to postpartum glucose tolerance status
dmj-35-354-i003.jpg

Values are presented as median (interquartile range).

NGT, normal glucose tolerance; DM, diabetes mellitus.

aAverage ranks to be significantly different at P<0.05 by Kruskal-Wallis test among the three groups.

Table 4
Recommended and actual intake ratios of protein, fat, and carbohydrates in women with gestational diabetes according to postpartum glucose tolerance status
dmj-35-354-i004.jpg

Values are presented as median (interquartile range).

NGT, normal glucose tolerance; DM, diabetes mellitus.

aAverage ranks to be significantly different at P<0.05 by Kruskal-Wallis test among the three groups.

Table 5
The proportion of each study group exceeding the recommended fat intake
dmj-35-354-i005.jpg

Values are presented as number (%).

aProportions to be significantly different at P<0.05 by chi-square test among the three groups.

Table 6
Antepartum metabolic characteristics of women with gestational diabetes according to postpartum glucose tolerance status
dmj-35-354-i006.jpg

Values are presented as median (interquartile range).

NGT, normal glucose tolerance; DM, diabetes mellitus; HbA1c, glycated hemoglobin; TC, total cholesterol; HDL-C, high density lipoprotein cholesterol; LDL-C, low density lipoprotein cholesterol; TG, triglyceride; hs-CRP, high-sensitivity C-reactive protein; SBP, systolic blood pressure; DBP, diastolic blood pressure.

aAverage ranks to be significantly different at P<0.001, bAverage ranks at P<0.05 by Kruskal-Wallis test among the three groups.

Table 7
Metabolic characteristics of women with gestational diabetes at 6 to 12 weeks postpartum
dmj-35-354-i007.jpg

Values are presented as median (interquartile range).

NGT, normal glucose tolerance; DM, diabetes mellitus; BMI, body mass index; HbA1c, glycated hemoglobin; TC, total cholesterol; HDL-C, high density lipoprotein cholesterol; LDL-C, low density lipoprotein cholesterol; TG, triglyceride; hs-CRP, high-sensitivity C-reactive protein; SBP, systolic blood pressure; DBP, diastolic blood pressure.

aAverage ranks to be significantly different at P<0.05, bAverage ranks at P<0.001 by Kruskal-Wallis test among the three groups.

Figure & Data

References

    Citations

    Citations to this article as recorded by  
    • Intuitive eating is associated with weight and glucose control during pregnancy and in the early postpartum period in women with gestational diabetes mellitus (GDM): A clinical cohort study
      Dan Yedu Quansah, Justine Gross, Leah Gilbert, Celine Helbling, Antje Horsch, Jardena J. Puder
      Eating Behaviors.2019; 34: 101304.     CrossRef
    • Prevention of Diabetes after Gestational Diabetes: Better Translation of Nutrition and Lifestyle Messages Needed
      Sharleen O'Reilly
      Healthcare.2014; 2(4): 468.     CrossRef
    • Gestational Diabetes Mellitus in Korean Women: Similarities and Differences from Other Racial/Ethnic Groups
      Catherine Kim
      Diabetes & Metabolism Journal.2014; 38(1): 1.     CrossRef
    • A Study of Snack Consumption, Night-Eating Habits, and Nutrient Intake in Gestational Diabetes Mellitus
      Hee-jin Park, JinJu Lee, Ji-Myung Kim, Hyun Ah Lee, Sung-Hoon Kim, Yuri Kim
      Clinical Nutrition Research.2013; 2(1): 42.     CrossRef
    • Risk Factors for Gestational Diabetes Mellitus in a Large Population of Women Living in Spain: Implications for Preventative Strategies
      Ana M. Ramos-Leví, Natalia Pérez-Ferre, M. Dolores Fernández, Laura del Valle, Elena Bordiu, Ana Rosa Bedia, Miguel A. Herraiz, M. José Torrejón, Alfonso L. Calle-Pascual
      International Journal of Endocrinology.2012; 2012: 1.     CrossRef
    • The Influence of Ethnicity on the Development of Type 2 Diabetes Mellitus in Women with Gestational Diabetes: A Prospective Study and Review of the Literature
      Christian M. Girgis, Jenny E. Gunton, N. Wah Cheung
      ISRN Endocrinology.2012; 2012: 1.     CrossRef
    • Low Density Lipoprotein Cholesterol Target Goal Attainment Rate in Korean Patients with Diabetes
      Eun Hae Lee, Chul Woo Ahn
      Diabetes & Metabolism Journal.2011; 35(6): 578.     CrossRef

    • PubReader PubReader
    • Cite this Article
      Cite this Article
      export Copy Download
      Close
      Download Citation
      Download a citation file in RIS format that can be imported by all major citation management software, including EndNote, ProCite, RefWorks, and Reference Manager.

      Format:
      • RIS — For EndNote, ProCite, RefWorks, and most other reference management software
      • BibTeX — For JabRef, BibDesk, and other BibTeX-specific software
      Include:
      • Citation for the content below
      A Comparative Study of Eating Habits and Food Intake in Women with Gestational Diabetes according to Early Postpartum Glucose Tolerance Status
      Diabetes Metab J. 2011;35(4):354-363.   Published online August 31, 2011
      Close
    • XML DownloadXML Download
    A Comparative Study of Eating Habits and Food Intake in Women with Gestational Diabetes according to Early Postpartum Glucose Tolerance Status
    A Comparative Study of Eating Habits and Food Intake in Women with Gestational Diabetes according to Early Postpartum Glucose Tolerance Status
    Table 1 Clinical characteristics and life style of women with gestational diabetes according to postpartum glucose tolerance status

    Values are presented as median (interquartile range) or number (%).

    NGT, normal glucose tolerance; DM, diabetes mellitus; BMI, body mass index.

    aAverage ranks to be significantly different at P<0.05 by Kruskal-Wallis test, bProportions at P<0.001 by chi-square test among the three groups.

    Table 2 Eating habits of women with gestational diabetes according to postpartum glucose tolerance status

    Values are presented as number (%) or median (interquartile range).

    There are no significantly different values for any parameter.

    NGT, normal glucose tolerance; DM, diabetes mellitus.

    Table 3 Daily nutrient intakes of women with gestational diabetes according to postpartum glucose tolerance status

    Values are presented as median (interquartile range).

    NGT, normal glucose tolerance; DM, diabetes mellitus.

    aAverage ranks to be significantly different at P<0.05 by Kruskal-Wallis test among the three groups.

    Table 4 Recommended and actual intake ratios of protein, fat, and carbohydrates in women with gestational diabetes according to postpartum glucose tolerance status

    Values are presented as median (interquartile range).

    NGT, normal glucose tolerance; DM, diabetes mellitus.

    aAverage ranks to be significantly different at P<0.05 by Kruskal-Wallis test among the three groups.

    Table 5 The proportion of each study group exceeding the recommended fat intake

    Values are presented as number (%).

    aProportions to be significantly different at P<0.05 by chi-square test among the three groups.

    Table 6 Antepartum metabolic characteristics of women with gestational diabetes according to postpartum glucose tolerance status

    Values are presented as median (interquartile range).

    NGT, normal glucose tolerance; DM, diabetes mellitus; HbA1c, glycated hemoglobin; TC, total cholesterol; HDL-C, high density lipoprotein cholesterol; LDL-C, low density lipoprotein cholesterol; TG, triglyceride; hs-CRP, high-sensitivity C-reactive protein; SBP, systolic blood pressure; DBP, diastolic blood pressure.

    aAverage ranks to be significantly different at P<0.001, bAverage ranks at P<0.05 by Kruskal-Wallis test among the three groups.

    Table 7 Metabolic characteristics of women with gestational diabetes at 6 to 12 weeks postpartum

    Values are presented as median (interquartile range).

    NGT, normal glucose tolerance; DM, diabetes mellitus; BMI, body mass index; HbA1c, glycated hemoglobin; TC, total cholesterol; HDL-C, high density lipoprotein cholesterol; LDL-C, low density lipoprotein cholesterol; TG, triglyceride; hs-CRP, high-sensitivity C-reactive protein; SBP, systolic blood pressure; DBP, diastolic blood pressure.

    aAverage ranks to be significantly different at P<0.05, bAverage ranks at P<0.001 by Kruskal-Wallis test among the three groups.

    Hwang YJ, Park BK, Park S, Kim SH. A Comparative Study of Eating Habits and Food Intake in Women with Gestational Diabetes according to Early Postpartum Glucose Tolerance Status. Diabetes Metab J. 2011;35(4):354-363.
    Received: Jul 12, 2010; Accepted: Dec 27, 2010
    DOI: https://doi.org/10.4093/dmj.2011.35.4.354.

    Diabetes Metab J : Diabetes & Metabolism Journal
    Close layer
    TOP