- Current
- Browse
- Collections
-
For contributors
- For Authors
- Instructions to authors
- Article processing charge
- e-submission
- For Reviewers
- Instructions for reviewers
- How to become a reviewer
- Best reviewers
- For Readers
- Readership
- Subscription
- Permission guidelines
- About
- Editorial policy
Articles
- Page Path
- HOME > Diabetes Metab J > Volume 38(5); 2014 > Article
-
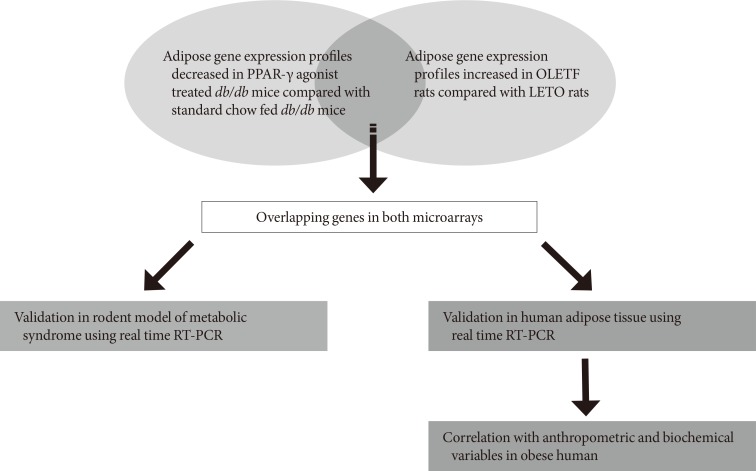
Original ArticleObesity and Metabolic Syndrome Adipose Gene Expression Profiles Related to Metabolic Syndrome Using Microarray Analyses in Two Different Models
- Hye Jin Yoo, Hwan-Jin Hwang, Tae Woo Jung, Ja Young Ryu, Ho Cheol Hong, Hae Yoon Choi, Sei Hyun Baik, Kyung Mook Choi
-
Diabetes & Metabolism Journal 2014;38(5):356-365.
DOI: https://doi.org/10.4093/dmj.2014.38.5.356
Published online: October 17, 2014
Division of Endocrinology and Metabolism, Department of Internal Medicine, Korea University College of Medicine, Seoul, Korea.
- Corresponding author: Kyung Mook Choi. Division of Endocrinology and Metabolism, Department of Internal Medicine, Korea University Guro Hospital, Korea University College of Medicine, 148 Gurodong-ro, Guro-gu, Seoul 152-703, Korea. medica7@korea.ac.kr
• Received: December 2, 2013 • Accepted: December 24, 2013
Copyright © 2014 Korean Diabetes Association
This is an Open Access article distributed under the terms of the Creative Commons Attribution Non-Commercial License (http://creativecommons.org/licenses/by-nc/3.0/) which permits unrestricted non-commercial use, distribution, and reproduction in any medium, provided the original work is properly cited.


Figure & Data
References
Citations
Citations to this article as recorded by 
- Lipocalin‐2—The myth of its expression and function
Dahui Li, Wai Yan Sun, Bowen Fu, Aimin Xu, Yu Wang
Basic & Clinical Pharmacology & Toxicology.2020; 127(2): 142. CrossRef - Lipocalin-2 counteracts metabolic dysregulation in obesity and diabetes
Ioanna Mosialou, Steven Shikhel, Na Luo, Peristera Ioanna Petropoulou, Konstantinos Panitsas, Brygida Bisikirska, Nyanza J. Rothman, Roxane Tenta, Bertrand Cariou, Matthieu Wargny, Elisabeth Sornay-Rendu, Thomas Nickolas, Mishaela Rubin, Cyrille B. Confav
Journal of Experimental Medicine.2020;[Epub] CrossRef - Metabolism and adult neurogenesis: Towards an understanding of the role of lipocalin-2 and iron-related oxidative stress
Ana Catarina Ferreira, Nuno Sousa, João M. Bessa, João Carlos Sousa, Fernanda Marques
Neuroscience & Biobehavioral Reviews.2018; 95: 73. CrossRef - LH-21, A Peripheral Cannabinoid Receptor 1 Antagonist, Exerts Favorable Metabolic Modulation Including Antihypertensive Effect in KKAy Mice by Regulating Inflammatory Cytokines and Adipokines on Adipose Tissue
Ziqi Dong, Hui Gong, Yadan Chen, Hong Wu, Jun Wu, Yinghong Deng, Xinmao Song
Frontiers in Endocrinology.2018;[Epub] CrossRef - Lipocalin 2 produces insulin resistance and can be upregulated by glucocorticoids in human adipose tissue
Prasad G. Kamble, Maria J. Pereira, Cherno O. Sidibeh, Sam Amini, Magnus Sundbom, Joey Lau Börjesson, Jan W. Eriksson
Molecular and Cellular Endocrinology.2016; 427: 124. CrossRef - Serum lipocalin-2 levels are positively associated with not only total body fat but also visceral fat area in Chinese men
Yuqi Luo, Xiaojing Ma, Xiaoping Pan, Yiting Xu, Qin Xiong, Yunfeng Xiao, Yuqian Bao, Weiping Jia
Medicine.2016; 95(30): e4039. CrossRef - From the periphery to the brain: Lipocalin-2, a friend or foe?
Ana C. Ferreira, Sandro Dá Mesquita, João C. Sousa, Margarida Correia-Neves, Nuno Sousa, Joana A. Palha, Fernanda Marques
Progress in Neurobiology.2015; 131: 120. CrossRef
 PubReader
 Cite
Cite