
- Current
- Browse
- Collections
-
For contributors
- For Authors
- Instructions to authors
- Article processing charge
- e-submission
- For Reviewers
- Instructions for reviewers
- How to become a reviewer
- Best reviewers
- For Readers
- Readership
- Subscription
- Permission guidelines
- About
- Editorial policy
Articles
- Page Path
- HOME > Diabetes Metab J > Ahead-of print > Article
-
Original ArticleType 1 Diabetes Optimal Coefficient of Variance Threshold to Minimize Hypoglycemia Risk in Individuals with Well-Controlled Type 1 Diabetes Mellitus
-
Jee Hee Yoo1,2
 , Seung Hee Yang3, Sang-Man Jin3, Jae Hyeon Kim3,4
 -
DOI: https://doi.org/10.4093/dmj.2023.0083
Published online: March 4, 2024
- 555 Views
- 22 Download
1Division of Endocrinology and Metabolism, Department of Medicine, Yonsei University Wonju College of Medicine, Wonju, Korea
2Division of Endocrinology and Metabolism, Department of Medicine, Chung-Ang University Gwangmyeong Hospital, Chung-Ang University College of Medicine, Gwangmyeong, Korea
3Division of Endocrinology and Metabolism, Department of Medicine, Samsung Medical Center, Sungkyunkwan University School of Medicine, Seoul, Korea
4Department of Clinical Research Design and Evaluation, Samsung Advanced Institute for Health Sciences & Technology, Sungkyunkwan University, Seoul, Korea
- Corresponding author: Jae Hyeon Kim https://orcid.org/0000-0001-5001-963X Division of Endocrinology and Metabolism, Department of Medicine, Samsung Medical Center, Sungkyunkwan University School of Medicine, 81 Irwon-ro, Gangnam-gu, Seoul 06351, Korea E-mail: jaehyeon@skku.edu
Copyright © 2024 Korean Diabetes Association
This is an Open Access article distributed under the terms of the Creative Commons Attribution Non-Commercial License (http://creativecommons.org/licenses/by-nc/4.0/) which permits unrestricted non-commercial use, distribution, and reproduction in any medium, provided the original work is properly cited.
ABSTRACT
-
Background
- This study investigated the optimal coefficient of variance (%CV) for preventing hypoglycemia based on real-time continuous glucose monitoring (rt-CGM) data in people with type 1 diabetes mellitus (T1DM) already achieving their mean glucose (MG) target.
-
Methods
- Data from 172 subjects who underwent rt-CGM for at least 90 days and for whom 439 90-day glycemic profiles were available were analyzed. Receiver operator characteristic analysis was conducted to determine the cut-off value of %CV to achieve time below range (%TBR)< 54mg/dL <1 and =0.
-
Results
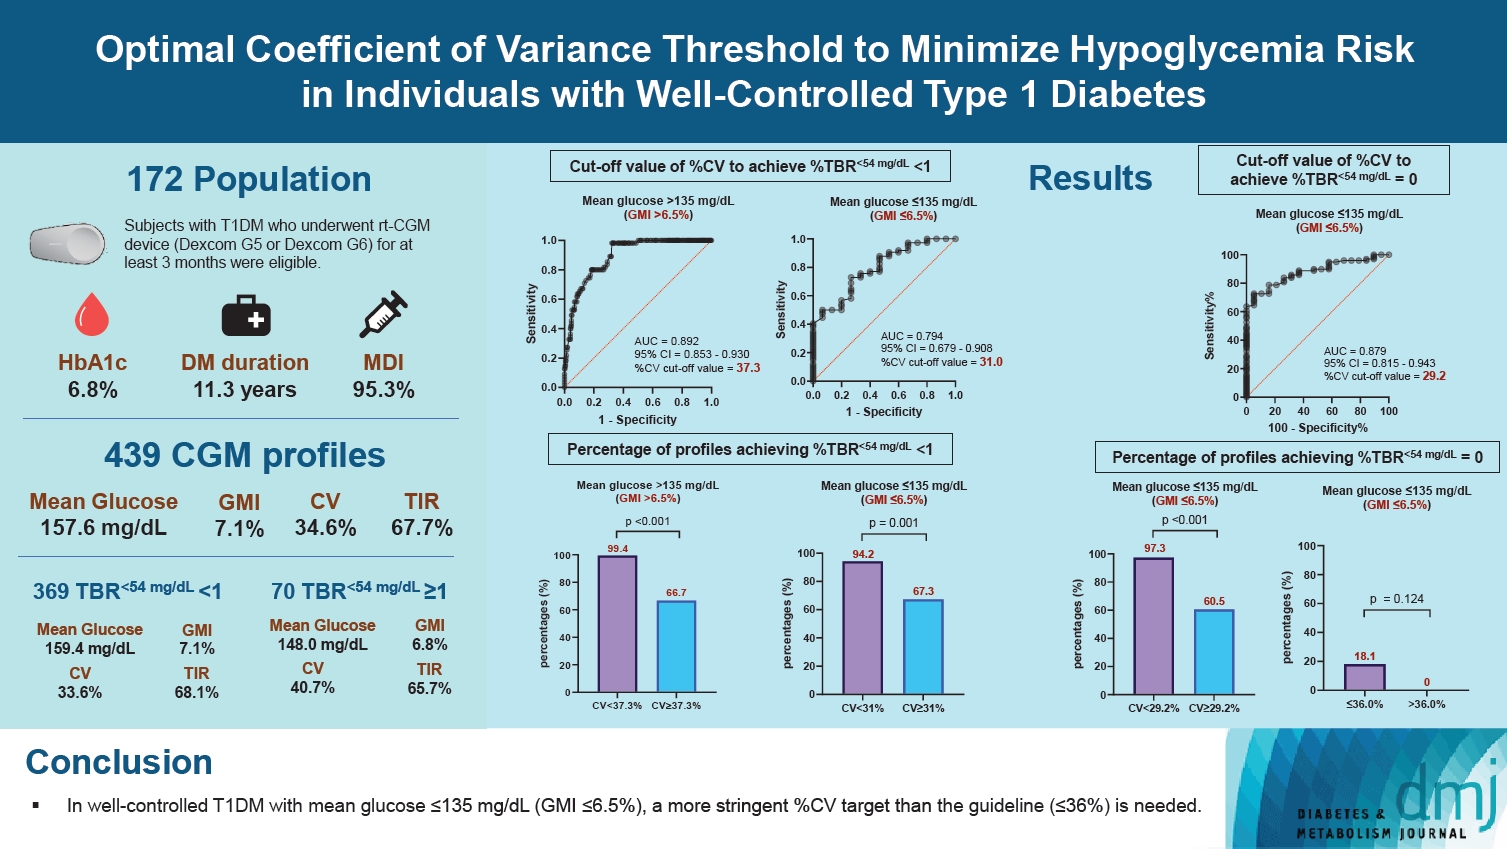
- Overall mean glycosylated hemoglobin was 6.8% and median %TBR< 54mg/dL was 0.2%. MG was significantly higher and %CV significantly lower in profiles achieving %TBR< 54mg/dL <1 compared to %TBR< 54mg/dL ≥1 (all P<0.001). The cut-off value of %CV for achieving %TBR< 54mg/dL <1 was 37.5%, 37.3%, and 31.0%, in the whole population, MG >135 mg/dL, and ≤135 mg/dL, respectively. The cut-off value for %TBR< 54mg/dL=0% was 29.2% in MG ≤135 mg/dL. In profiles with MG ≤135 mg/dL, 94.2% of profiles with a %CV <31 achieved the target of %TBR< 54mg/dL <1, and 97.3% with a %CV <29.2 achieved the target of %TBR<54 mg/ dL=0%. When MG was >135 mg/dL, 99.4% of profiles with a %CV <37.3 achieved %TBR< 54mg/dL <1.
-
Conclusion
- In well-controlled T1DM with MG ≤135 mg/dL, we suggest a %CV <31% to achieve the %TBR< 54mg/dL <1 target. Furthermore, we suggest a %CV <29.2% to achieve the target of %TBR< 54mg/dL =0 for people at high risk of hypoglycemia.
Highlights
- Hypoglycemia is a well-known contributing factor to cardiovascular complications and increased risk of mortality [1,2]. Unfortunately, in the Diabetes Control and Complications Trial (DCCT), increased risk of hypoglycemia was observed more frequently in the intensive therapy group than the less well-controlled group of individuals with type 1 diabetes mellitus (T1DM) [3]. Individuals with T1DM are often hesitant to intensify treatment to approach the target glycosylated hemoglobin (HbA1c) level due to a fear of hypoglycemia, despite knowing that chronic hyperglycemia contributes to the development of micro- and macro-complications [3-5].
- Since the emergence of continuous glucose monitoring (CGM), a comprehensive picture of an individual’s glycemic status is obtainable [6]. This has allowed individuals with T1DM to use insulin more flexibly than before. CGM can be used to assess hypoglycemia and glycemic variability reliably and accurately [7-9]. Reducing glycemic variability between peaks and nadirs and keeping the glucose range flat and narrow are now considered key aspects of optimized glycemic control, especially in individuals with T1DM whose glucose level depends on insulin treatment [10].
- Coefficient of variance (%CV) is a metric that can be used to assess glycemic variability based on an international consensus of CGM [11,12]. These experts suggested a %CV of 36% as a cut-off value to identify persons at high risk of hypoglycemia and 33% for those receiving insulin or sulfonylureas without considering mean glucose (MG) status [6]. Based on evaluation of 200 24-hour short-term glycemic profiles, Monnier et al. [13] suggested a target %CV of 34% to minimize hypoglycemic events when the MG level was ≤140 mg/dL (7.8 mmol/L) in individuals with T1DM; however, the same study reported time below range (%TBR)<54 mg/dL of up to 8% even with a %CV <34% for MG <140 mg/dL. These findings suggest that a stringent %CV threshold for low MG status is needed.
- In addition, advancements in technology in combination with structured education have resulted in an increase in the number of individuals with T1DM with an extremely low HbA1c without hypoglycemia [14-17]. Thus, it is important to determine the cut-off %CV value that protects against hypoglycemia in these individuals, as this is likely to be different from the previously recommended thresholds.
- Here, we evaluated the optimal %CV threshold needed to achieve a target of level 2 hypoglycemia (%TBR<54 mg/dL <1 and %TBR<54 mg/dL=0) with a focus on low MG levels in individuals with T1DM based on analysis of 3-month long-term CGM data.
INTRODUCTION
- Study design and participants
- This extension of a previous study [18] was a single-center, prospective, observational cohort study of real-time continuous glucose monitoring (rt-CGM) users recruited at the Division of Endocrinology and Metabolism of Samsung Medical Center (SMC) from April 2019 to February 2022. All subjects provided written informed consent during their initial visit. In accordance with the ethical guidelines of the Declaration of Helsinki and Korean Good Clinical Practice, the Institutional Review Board of SMC approved this study (IRB No. 2018-07-132-009).
- Major eligibility criteria were age ≥18 years with T1DM and 5% (31 mmol/mol)≤ HbA1c <10% (86 mmol/mol). Supplementary Fig. 1 provides detailed information about the inclusion and exclusion criteria.
- Data collection
- Subjects were asked to wear an rt-CGM device (Dexcom G5 or Dexcom G6, Dexcom, San Diego, CA, USA) during their initial visit and were followed for at least 3 months, with in-clinic visits every 3 months. Subjects visited from a minimum of once to a maximum of four times. At every visit, blood samples were collected including HbA1c measurement, and CGM data were uploaded. CGM-derived metrics for the 3 months before each HbA1c measurement were compared with the HbA1c based on those 3-month measurements. Overall, 172, 126, 83, and 56 cases of CGM data were collected at visits 1, 2, 3, and 4, respectively. Thus, we collected 439 cases of 3-month CGM data that coincided with HbA1c data collection times.
- At the baseline visit, education was offered about device handling and the twice-a-day calibration measurements required by the Dexcom G5, and medical information was collected from each patient’s electronic health records.
- Statistical analysis
- For data from subjects to be included in the analyses, at least 90 days of consecutive CGM wear and sensor wear time ≥70% was required based on previous guidelines [6]. Mean±standard deviation or median (interquartile range [IQR]) were used to summarize continuous variables while percentages were used to summarize categorical variables. For comparisons, Student’s t-test and one-way analysis of variance (ANOVA) with the Tukey method were performed for normally distributed variables, while Mann-Whitney U tests and Jonckheere-Terpstra tests were performed for skewed distributed continuous variables. Chi-square test with Fisher’s exact test was used for categorical data. Spearman correlation coefficients were used to evaluate the association between %TBR<54 mg/dL and %CV or MG. Univariable and multiple logistic regression analyses were performed to investigate the association between %CV and hypoglycemia (%TBR<54 mg/dL <1) while adjusting for confounding factors that affect hypoglycemia (Supplementary Table 1).
- Well-controlled diabetes was defined as MG ≤135 mg/dL (glucose management indicator [GMI] ≤6.5%), because a target of GMI 6.5% or less was shown to prevent major vascular outcomes including nephropathy in type 2 diabetes mellitus (T2DM) [4,19]. Another reason is that with the advancements in insulin delivery systems and education, recent randomized controlled trials conducted on individuals with T1DM have shown a decrease in HbA1c levels of up to 6.5% without experiencing hypoglycemia [17,20]. Cut-off values of %CV to achieve %TBR<54 mg/dL <1 and %TBR<54 mg/dL=0 were determined by receiver operator characteristic (ROC) curve analysis and the Youden Index. The published GMI equation was used to calculate the GMI from the CGM-derived MG [21].
- Significance of differences among groups was established on the basis of a two-tailed 0.05 significance level. SPSS software version 28.0 (IBM Co., Armonk, NY, USA) was used to execute all statistical analyses.
METHODS
- Baseline characteristics of the study population
- Baseline characteristics of the 172 subjects are presented in Table 1. Of the study population, 45.3% (n=78) were men. Mean age was 44.5±15.4 years, and duration of diabetes was 11.3±9.7 years. Mean HbA1c values were 7.4% (57 mmol/mol), 6.9% (52 mmol/mol), 6.8% (51 mmol/mol), 6.7% (50 mmol/mol), and 6.6% (49 mmol/mol) at baseline, 3, 6, 9, and 12 months, respectively. Among subjects, 95.3% (n=164) used multiple daily insulin treatments, and 4.7% (n=8) used insulin pumps. Baseline characteristics according to the MG of 135 mg/dL during the first 3 months of CGM wear are summarized in Supplementary Table 2.
- Glycemic profiles according to %CV quintiles
- Glycemic profiles based on %CV quintiles are summarized in Table 2: quintile 1 (16.0%–29.4%), quintile 2 (29.5%–33.3%), quintile 3 (33.4%–36.2%), quintile 4 (36.3%–39.7%), and quintile 5 (39.8%–52.3%). In the population as a whole (172 subjects, 439 cases), mean HbA1c was 6.8% (51 mmol/mol), and %CV was 34.6%. Mean HbA1c was 6.2% (44 mmol/mol), 6.5% (48 mmol/mol), 7.0% (53 mmol/mol), 7.1% (54 mmol/mol), and 7.0%, in %CV groups 1, 2, 3, 4, and 5, respectively. Hypoglycemic metrics (%TBR<70 mg/dL, %TBR<54 mg/dL) exponentially increased as %CV increased (all P for trend <0.001). In the lowest %CV group (<29.5%), the mean time in range (%TIR70-180 mg/dL), time above range (%TAR>180 mg/dL), and median %TBR<70 mg/dL were 85.3%, 13.4%, and 0.6%, respectively, all reaching the target goals [6]. In contrast, in the highest %CV group (≥39.8%), the %TIR70-180 mg/dL, %TAR>180 mg/dL, and median %TBR<70 mg/dL were 57.2%, 37.8%, and 4.2%, none of which met the targets. In addition, though %CV quintile groups 3 and 5 had the same mean HbA1c, %CV quintile group 3 had profiles with a higher %TIR70-180 mg/dL and lower %TBR<54 mg/dL than %CV quintile group 5. Glycemic profiles according to %CV quintiles in profiles with MG >135 mg/dL and in profiles with MG ≤135 mg/dL are presented in Supplementary Table 3. Regardless of MG status, %TIR70-180 mg/dL (P for trend <0.001) tended to increase with %CV increases and %TAR>180 mg/dL, %TAR>250 mg/dL, %TBR<70 mg/dL, and %TBR<54 mg/dL also increased with %CV increases. However, GMI and MG increased with %CV increases only in profiles with MG ≤135 mg/dL (all P for trend <0.001); in profiles with MG >135 mg/dL, GMI and MG were similar irrespective of %CV status.
- Comparison of characteristics and glycemic profiles according to achievement of %TBR<54 mg/dL <1
- Profiles of %TBR<54 mg/dL <1 (n=369) and %TBR<54 mg/dL ≥1 (n=70) are presented in Table 3. Median %TBR<54 mg/dL was 0.2 (IQR, 0.1 to 0.7), 0.2 (IQR, 0.1 to 0.4), and 1.6 (IQR, 1.2 to 2.5) for all glycemic profiles, %TBR<54 mg/dL <1 profiles, and %TBR<54 mg/dL ≥1 profiles, respectively (P<0.001). CGM profiles with %TBR <54 mg/dL ≥1 were more likely to have lower MG (148.0±22 mg/dL vs. 159.4±31.0 mg/dL [8.2±1.2 mmol/L vs. 8.8±1.7 mmol/L], P<0.001), and higher %CV (40.7±5.3 vs. 33.6±5.4, P< 0.001), but %TIR70-180 mg/dL and %TAR>250 mg/dL did not differ between the two groups. A comparison of glycemic profiles according to achievement of %TBR<54 mg/dL <1 in MG ≤135 mg/dL and MG >135 mg/dL profiles is provided in Supplementary Table 4. In profiles with MG >135 mg/dL, the %TBR <54 mg/dL <1 group had a significantly higher MG (171.7±26.7 vs. 158.3±17.2, P<0.001) and lower %CV (35.1±5.0 vs. 42.7±3.9, P<0.001), but %TIR did not differ between the two groups, similar to the whole population. In contrast, in profiles with MG ≤135 mg/dL, there were no significant differences in MG between the groups but the %TBR<54 mg/dL <1 group had a significantly lower %CV (29.3±4.1 vs. 35.8±5.3, P<0.001) and higher %TIR70-180 mg/dL (88.5±5.4 vs. 79.3±6.7, P<0.001) indicating that %CV is more important than MG in achieving %TBR<54 mg/dL <1 when MG is near normal.
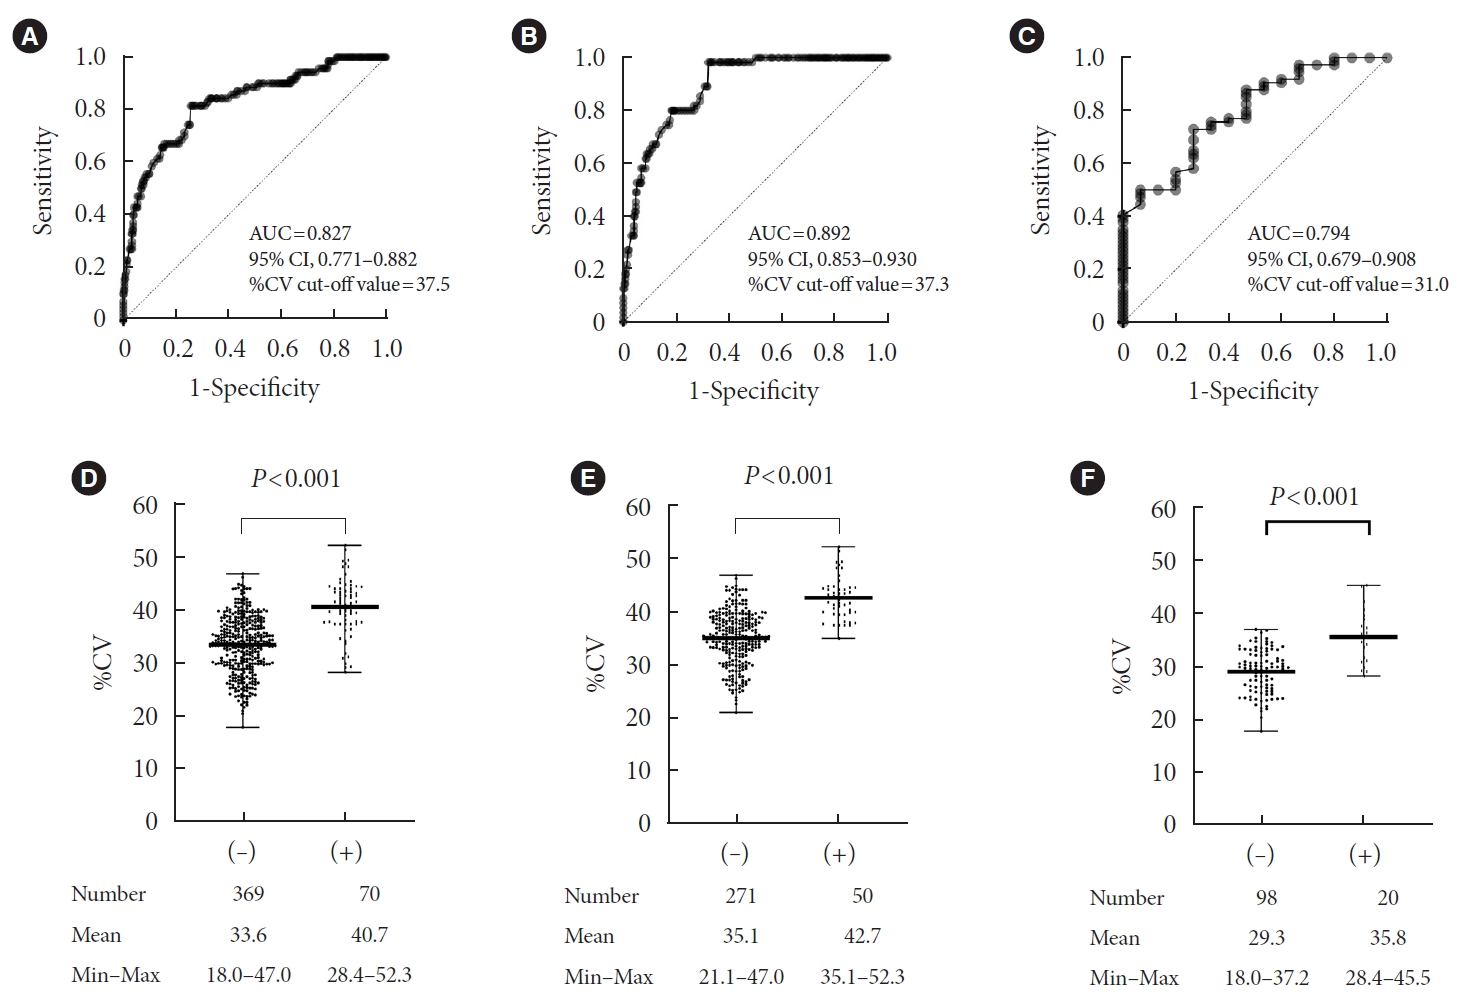
- Cut-off value of %CV to achieve %TBR<54 mg/dL <1 according to MG status
- %TBR<54 mg/dL correlated with MG (Spearman correlation coefficient, r=–0.161, P<0.001) and %CV (Spearman correlation coefficient, r=0.618, P<0.001). We used ROC curve analysis to determine the %CV cut-off value for %TBR<54 mg/dL <1 (Fig. 1). For the whole population, the %CV cut-off value was 37.5% (area under the curve [AUC]=0.827; 95% confidence interval [CI], 0.771 to 0.882; sensitivity 0.8, specificity 0.7) (Fig. 1A). The %CV cut-off value in profiles with MG >135 mg/dL (7.5 mmol/L) (GMI >6.5%) of 37.3% was similar to that for the whole population (AUC=0.892; 95% CI, 0.853 to 0.930; sensitivity 0.9, specificity 0.7) (Fig. 1B). A scatter plot of %CV according to %TBR<54 mg/dL <1 achievement status is provided in Fig. 1. As shown in Fig. 1E, there was no value lower than 35.1% in the %TBR<54 mg/dL ≥1 group with MG >135 mg/dL. In glycemic profiles with MG of 135 mg/dL or below, the %CV cut-off value was 31.0% (AUC=0.794; 95% CI, 0.679 to 0.908; sensitivity 0.8, specificity 0.7) (Fig. 1C), indicating that well-controlled profiles need a lower %CV to protect against hypoglycemia. Sensitivity analyses were performed excluding profiles with a sensor wear time of less than 85% with MG of 135 mg/dL or below; the cut-off value remained 31.0%, the same as with a sensor wear time above 70% (Supplementary Fig. 2).
- Furthermore, we examined whether groups assigned based on the %CV cut-off value from ROC analysis showed significant differences in the incidence of hypoglycemia (Fig. 2). The population was divided into two groups according to MG (≤135 mg/dL [n=118] and >135 mg/dL [n=321]). In profiles with MG ≤135 mg/dL, a significantly larger proportion of profiles with a %CV <31.0% achieved %TBR<54 mg/dL <1 compared with glycemic profiles with a %CV ≥31.0% (94.2% vs. 67.3%, P=0.001) (Fig. 2A). The median value of %TBR<54 mg/dL was also significantly higher in profiles with a %CV<31% compared to profiles with a %CV ≥31.0% (0.2% vs. 0.7%, P<0.001) (Fig. 2B). In profiles with MG >135 mg/dL, nearly all profiles achieved %TBR<54 mg/dL <1 (99.4% vs. 66.7%, P<0.001) (Fig. 2C) and it was significantly higher in profiles with a %CV <37.3% than a %CV ≥37.3%, while the value of %TBR<54 mg/dL (0.1% vs. 0.7%, P<0.001) (Fig. 2D) was significantly lower in profiles with a %CV<37.3%.
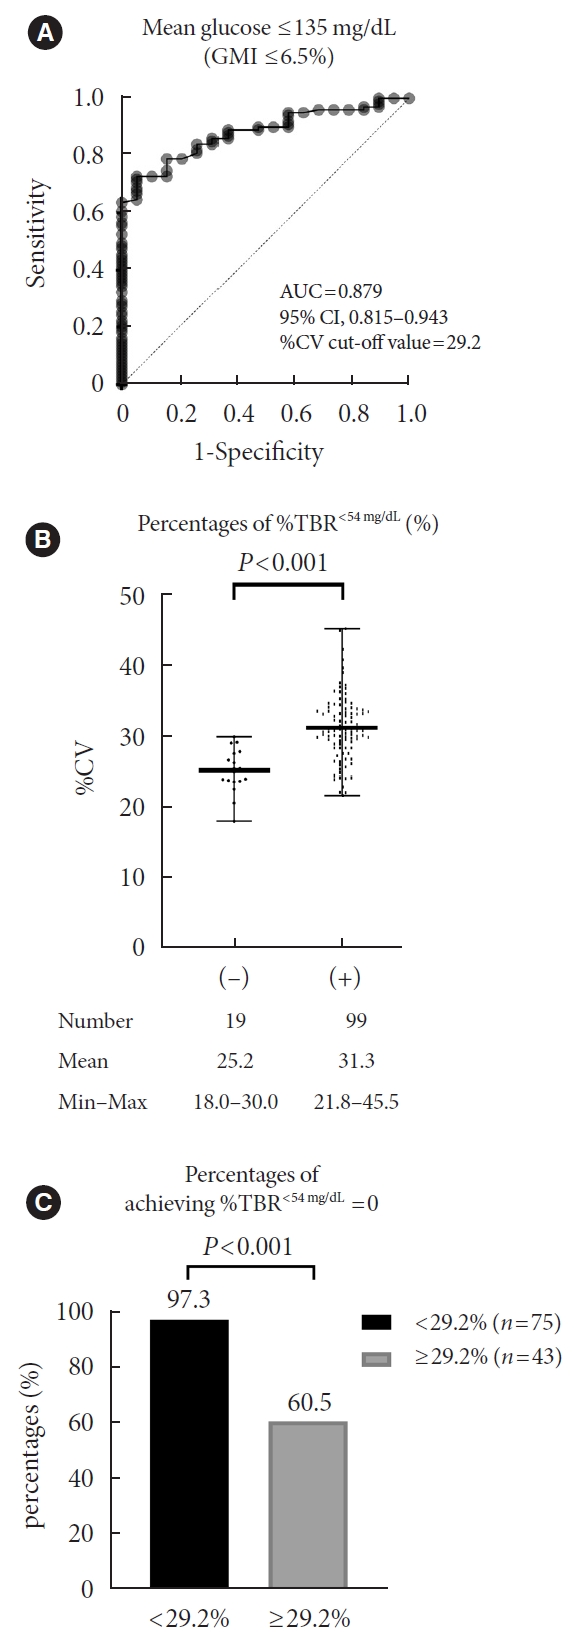
- Cut-off value of %CV to achieve %TBR<54 mg/dL=0 in glycemic profiles with MG ≤135 mg/dL
- For persons with high risk of hypoglycemia, we also used ROC curve analysis to determine the %CV cut-off value to nearly eliminate %TBR<54 mg/dL in well-controlled diabetes with MG of 135 mg/dL or below (Fig. 3). The %CV cut-off value was 29.2% (AUC=0.879; 95% CI, 0.815 to 0.943; sensitivity 0.7, specificity 0.9). Nearly all profiles (97.3%) achieved %TBR<54 mg/dL=0 when %CV was below 29.2%.
- Cut-off value of %CV to achieve %TBR<70 mg/dL <4 according to MG status
- %TBR<70 mg/dL correlates more with MG (Spearman correlation coefficient, r=–0.355, P<0.001) and less with a %CV (Spearman correlation coefficient, r=0.536, P<0.001) when compared to %TBR<54 mg/dL. We also analyzed the %CV cut-off value for %TBR<70 mg/dL <4 and the percentage of profiles achieving the target with a cut-off value from the ROC curve (Supplementary Figs. 3 and 4). In profiles with MG >135 mg/dL, the cut-off value was 37.2% (AUC=0.879; 95% CI, 0.839 to 0.920; sensitivity 0.9, specificity 0.7), which was similar to the %TBR<54 mg/dL <1 target. The majority of profiles with a %CV <37.2% achieved %TBR<70 mg/dL <4 (97.7%). In profiles with MG ≤135 mg/dL, the %CV cut-off value was 33.8% (sensitivity 0.5, specificity 0.9), higher than the cut-off value for %TBR<54 mg/dL <1. However, the AUC was lower (AUC=0.755; 95% CI, 0.658 to 0.852 vs. AUC=0.794; 95% CI, 0.679 to 0.908), when compared to the target of %TBR<54 mg/dL <1. A significantly larger proportion of profiles with a %CV <33.8% achieved %TBR<70 mg/dL <4 compared with glycemic profiles with a %CV ≥33.8% (79.1% vs. 25.9%, P=0.001). However, 20% of profiles still did not meet the target with a %CV of 33.8%.
- Percentage of profiles achieving the target according to the %CV current guideline (36%)
- Furthermore, we analyzed the percentage of profiles achieving the target of %TBR<70 mg/dL <4, %TBR<54 mg/dL <1, and %TBR< 54 mg/dL=0 according to a %CV of 36% as the current guideline suggests (Supplementary Fig. 5). In profiles with MG ≤135 mg/dL, profiles with a %CV below 31.0%, the %CV cut-off value from our study, achieved %TBR<54 mg/dL <1 more than those with a %CV ≤36.0% (94.2% vs. 90.5%). In addition, only 18.1% of profiles with a %CV ≤36.0% achieved %TBR<54 mg/dL =0, compared to 97.4% of profiles with a %CV below 29.2%, our suggested cut-off value to ensure a very low risk of hypoglycemia.
RESULTS
- This large, cohort-based, prospective observational study of 439 glycemic profiles from individuals with well-controlled T1DM yielded several notable findings. Profiles with hypoglycemia (%TBR<54 mg/dL ≥1) were likely to have lower MG and a higher %CV without a significant difference in %TIR70-180 mg/dL than profiles with %TBR<54 mg/dL <1. In profiles with MG ≤135 mg/dL (GMI ≤6.5%), nearly 95% of profiles achieved %TBR<54 mg/dL <1, when the %CV was lower than 31% than when it was ≥31%. When the cut-off value of 29.2% was used, 97.3% of profiles with MG ≤135 mg/dL achieved %TBR<54 mg/dL=0. In glycemic profiles with MG >135 mg/dL, nearly all profiles with a %CV below 37.3% achieved %TBR<54 mg/dL <1.
- Current international guidelines for CGM recommend that the %CV be 36% or lower based on the finding that individuals with T2DM treated by diet or insulin sensitizers alone did not have a CV that exceeded 36% [6,22]. The study showed a significantly higher incidence of hypoglycemic events in people with T1DM with a %CV >36 than in individuals with a %CV ≤36% [22]. However, the threshold of 36% from the study did not consider MG status. Monnier et al. [13] considered MG status in their analysis of 200 24-hour short-term glycemic profiles and suggested a %CV of 34% to minimize hypoglycemic events when MG level was ≤140 mg/dL in individuals with T1DM. However, the study sample was small and CGM was only conducted for 24 hours. It also should be noted that the study reported %TBR<54 mg/dL of up to 8% even with a %CV <34% for MG <140 mg/dL [13]. These results indicate that even though the study suggested a stringent %CV threshold for profiles with MG below 140 mg/dL, such a threshold would still leave those individuals with low MG levels vulnerable to hypoglycemia.
- We collected CGM data for 3 months rather than 24 hours to obtain more reliable results than the previous study [13], and found that a %CV cut-off value of 31% from ROC analysis for those with MG ≤135 mg/dL allowed more profiles to achieve %TBR<54 mg/dL <1. We demonstrated that nearly 95% of profiles with a %CV below 31% achieved the goal of %TBR<54 mg/dL. More profiles achieved the target compared to those with a %CV ≤36.0% (90.5%). Uemura et al. [23] found that a cut-off value of MG below 130 mg/dL (7.2 mmol/L) and a %CV less than 30.3% were required to maintain %TBR<54 mg/dL <1% in people with T2DM, which are similar thresholds to those identified in our study. Based on consideration of all these findings, we suggest a more stringent %CV than proposed previously. We recommend a %CV threshold of 31% as a more suitable target to ensure a low risk of hypoglycemia in individuals with well-controlled T1DM than the previously proposed %CV threshold of 36%.
- Several earlier studies demonstrated that lower MG is a hypoglycemic risk factor [8,13,24]. However, although a low MG level may be a risk factor for hypoglycemia, a low MG status without hypoglycemia can be achieved with structured education while using CGM, as we demonstrated in our previous studies of individuals with T1DM [16,18,25-27]. Indeed, the number of individuals with T1DM with low HbA1c without hypoglycemia is increasing [14-16]. At our diabetes center, we teach people who use CGMs to adjust their insulin doses flexibly based on detailed carbohydrate counting, correction doses, and trend arrow. This education eventually leads to good glycemic quality as shown in quintile 1 group in Table 2, showing mean GMI of 6.5%, and %CV of 26%. In addition, in a recently published study of people with T1DM who were instructed to use precise carbohydrate counting on a 12-week advanced hybrid closed-loop system, they simultaneously achieved HbA1c of 6.6% and mean %TBR<54 mg/dL of 0.5% [20]. Their mean %CV was 30.8%, which is similar to our suggestion of 31% CV in well-controlled diabetes. Thus, although the cut-off value of %CV below 31% in GMI ≤6.5% may have been a difficult goal to achieve in the past, education concomitant with technological developments that facilitate better glycemic quality in T1DM makes a goal of 31% a reasonable target [28].
- In our study, a notable finding is that the profiles with %CV <29.2% nearly all achieved the %TBR<54 mg/dL=0 in GMI ≤6.5%, in contrast to those with %CV ≤36%. In high-risk individuals requiring assistance, such as the elderly, who had a longer duration of diabetes and insulin therapy, and with a greater prevalence of hypoglycemia unawareness, the first priory target is eradicating hypoglycemia; thus, the target goal of %TBR<54 mg/dL is 0% rather than <1% [5,6]. Consequently, a threshold of 29.2% rather than 36% would be more suitable for individuals with diabetes who are at higher risk for severe hypoglycemia and in near-normal glycemic status.
- We evaluated the %CV cut-off value focusing on an MG level below 135 mg/dL, which corresponds to a GMI of 6.5%. An HbA1c of 6% to 7% (42 to 53 mmol/mol) is considered optimal for preventing the development of micro- and macro-complications [3-5]. In addition, we chose the target of %TBR<54 mg/dL to ensure a low risk of hypoglycemia because %TBR<54 mg/dL is a particularly important metric associated with increased risk of severe hypoglycemic events that can result in alterations in cognitive function [29], arrythmias [30], and even death [31].
- A notable strength of the current study is that we analyzed 439 cases of 3-month CGM data from a large cohort to analyze relationships among CGM metrics, in contrast to previous studies that used shorter time periods [13,32,33] or small sample sizes [13,34]. Second, to investigate the optimal %CV cut-off according to MG, we used rt-CGM data collected only on Dexcom G5 and G6 devices, which have a higher accuracy than other CGM devices [35,36]. To the best of our knowledge, this is the first study to suggest a %CV threshold to achieve a target %TBR<54 mg/dL <1 and %TBR<54 mg/dL=0 in persons with well-controlled T1DM.
- This study was performed in Korean adults, so it might not be generalizable to children or individuals of other ethnic backgrounds. In addition, as our population is from the largest Korean T1DM specialty clinic, the study population was different from other Korean tertiary referral hospitals [37]. There were too few profiles with high HbA1c, with 41.7% having HbA1c <6.5%. Therefore, the study population might not be representative of general Korean T1DM patients. However, since we obtained a lot of profiles with HbA1c below 6.5%, these made it possible to estimate the %CV cut-off value in well-controlled diabetes. There remains the possibility that different populations could have different glucose distributions than those measured in this study. The lack of more advanced devices such as automated insulin delivery systems or sensor-augmented pumps may also have affected glucose distributions. However, individuals in our study population were recruited at SMC, which has a structured, individualized education system [18].
- In conclusion, analyses of a large cohort of 439 glycemic profiles of individuals with T1DM suggested that the %CV threshold goal should differ, especially in lower MG status to prevent hypoglycemia as defined by %TBR<54 mg/dL. To achieve %TBR<54 mg/dL <1 in persons with well-controlled glycemic status who have MG ≤135 mg/dL (GMI ≤6.5%), we suggest a %CV less than 31%. We also suggest a %CV of 29.2% or below as an optimal cut-off value for persons at high risk of hypoglycemia.
DISCUSSION
SUPPLEMENTARY MATERIALS
Supplementary Table 1.
Supplementary Table 2.
Supplementary Table 3.
Supplementary Table 4.
Supplementary Fig. 1.
Supplementary Fig. 2.
Supplementary Fig. 3.
Supplementary Fig. 4.
Supplementary Fig. 5.
-
CONFLICTS OF INTEREST
Sang-Man Jin has been associate editor of the Diabetes & Metabolism Journal since 2022. He was not involved in the review process of this article. Otherwise, there was no conflict of interest.
-
AUTHOR CONTRIBUTIONS
Conception or design: J.H.Y., J.H.K.
Acquisition, analysis, or interpretation of data: J.H.Y., S.H.Y., S.M.J., J.H.K.
Drafting the work or revising: J.H.Y., S.M.J., J.H.K.
Final approval of the manuscript: J.H.Y., S.H.Y., S.M.J., J.H.K.
-
FUNDING
This work was supported by a grant from the Korean Medical Device Development Fund funded by the Korean government (Ministry of Science and ICT, Ministry of Trade, Industry and Energy, Ministry of Health & Welfare, Ministry of Food and Drug Safety) (RS-2022-00141116) and a 2020 Research Grant from the Gangwon branch of the Korean Endocrine Society (2020-51-0390).
NOTES
-
Acknowledgements
- None

| Characteristic | Total (n=172) |
|---|---|
| Age, yr | 44.6±15.4 |
| Sex | |
| Male | 78 (45.3) |
| Female | 94 (54.7) |
| Duration of diabetes, yr | 11.3±9.7 |
| BMI, kg/m2 | 22.9±3.2 |
| SBP, mm Hg | 119.8±14.8 |
| DBP, mm Hg | 68.1±10.2 |
| Laboratory-HbA1c, % | 7.4±1.4 |
| Laboratory-HbA1c, mmol/mol | 57±16 |
| Total cholesterol, mg/dL | 166.8±40.7 |
| HDL-C, mg/dL | 67.7±17.8 |
| LDL-C, mg/dL | 94.6±35.2 |
| Triglycerides, mg/dL | 70.0 (54.5–96.5) |
| eGFR, mL/min/1.73 m2 | 101.1±20.1 |
| Hemoglobin, g/dL | 13.5±1.7 |
| C-peptide, ng/mL | 0.05 (0.02–0.37) |
| Insulin delivery method | |
| MDI | 164 (95.3) |
| Insulin pump | 8 (4.7) |
| Total daily insulin dose, IU | 40.8±21.0 |
| Basal dose | 17.2±10.0 |
| Meal dose | 23.6±13.1 |
| Use of antidiabetic agentsa | 2 (1.2) |
Values are presented as mean±standard deviation, number (%), or median (interquartile range).
BMI, body mass index; SBP, systolic blood pressure; DBP, diastolic blood pressure; HbA1c, glycosylated hemoglobin; HDL-C, high-density lipoprotein cholesterol; LDL-C, low-density lipoprotein cholesterol; eGFR, estimated glomerular filtration rate; MDI, multiple daily insulin.
a Only two people used antidiabetic agents, one used metformin and the other used sodium glucose co-transporter 2 inhibitor.
- 1. Currie CJ, Peters JR, Tynan A, Evans M, Heine RJ, Bracco OL, et al. Survival as a function of HbA(1c) in people with type 2 diabetes: a retrospective cohort study. Lancet 2010;375:481-9.ArticlePubMed
- 2. Davis SN, Duckworth W, Emanuele N, Hayward RA, Wiitala WL, Thottapurathu L, et al. Effects of severe hypoglycemia on cardiovascular outcomes and death in the Veterans affairs diabetes trial. Diabetes Care 2019;42:157-63.ArticlePubMedPDF
- 3. Diabetes Control and Complications Trial Research Group, Nathan DM, Genuth S, Lachin J, Cleary P, Crofford O, et al. The effect of intensive treatment of diabetes on the development and progression of long-term complications in insulindependent diabetes mellitus. N Engl J Med 1993;329:977-86.ArticlePubMed
- 4. Laiteerapong N, Ham SA, Gao Y, Moffet HH, Liu JY, Huang ES, et al. The legacy effect in type 2 diabetes: impact of early glycemic control on future complications (The Diabetes & Aging Study). Diabetes Care 2019;42:416-26.PubMed
- 5. ElSayed NA, Aleppo G, Aroda VR, Bannuru RR, Brown FM, Bruemmer D, et al. 6. Glycemic targets: standards of care in diabetes-2023. Diabetes Care 2023;46(Suppl 1):S97-110.
- 6. Battelino T, Danne T, Bergenstal RM, Amiel SA, Beck R, Biester T, et al. Clinical targets for continuous glucose monitoring data interpretation: recommendations from the International Consensus on Time in Range. Diabetes Care 2019;42:1593-603.PubMedPMC
- 7. American Diabetes Association Professional Practice Committee. 6. Glycemic targets: standards of medical care in diabetes-2022. Diabetes Care 2022;45(Suppl 1):S83-96.ArticlePubMedPDF
- 8. Rodbard D. Glucose time in range, time above range, and time below range depend on mean or median glucose or HbA1c, glucose coefficient of variation, and shape of the glucose distribution. Diabetes Technol Ther 2020;22:492-500.ArticlePubMed
- 9. Jin SM, Kim TH, Bae JC, Hur KY, Lee MS, Lee MK, et al. Clinical factors associated with absolute and relative measures of glycemic variability determined by continuous glucose monitoring: an analysis of 480 subjects. Diabetes Res Clin Pract 2014;104:266-72.ArticlePubMed
- 10. American Diabetes Association Professional Practice Committee. 7. Diabetes technology: standards of medical care in diabetes- 2022. Diabetes Care 2022;45(Suppl 1):S97-112.ArticlePubMedPDF
- 11. Le Floch JP, Kessler L. Glucose variability: comparison of different indices during continuous glucose monitoring in diabetic patients. J Diabetes Sci Technol 2016;10:885-91.ArticlePubMedPMCPDF
- 12. Rodbard D. Clinical interpretation of indices of quality of glycemic control and glycemic variability. Postgrad Med 2011;123:107-18.ArticlePubMed
- 13. Monnier L, Wojtusciszyn A, Molinari N, Colette C, Renard E, Owens D. Respective contributions of glycemic variability and mean daily glucose as predictors of hypoglycemia in type 1 diabetes: are they equivalent? Diabetes Care 2020;43:821-7.ArticlePubMedPDF
- 14. Gerhardsson P, Schwandt A, Witsch M, Kordonouri O, Svensson J, Forsander G, et al. The SWEET project 10-year benchmarking in 19 countries worldwide is associated with improved HbA1c and increased use of diabetes technology in youth with type 1 diabetes. Diabetes Technol Ther 2021;23:491-9.ArticlePubMed
- 15. Foster NC, Beck RW, Miller KM, Clements MA, Rickels MR, DiMeglio LA, et al. State of type 1 diabetes management and outcomes from the T1D exchange in 2016-2018. Diabetes Technol Ther 2019;21:66-72.ArticlePubMedPMC
- 16. Yoo JH, Kim G, Lee HJ, Sim KH, Jin SM, Kim JH. Effect of structured individualized education on continuous glucose monitoring use in poorly controlled patients with type 1 diabetes: a randomized controlled trial. Diabetes Res Clin Pract 2022;184:109209.ArticlePubMed
- 17. Petrovski G, Al Khalaf F, Campbell J, Day E, Almajaly D, Hussain K, et al. Glycemic outcomes of advanced hybrid closed loop system in children and adolescents with type 1 diabetes, previously treated with multiple daily injections (MiniMed 780G system in T1D individuals, previously treated with MDI). BMC Endocr Disord 2022;22:80.ArticlePubMedPMCPDF
- 18. Yoo JH, Yang SH, Kim G, Kim JH. Glucose management indicator for people with type 1 Asian diabetes is different from that of the published equation: differences by glycated hemoglobin distribution. Diabetes Technol Ther 2021;23:745-52.ArticlePubMed
- 19. ADVANCE Collaborative Group; Patel A, MacMahon S, Chalmers J, Neal B, Billot L, et al. Intensive blood glucose control and vascular outcomes in patients with type 2 diabetes. N Engl J Med 2008;358:2560-72.ArticlePubMed
- 20. Petrovski G, Campbell J, Pasha M, Day E, Hussain K, Khalifa A, et al. Simplified meal announcement versus precise carbohydrate counting in adolescents with type 1 diabetes using the MiniMed 780G advanced hybrid closed loop system: a randomized controlled trial comparing glucose control. Diabetes Care 2023;46:544-50.ArticlePubMedPMCPDF
- 21. Bergenstal RM, Beck RW, Close KL, Grunberger G, Sacks DB, Kowalski A, et al. Glucose management indicator (GMI): a new term for estimating A1C from continuous glucose monitoring. Diabetes Care 2018;41:2275-80.ArticlePubMedPMCPDF
- 22. Monnier L, Colette C, Wojtusciszyn A, Dejager S, Renard E, Molinari N, et al. Toward defining the threshold between low and high glucose variability in diabetes. Diabetes Care 2017;40:832-8.ArticlePubMedPDF
- 23. Uemura F, Okada Y, Mita T, Torimoto K, Wakasugi S, Katakami N, et al. Risk factor analysis for type 2 diabetes patients about hypoglycemia using continuous glucose monitoring: results from a prospective observational study. Diabetes Technol Ther 2022;24:435-45.ArticlePubMed
- 24. Beck RW, Connor CG, Mullen DM, Wesley DM, Bergenstal RM. The fallacy of average: how using HbA1c alone to assess glycemic control can be misleading. Diabetes Care 2017;40:994-9.ArticlePubMedPMCPDF
- 25. Hopkins D, Lawrence I, Mansell P, Thompson G, Amiel S, Campbell M, et al. Improved biomedical and psychological outcomes 1 year after structured education in flexible insulin therapy for people with type 1 diabetes: the U.K. DAFNE experience. Diabetes Care 2012;35:1638-42.PubMedPMC
- 26. Heinemann L, Freckmann G, Ehrmann D, Faber-Heinemann G, Guerra S, Waldenmaier D, et al. Real-time continuous glucose monitoring in adults with type 1 diabetes and impaired hypoglycaemia awareness or severe hypoglycaemia treated with multiple daily insulin injections (HypoDE): a multicentre, randomised controlled trial. Lancet 2018;391:1367-77.ArticlePubMed
- 27. Oskarsson P, Antuna R, Geelhoed-Duijvestijn P, Kroger J, Weitgasser R, Bolinder J. Impact of flash glucose monitoring on hypoglycaemia in adults with type 1 diabetes managed with multiple daily injection therapy: a pre-specified subgroup analysis of the IMPACT randomised controlled trial. Diabetologia 2018;61:539-50.ArticlePubMedPDF
- 28. Beck RW, Bergenstal RM, Laffel LM, Pickup JC. Advances in technology for management of type 1 diabetes. Lancet 2019;394:1265-73.ArticlePubMed
- 29. van de Ven KC, Tack CJ, Heerschap A, van der Graaf M, de Galan BE. Patients with type 1 diabetes exhibit altered cerebral metabolism during hypoglycemia. J Clin Invest 2013;123:623-9.PubMedPMC
- 30. Novodvorsky P, Bernjak A, Chow E, Iqbal A, Sellors L, Williams S, et al. Diurnal differences in risk of cardiac arrhythmias during spontaneous hypoglycemia in young people with type 1 diabetes. Diabetes Care 2017;40:655-62.PubMed
- 31. Stahn A, Pistrosch F, Ganz X, Teige M, Koehler C, Bornstein S, et al. Relationship between hypoglycemic episodes and ventricular arrhythmias in patients with type 2 diabetes and cardiovascular diseases: silent hypoglycemias and silent arrhythmias. Diabetes Care 2014;37:516-20.ArticlePubMedPDF
- 32. Beck RW, Bergenstal RM, Cheng P, Kollman C, Carlson AL, Johnson ML, et al. The relationships between time in range, hyperglycemia metrics, and HbA1c. J Diabetes Sci Technol 2019;13:614-26.ArticlePubMedPMCPDF
- 33. Vigersky RA, McMahon C. The relationship of hemoglobin A1C to time-in-range in patients with diabetes. Diabetes Technol Ther 2019;21:81-5.ArticlePubMed
- 34. Addala A, Zaharieva DP, Gu AJ, Prahalad P, Scheinker D, Buckingham B, et al. Clinically serious hypoglycemia is rare and not associated with time-in-range in youth with new-onset type 1 diabetes. J Clin Endocrinol Metab 2021;106:3239-47.ArticlePubMedPMCPDF
- 35. Garg SK, Kipnes M, Castorino K, Bailey TS, Akturk HK, Welsh JB, et al. Accuracy and safety of Dexcom G7 continuous glucose monitoring in adults with diabetes. Diabetes Technol Ther 2022;24:373-80.ArticlePubMedPMC
- 36. Jafri RZ, Balliro CA, El-Khatib F, Maheno MM, Hillard MA, O’Donovan A, et al. A three-way accuracy comparison of the Dexcom G5, Abbott Freestyle Libre Pro, and Senseonics Eversense continuous glucose monitoring devices in a home-use study of subjects with type 1 diabetes. Diabetes Technol Ther 2020;22:846-52.ArticlePubMed
- 37. Jin SM, Baek JH, Suh S, Jung CH, Lee WJ, Park CY, et al. Factors associated with greater benefit of a national reimbursement policy for blood glucose test strips in adult patients with type 1 diabetes: a prospective cohort study. J Diabetes Investig 2017;9:549-57.ArticlePubMedPMCPDF
 PubReader
 ePub Link
 Cite
Cite


