Skip Navigation
Skip to contents

Diabetes Metab J : Diabetes & Metabolism Journal

Search
OPEN ACCESS

Articles

Page Path
HOME > Diabetes Metab J > Volume 36(5); 2012 > Article
Original Article
Complications Correlations between Glucagon Stimulated C-peptide Levels and Microvascular Complications in Type 2 Diabetes Patients
Hye-Jin Yoon1, Youn-Zoo Cho1, Ji-young Kim1, Byung-Joon Kim1, Keun-Young Park1, Gwan-Pyo Koh2, Dae-Ho Lee2, Dong-Mee Lim1
Diabetes & Metabolism Journal 2012;36(5):379-387.
DOI: https://doi.org/10.4093/dmj.2012.36.5.379
Published online: October 18, 2012
  • 6,865 Views
  • 49 Download
  • 23 Crossref
  • 22 Scopus

1Division of Endocrinology and Metabolism, Konyang University Hospital, Konyang University College of Medicine, Daejeon, Korea.

2Division of Endocrinology and Metabolism, Jeju National University Hospital, Jeju National University College of Medicine, Jeju, Korea.

corresp_icon Corresponding author: Dong-Mee Lim. Division of Endocrinology and Metabolism, Konyang University Hospital, Konyang University College of Medicine, 158 Gwanjeodong-ro, Seo-gu, Daejeon 302-718, Korea. mdldm@hanmail.net
• Received: September 9, 2011   • Accepted: May 23, 2012

Copyright © 2012 Korean Diabetes Association

This is an Open Access article distributed under the terms of the Creative Commons Attribution Non-Commercial License (http://creativecommons.org/licenses/by-nc/3.0/) which permits unrestricted non-commercial use, distribution, and reproduction in any medium, provided the original work is properly cited.

prev next
  • Background
    This study aimed to investigate whether stimulated C-peptide is associated with microvascular complications in type 2 diabetes mellitus (DM).
  • Methods
    A cross-sectional study was conducted in 192 type 2 diabetic patients. Plasma basal C-peptide and stimulated C-peptide were measured before and 6 minutes after intravenous injection of 1 mg glucagon. The relationship between C-peptide and microvascular complications was statistically analyzed.
  • Results
    In patients with retinopathy, basal C-peptide was 1.9±1.2 ng/mL, and stimulated C-peptide was 2.7±1.6 ng/mL; values were significantly lower compared with patients without retinopathy (P=0.031 and P=0.002, respectively). In patients with nephropathy, basal C-peptide was 1.6±0.9 ng/mL, and stimulated C-peptide was 2.8±1.6 ng/mL; values were significantly lower than those recorded in patients without nephropathy (P=0.020 and P=0.026, respectively). Stimulated C-peptide level was associated with increased prevalence of microvascular complications. Age-, DM duration-, and hemoglobin A1c-adjusted odds ratios for retinopathy in stimulated C-peptide value were 4.18 (95% confidence interval [CI], 1.40 to 12.51) and 3.35 (95% CI, 1.09 to 10.25), respectively. The multiple regression analysis between nephropathy and C-peptide showed that stimulated C-peptide was statistically correlated with nephropathy (P=0.03).
  • Conclusion
    In patients with type 2 diabetes, the glucagon stimulation test was a relatively simple method of short duration for stimulating C-peptide response. Stimulated C-peptide values were associated with microvascular complications to a greater extent than basal C-peptides.
C-peptide and insulin are secreted in equimolar amounts from the β-cells of the pancreas. A large amount of secreted insulin is removed by the liver during passage; in contrast, only a minor portion of serum C-peptide is taken out of the circulation by the liver [1,2]. Therefore, serum C-peptide more accurately reflects the β-cell function of the pancreas than serum insulin. Furthermore, C-peptide is also less affected in insulin-treated patients and by the presence of insulin-binding antibodies.
Previously, C-peptide was regarded as a biologically inert hormone. According to recent studies, however, C-peptide has been considered an active peptide hormone with an important physiologic function and an intracellular signaling function [3]. C-peptide may play a role in microvascular blood flow [4]. C-peptide also stimulates blood flow and glucose transport. A low level of C-peptide is an indicator of the progression of diabetic angiopathies [5]. In addition, C-peptide decreases glomerular hyperfiltration and albuminuria in type 1 diabetes mellitus (DM) [6].
In the Diabetes Control and Complications Trial (DCCT), type 1 DM patients with C-peptide capacity showed a significantly lower prevalence of microvascular complications than patients totally lacking C-peptide secretion by β-cells [7]. In another study, stimulated C-peptide level was found to be associated with a lower risk of microvascular complications in type 1 DM [8].
Methods for stimulating C-peptide response include the mixed-meal tolerance test (MMTT), glucagon stimulation test (GST) and the arginine stimulation test (AST). The GST has the advantage of a shorter duration (6 minutes), simple standardization and no side effects compared to mixed meals and other stimuli [9]. The C-peptide response to glucagon stimulation reflects β-cell function. Moreover, the assessment of stimulated C-peptide levels is recommended rather than that of basal C-peptide levels, due to a lower degree of variation in the former [10].
The purpose of this study was to examine whether stimulated C-peptide levels using GST were significantly associated with microvascular complications in type 2 DM patients.
Participants
A cross-sectional study was conducted in diabetic inpatients of Konyang University Hospital from January 2008 to December 2009. We recruited 192 patients with type 2 DM aged 45 years or order. All agreed to participate and gave oral and written consent. The Institutional Review Board of the Clinical Research Center in Konyang University Hospital approved the study protocol. Type 2 DM was diagnosed using the American Diabetes Association criteria as follows: Hemoglobin A1c (HbA1c) ≥6.5% using an National Glycohemoglobin Standarization Program (NGSP) certified method; plasma glucose ≥126 mg/dL (7 mmol/L) after an overnight fast; a positive value should be confirmed with a repeat test; symptoms of diabetes (polyuria, polydipsia, fatigue, weight loss) and a random plasma glucose level of >200 mg/dL (11.1 mmol/L); and oral glucose tolerance test that showed a plasma glucose level of >200 mg/dL (11.1 mmol/L) at 2 hours after ingestion of 75 g of glucose. We included only those patients who were over 30 years of age at diagnosis. Patients with acute inflammation, infection (pneumonia, urinary tract infection and DM foot), hepatitis, malignancy, or type 1 DM were excluded. We also excluded patients who required exogenous insulin and thiazolidinedione treatment, as well as those with renal impairment (glomerular filtration rate [GFR] ≤60 mL/min/1.73 m2) or plasma basal glucose levels ≥250 mg/dL, because these factors can affect C-peptide levels. Participants were evaluated for their baseline clinical and laboratory profiles. We assessed systolic and diastolic blood pressures (BP), fasting blood glucose levels, HbA1c, lipid panel, uric acid, homocystein, apolipoprotein (Apo A and B), and laboratory data.
Methods
The duration of diabetes was determined based upon when the patient was first diagnosed with the disorder. Body mass index (BMI) was calculated by dividing weight in kilograms by height in meters squared (kg/m2). We evaluated C-peptide levels in the fasting state because serum glucose levels and the ingestion of drugs known as sulfonylureas (that boost the body's production of insulin) can affect serum C-peptide levels. After an 8-hour fast, venous blood was collected for laboratory analysis. The fasting blood glucose level was determined by a routine hexokinase method. HbA1c and C-peptide levels, lipid panel, uric acid, homocystein, and Apo A and B were estimated. Uric acid, total cholesterol, triglycerides, and low density lipoprotein cholesterol (LDL-C) were measured by enzymatic methods, while high density lipoprotein cholesterol (HDL-C) was assessed via a selective inhibition assay. HbA1c was determined by high-performance liquid chromatography using an automatic glycohemoglobin analyzer (Tosoh HLC-723 7; Tosoh Co., Tokyo, Japan). Plasma C-peptide was analyzed by radioimmunoassay. The intra- and inter-assay coefficients of variations were 4% and 6%, respectively. Systolic and diastolic BPs were measured after the patient had been seated for at least 10 minutes. The homeostasis model assessment of insulin resistance (HOMA-IR) and of β-cell function (HOMA-β) was calculated using the HOMA calculator version 2.2.2 by using the homeostasis model assessment (HOMA2) as a percentage of the values in a normal reference population.
The GST was performed after an overnight fast. Plasma C-peptide levels were measured before and 6 minutes after intravenous injection of 1 mg of glucagon (basal and stimulated C-peptide, respectively).
Diagnosis of diabetic retinopathy was performed through fundoscopic examination by one ophthalmologist experienced in diabetic retinopathy. We included both patients with non-proliferative diabetic retinopathy and those with proliferative diabetic retinopathy. Retinopathy was defined by the presence of dot and blot hemorrhages, hard exudates, cotton wool spots, laser scars, and a history of vitrectomy as described by the European protocol for diabetic retinopathy. Proliferative retinopathy was classified as the presence of new vessels, which were subsequently confirmed by fluorescein angiography. Urinary albumin excretion was estimated using 24-hour urine collection. Diabetic nephropathy was defined as urinary albumin excretion ≥30 mg/day (microalbuminuria [30 to 300 mg/day] and macroalbuminuria [>300 mg/day]) in the absence of other reasons for albuminuria. Patients with GFR <60 mL/min/1.73 m2 were excluded. GFR was estimated using the Modification of Diet in Renal Disease (MDRD) study equation. Diabetic neuropathy was diagnosed on the basis of abnormal nerve conduction velocity. Furthermore, we included symptoms (decreased sensation, numbness, prickling, and burning) and any positive findings on neurologic examination by the Michigan Diabetic Neuropathy Score in our data.
We created four C-peptide groups that were defined by the relationship between basal C-peptide and ΔC-peptide values. ΔC-peptide was defined as the difference between basal and stimulated C-peptides. Because C-peptide is a continuous variable, we used the mean value of C-peptide measurements (basal C-peptide, ΔC-peptide). The mean basal serum C-peptide value was 1.9 ng/mL. Patients with basal C-peptide values of less than 1.9 ng/mL were classified into group 1 or 2; patients with basal C-peptide values of 1.9 ng/mL or more were placed into group 3 or 4.
The mean value of ΔC was 1.1 ng/mL. Patients with ΔC-peptide values of less than 1.1 ng/mL were classified into either group 1 or 3. Patients with C values of 1.1 ng/mL or more were put into group 2 or 4. Thus, the four groups were defined as follows : Group 1 (basal C-peptide <1.9 ng/mL, ΔC-peptide <1.1 ng/mL), Group 2 (basal C-peptide <1.9 ng/mL, ΔC-peptide ≥1.1 ng/mL), Group 3 (basal C-peptide ≥1.9 ng/mL, ΔC-peptide <1.1 ng/mL), and Group 4 (basal C-peptide ≥1.9 ng/mL, ΔC-peptide ≥1.1 ng/mL).
First, we investigate the association of C-peptide groups with the presence microvascular complications. Secondly, we evaluated the association of stimulated C-peptide levels with microvascular complications in type 2 DM.
Statistical analysis
All analyses were performed using the SPSS version 18.0 (SPSS Inc., Chicago, IL, USA). Characteristics of C-peptide groups and the relationship between C-peptide groups and microvascular complications were assessed using a one-way analysis of variance (ANOVA) method. Diabetic microvascular complications caused by C-peptides (basal and stimulated C-peptides) were analyzed by independent t-tests. Data are presented as mean±standard deviation or percentage, and a P value of less than 0.05 was considered statistically significant.
Multiple logistic regression analyses were used to estimate the odds ratios (ORs) for microvascular complications after adjusting for other clinical and biochemical variables such as age, DM duration, and degree of glycemic control (HbA1c). The relationship between nephropathy and C-peptides (basal and stimulated C-peptides) was analyzed by multiple regression analysis. Furthermore, a P value of less than 0.05 was considered statistically significant.
Clinical characteristics of the patients in four groups
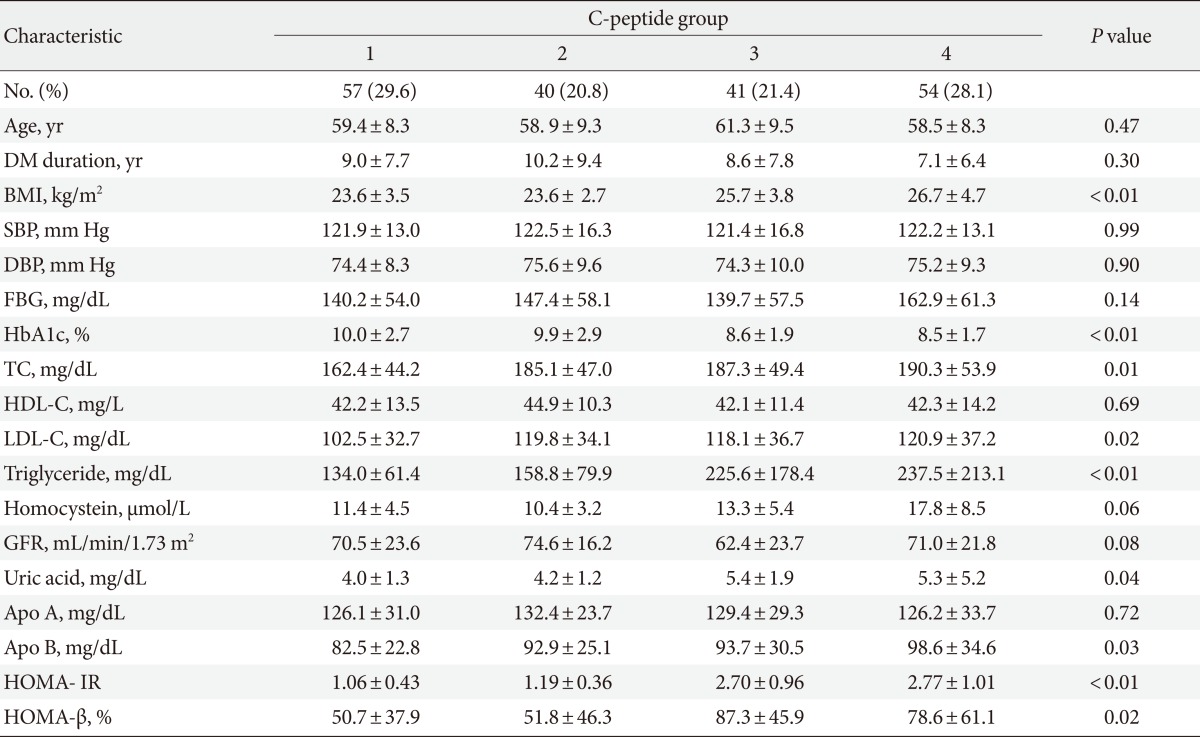
The clinical characteristics of the patients in the four groups are shown in Table 1. We included 192 patients in the study (98 males [51.0%], 94 females [48.9%]), who were divided into four groups according to the mean value of C-peptide measurements. BMI, HbA1c, total cholesterol, LDL-C, triglycerides, uric acid, Apo B, HOMA-IR and HOMA-β levels were found to be positively associated with the C-peptide groups (Table 1). No differences between groups were found for systolic BP, diastolic BP, fasting blood glucose, or GFR. BMI was significantly higher in Group 4 (high basal C-peptide, high ΔC-peptide) than in Group 1 (low basal C-peptide, low ΔC-peptide) (P<0.01). HbA1c was significantly lower in Group 4 (high basal C-peptide, high ΔC-peptide) than in Group 1 (low basal C-peptide, low ΔC-peptide) (P<0.01). Total cholesterol, LDL-C and triglyceride were significantly higher in Group 4 than in Group 1 (P=0.01, P=0.02, and P<0.01, respectively); uric acid and Apo B levels were also significantly different between these groups (P=0.04 and P=0.03, respectively). Our results showed that Group 4 experienced increased metabolic components and insulin resistance than Group 1. As insulin resistance increased, the β-cell function compensated; Group 4, which had higher β-cell function, showed better controlled blood glucose levels (HbA1c).
Association between C-peptide levels according to patient grouping and microvascular complications
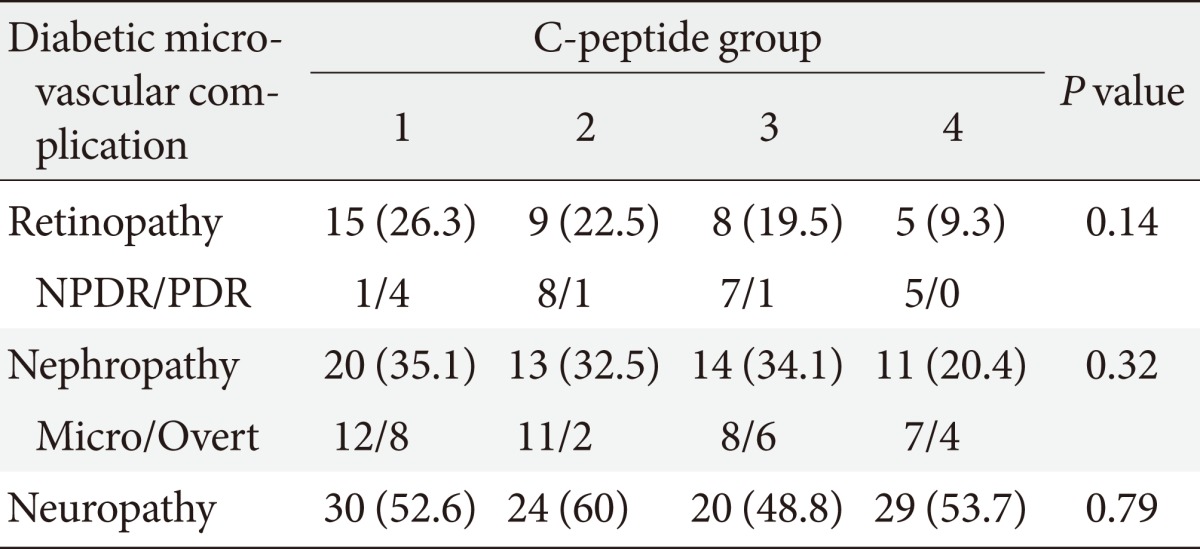
We investigated that the association between C-peptide levels according to patient grouping and microvascular complications (Table 2). Diabetic retinopathy was diagnosed in 26.3% of patients in Group 1, 22.5% in Group 2, 19.5% in Group 3, and 9.3% in Group 4. Diabetic retinopathy showed a higher prevalence in Group 1, but this difference was not statistically significant (P=0.14). The prevalence of diabetic nephropathy was higher in Group 1 than in Group 4, but this difference was not statistically significant, either (P=0.39). The incidence of diabetic neuropathy did not differ significantly between groups (P=0.79). Therefore, we concluded that there was no statistically significant association between microvascular complications and C-peptide groups (basal C-peptide, ΔC-peptide), which was likely because of the small-sized groups involved in our study.
Association between basal and stimulated C-peptide levels and microvascular complications
The association between basal and stimulated C-peptide levels and microvascular complications in our patient groups was evaluated (Table 3). In patients with diabetic retinopathy, the basal C-peptide level was 1.9±1.2 ng/mL and the stimulated C-peptide level was 2.7±1.6 ng/mL. The basal and stimulated C-peptide levels were significantly lower in patients with retinopathy than they were in those without diabetic retinopathy (basal C-peptide: 1.9±1.2 ng/mL vs. 2.7±1.6 ng/mL, P=0.031; stimulated C-peptide: 2.7±1.6 ng/mL vs. 3.7±1.9 ng/mL, P=0.002, respectively). In patients with diabetic nephropathy, the basal C-peptide level was 1.6±0.9 ng/mL and the stimulated C-peptide level was 2.8±1.6 ng/mL. These values were significantly lower than those in patients without diabetic nephropathy (basal C-peptide: 1.6±0.9 ng/mL vs. 2.2±1.2 ng/mL, P=0.020; stimulated C-peptide: 2.8±1.6 ng/mL vs. 3.5±1.8 ng/mL, P=0.026, respectively). The basal C-peptide level in patients with diabetic neuropathy was lower than that in patients without diabetic neuropathy, but this difference was not statistically significant (2.1±1.2 ng/mL vs. 2.4±1.5 ng/mL, P=0.12). The stimulated C-peptide level was 3.3±1.8 ng/mL in patients with diabetic neuropathy, which was significantly lower than that recorded in patients without diabetic neuropathy (3.3±1.8 ng/mL vs. 3.8±2.0 ng/mL, P=0.044).
Multiple DM risk factors and adjusted ORs for microvascular complications in stimulated and basal C-peptide levels
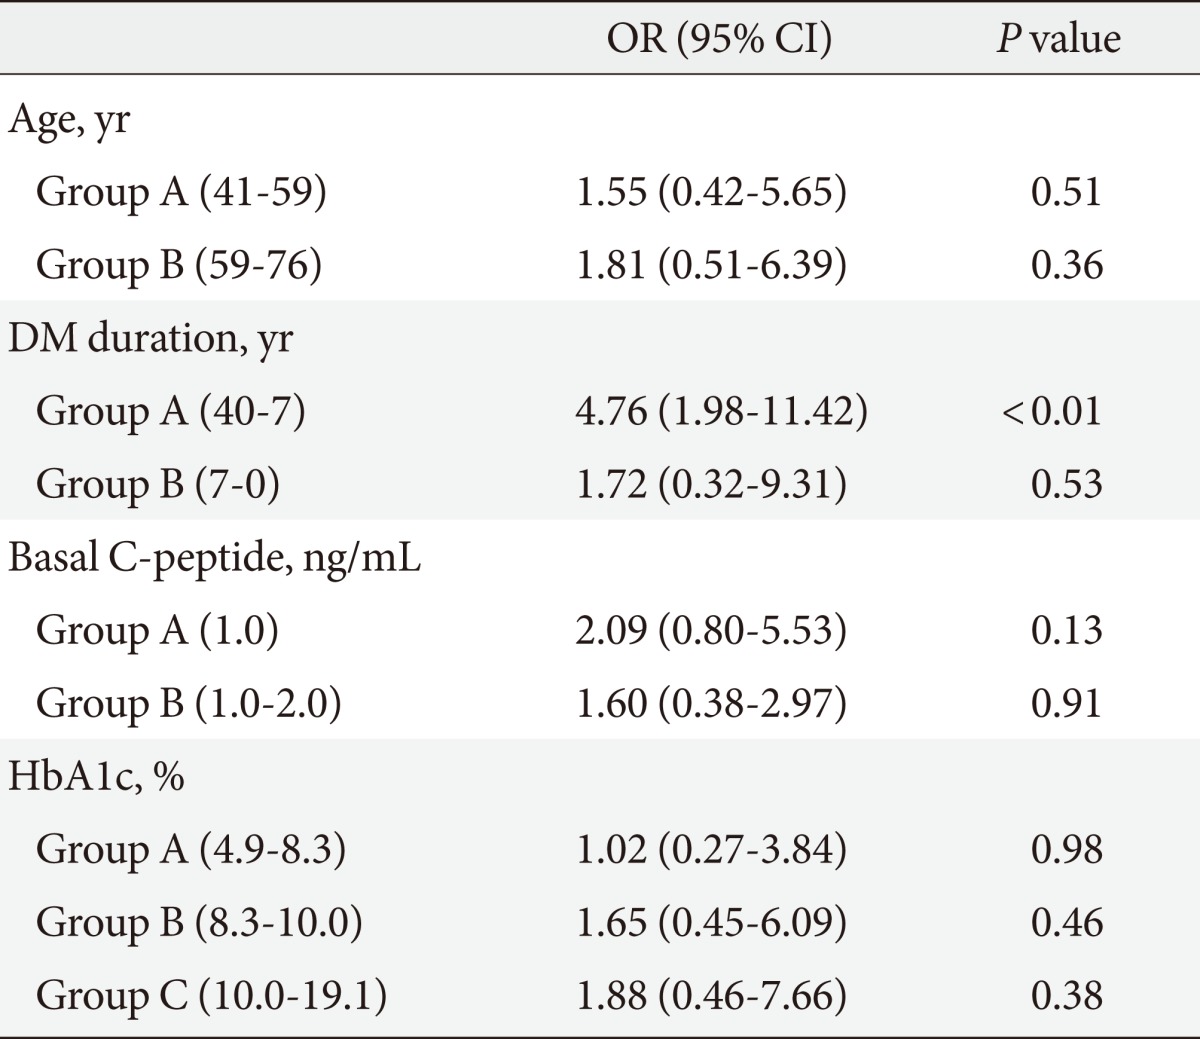
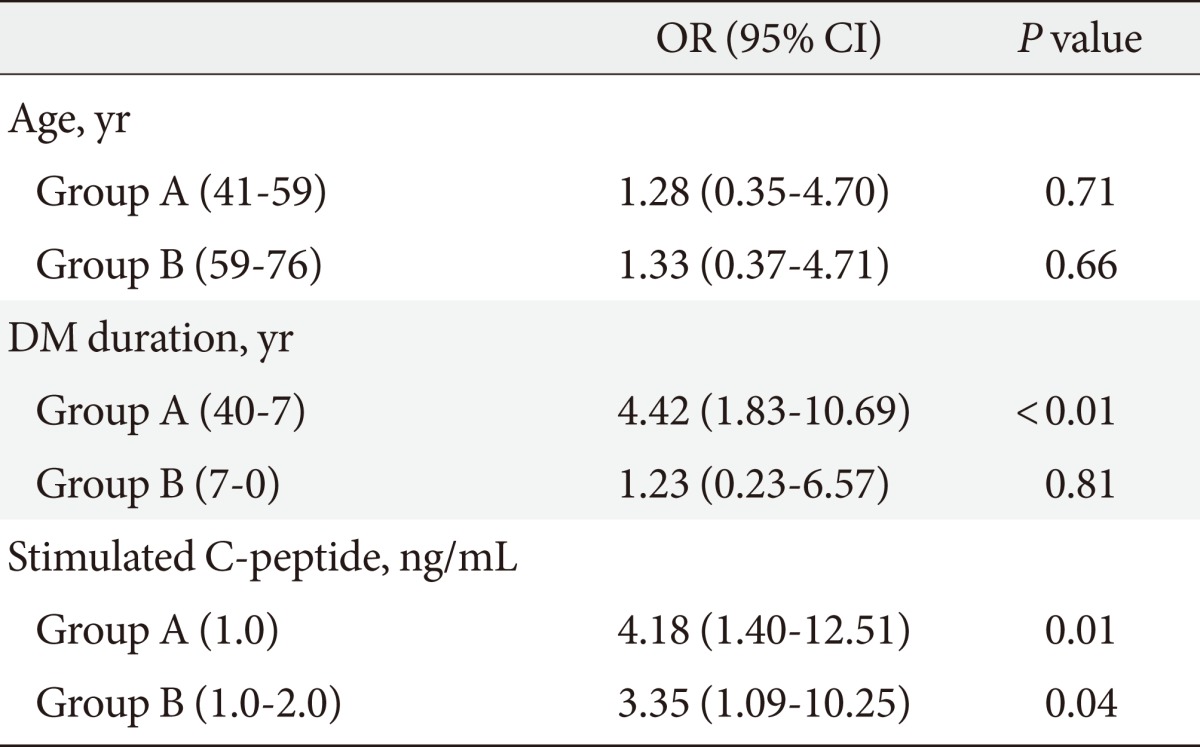
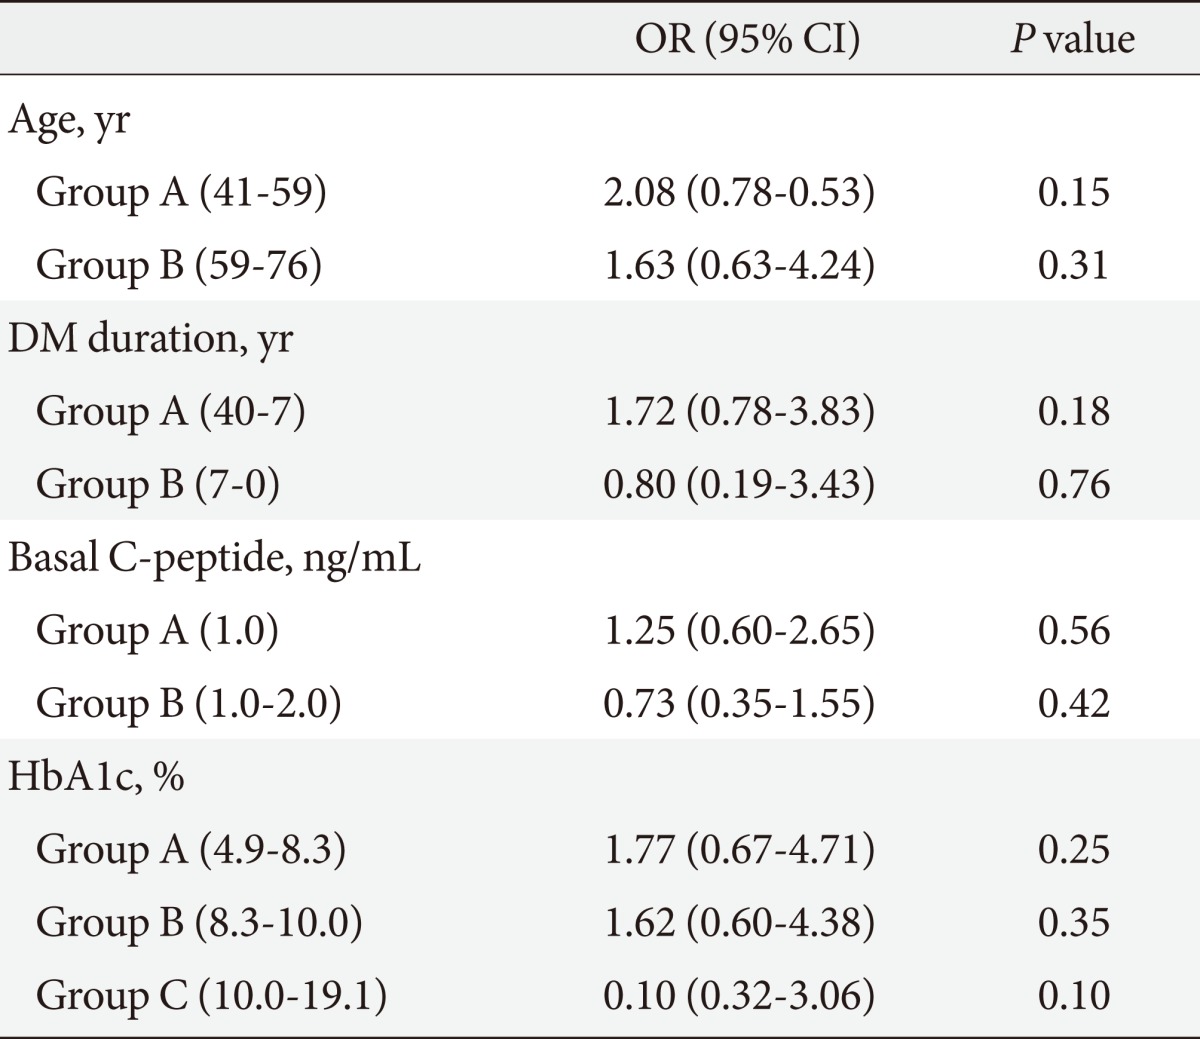
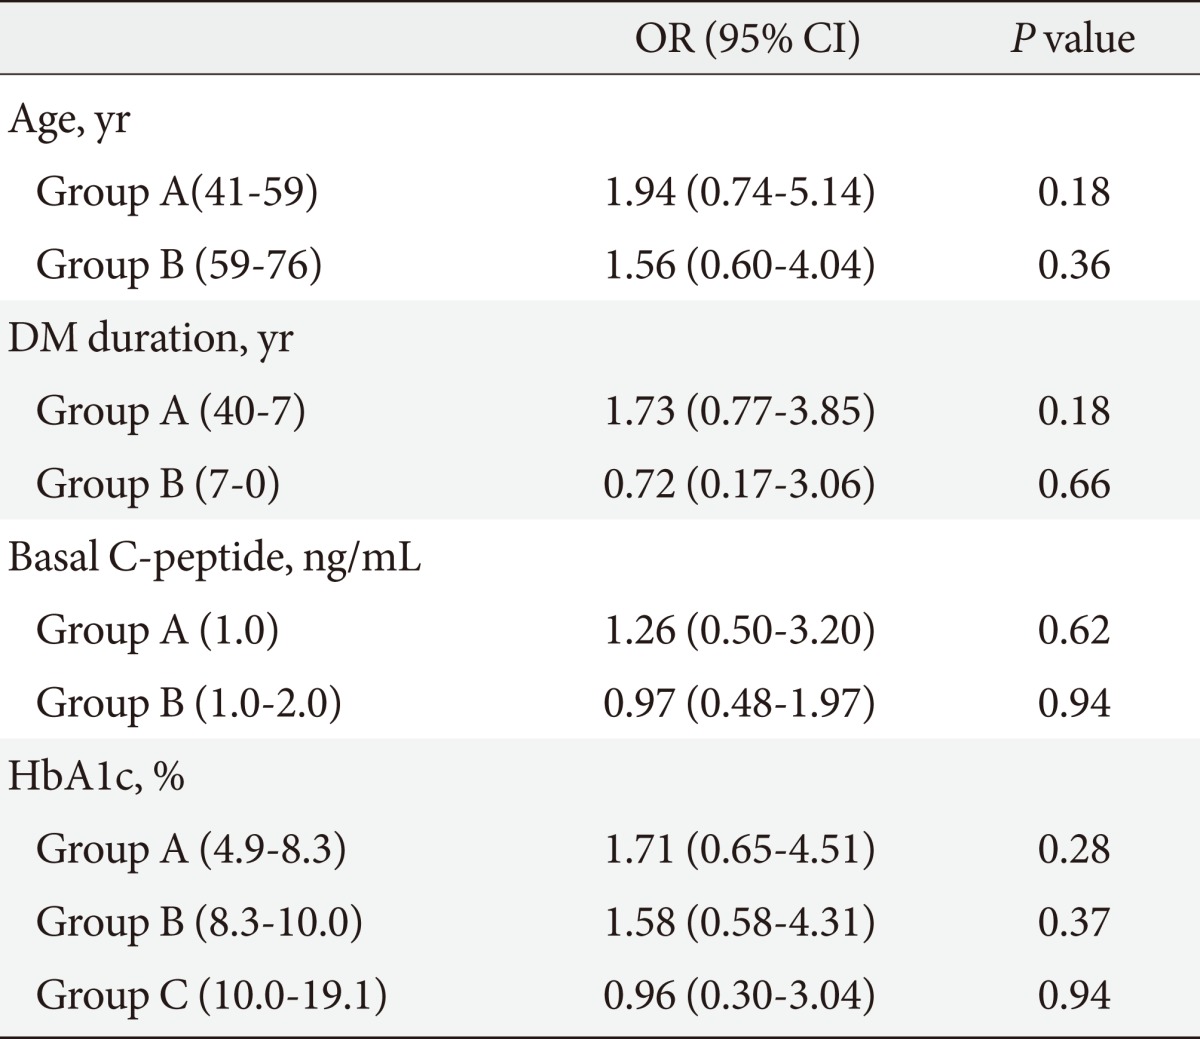
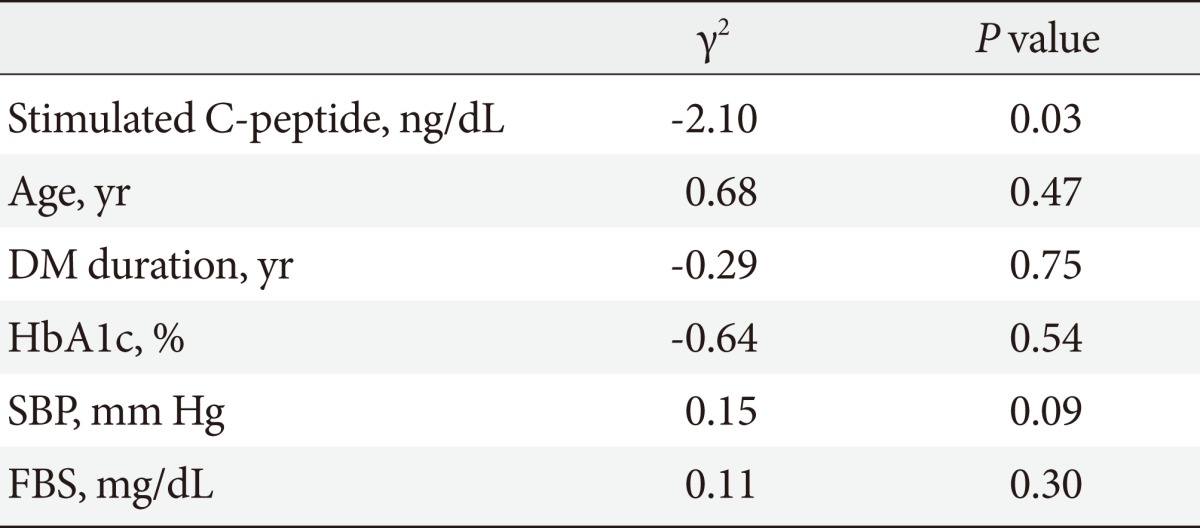
To evaluate the influence of other clinical factors associated with DM complications, multiple logistic regression analyses were performed. We calculated the DM complication risk factors-adjusted OR and the 95% confidence intervals (95% CI) for the association of microvascular complications with basal and stimulated C-peptide levels (Tables 4-7). Age, DM duration, and HbA1c results were included in the risk factors. Multiple logistic regression analyses of the correlation between stimulated C-peptide and retinopathy prevalence showed that DM duration and stimulated C-peptide were correlated with retinopathy prevalence, which was statistically significant (4.42 [95% CI 1.83 to 10.69]), P<0.01; 1.225, P<0.01; 4.18, P<0.01; 3.35, P=0.04, respectively). In neuropathy, however, basal and stimulated C-peptide levels did not have statistically significant correlations with neuropathy prevalence when it was adjusted for multiple risk factors (Table 7). The basal C-peptide-adjusted OR was not statistically significant in retinopathy and neuropathy (Tables 4, 6). We investigated the correlation between nephropathy and DM complication risk factors (such as age, DM duration, stimulated C-peptide, HbA1c, systolic BP, and fasting blood sugar) (Table 8). Multiple regression analysis showed that stimulated C-peptide was correlated with nephropathy prevalence, which was statistically significant (stimulated C-peptide: -2.17, P=0.03) (Table 6).
Type 2 DM is characterized by insulin resistance and decreased insulin secretion [11]. Type 2 DM is a progressive disease that is affected by a multi-factorial physiology. In this disorder the natural history of β-cell functions has not been clearly identified. Therefore, it is necessary to evaluate the degree to which insulin secretion affects diabetic complications and the clinical course of type 2 DM.
In this cross-sectional study, we evaluated how β-cell functions are associated with clinical manifestations and microvascular complications in patients with type 2 DM. We found that basal C-peptide and secreted C-peptide (ΔC-peptide) levels were associated with clinical characteristics and microvascular complications. HbA1c was significantly higher in Group 1 (low basal C-peptide, low ΔC-peptide) than in Group 4 (high basal C-peptide, high ΔC-peptide). However, HOMA-IR and HOMA-β scores were significantly higher in Group 4 than in Group 1. We can speculate that poor β-cell function is likely related to uncontrolled blood glucose. BMI was significantly higher in Group 4 (high basal C-peptide, high ΔC-peptide) than in Group 1 (low basal C-peptide, low ΔC-peptide). BMI, total cholesterol, LDL-C, triglycerides, uric acid, and Apo B were significantly higher in Group 4 than in Group 1.
The correlation between C-peptide levels and components of the metabolic syndrome is well known [12]. We found that C-peptide levels was associated with dyslipidemia and BMI. When basal C-peptide and secreted C-peptide (ΔC-peptide) level were high, there was an increased likelihood of progression to metabolic syndrome. Kim et al. [13] showed that basal C-peptide level increased significantly in metabolic syndrome patients with diabetes. Therefore, people with a high basal C-peptide level need to decrease it to reduce the risk of coronary heart disease and cerebral vascular disease associated with metabolic syndrome.
The prevalence of diabetic microvascular complications was not significantly different between the groups (basal C-peptide, ΔC-peptide) in this study. The prevalence of diabetic retinopathy was higher in Group 1 than in Group 4. This finding suggests that the higher ΔC-peptide group had a lower prevalence of retinopathy. Kim et al. [13] conducted a larger study than ours, and they reported that ΔC-peptide is more closely associated with microvascular complications than are fasting C-peptide levels. In their study the prevalence of diabetic retinopathy and nephropathy was higher in Group 1 than in Group 4. This finding suggests that low basal and secreted C-peptide (ΔC-peptide) levels are associated with a high prevalence of diabetic retinopathy and nephropathy. In this study, however, this observation was not statistically significant. This study had a relatively small number of patients with chronic complications. With a larger sample size, we might have observed a significant association between microvascular complications and C-peptide groups (basal C-peptide, ΔC-peptide), and we could have been able to better clarify the correlation between β-cell function and microvascular complications.
C-peptide and insulin are secreted in equimolar amounts from the β-cells of the pancreas. Secreted insulin passes through the liver into the bloodstream, where about 50% of the insulin is extracted. C-peptide and insulin have different hepatic clearances. Therefore, serum insulin concentration is indicative of post-hepatic insulin levels rather than the value of secreted insulin [8]. Accurate estimation of β-cell function in insulin-treated patients is not possible, as measured insulin level cannot be separated into secreted and exogenous insulin levels. As C-peptide has a longer half-life than insulin, C-peptide more accurately reflects β-cell function than serum insulin in insulin-treated patients, and C-peptide levels are less affected by the presence of insulin-binding antibodies.
Stimulated C-peptide reactivity is correlated with β-cell function in patients with type 2 DM [14,15]. Furthermore, the lower degree of variation in the stimulated C-peptide level makes it more preferable than the fasting C-peptide level. Three methods for stimulating C-peptide response have been used in clinical trials. The first method is MMTT, in which a liquid meal is ingested in the fasting state, and C-peptide level is measured over the subsequent 2 to 4 hours. The second method is GST, in which glucagon is injected intravenously and C-peptide level is measured over the following 6 minutes [10]. In patients with type 2 DM, GST is relatively simple to perform and has a shorter duration than other tests. Adverse effect associated with GST include mild nausea and rarely, vomiting. The third method is the AST, which has a short duration, but its reproducibility has not been assessed. Jones et al. [16] reported that the urine C-peptide creatinine ratio was positively correlated with serum C-peptide and may provide a practical alternative measure. Although they are positively correlated, it is likely that the urine C-peptide creatinine ratio will be less reproducible after individuals consume their own meals at home than are measurements taken after a fixed stimulus. Kim et al. [13] studied these levels using the MMTT. However, GST is more convenient and cost-effective than MMTT and therefore has been regarded as the most suitable test [17]. Therefore, we used GST to obtain stimulated C-peptide levels in this study. This method was the biggest difference between the two studies.
Many studies have evaluated the association between C-peptide level and diabetic complications in patients with type 2 DM. In the DCCT trial, type 1 diabetic patients with C-peptide secretory capacities showed a significant prevalence of microvascular complications than did patients who were deficient in β-cell C-peptide secretion [7]. Low C-peptide levels were associated with the progression of diabetic microangiopathy, such as retinopathy and nephropathy [18]. Shin et al. [19] showed that a lower C-peptide response to oral glucose stimuli was associated with albuminuria. In addition, C-peptide has been shown to be associated with autonomic nerve function in type 2 DM [20]. In another study, low C-peptide immunoreactivity was revealed to be associated with diabetic microangiopathy [21]. Recently, Kim et al. [13] found that ΔC-peptide was more closely associated with microvascular complications than was the fasting C-peptide level. In this previous study, stimulated C-peptide was used as an alternative marker of β-cell function, and the association of stimulated C-peptide with microvascular complications was investigated.
However, no association was found between C-peptide level and neuropathy, nephropathy or retinopathy [5]. Klein et al. [22] could not identify any relationship between C-peptide level and retinopathy prevalence, either; however, the serum glucose level was associated with retinopathy. Another study showed no relationship between C-peptide and microangiopathy [23].
In this study, we found that the basal C-peptide level was significantly associated with diabetic retinopathy and nephropathy, but not with neuropathy. The stimulated C-peptide level was associated with all three types of microvascular complications. To adjust for the confounding factor, we performed multiple regression analyses. In retinopathy, DM duration and the stimulated C-peptide level did result in significant attenuation of the relationships. Furthermore, the stimulated C-peptide had statistical significance in the multiple regression analysis with nephropathy and DM complication risk factors. However upon sub-analysis we did not obtain a statistically significant result with neuropathy and multiple DM complication risk factors such as age, DM duration and HbA1c. C-peptide has a dose-dependent effect on Na+/K+-adenosine triphosphatase activity, endothelial nitrous oxide synthase and endoneurial blood flow [24,25]. Therefore, it seems that diabetic neuropathy was more affected by stimulated C-peptide than by basal C-peptide. If the present study had included a larger sample size, we might have observed a significant association between nephropathy and the stimulated C-peptide level. We showed that a reduction in β-cell function was associated with retinopathy and neuropathy. The purpose of our study was to prove that stimulated C-peptide response to glucagon can be used to assess the β-cell function of the pancreas and predict the prevalence of diabetic microvascular complications. This ability is essential for prevention because early evaluation and therapeutic interventions may help preserve β-cell function in affected patients and could slow the progression of diabetic microvascular complications.
Our study had some limitations. The number of participants was too small to accurately validate the association between stimulated C-peptide levels and microvascular complications. We also used a cross-sectional study design, which is not suitable for assessing the temporal sequence of the assessed outcome. The stimulated C-peptide response to glucagon has also been shown to be affected by age, glucose level and weight. Furthermore, we excluded patients with GFR <60 mL/min/1.73 m2, who were associated with diabetic nephropathy. We also excluded patients who required exogenous insulin and thiazolidinedione treatment, but we included sulfonylurea users in our data. However, if the GST were performed after an overnight fast, the effect of sulfonylurea would be minimized. We did not evaluate the association of stimulated C-peptide with the severity of diabetic microvascular complications. We created four groups based upon the mean value of basal C-peptide and ΔC-peptide because C-peptide is a continuous variable.
In conclusion, in patients with type 2 DM, GST was a relatively simple method with a short duration and few side effects. The stimulated C-peptide values obtained through GST were associated with microvascular complications to a greater extent than the basal C-peptide level in patients with type 2 DM. Prospective and larger studies will be needed to clarify the association between stimulated C-peptide levels and microvascular complications, which may be used to reduce the prevalence of microvascular complications in patients with type 2 DM.

This work did not receive any financial support nor is it affiliated with any organizations. No potential conflict of interest relevant to this article was reported.

  • 1. Faber OK, Hagen C, Binder C, Markussen J, Naithani VK, Blix PM, Kuzuya H, Horwitz DL, Rubenstein AH, Rossing N. Kinetics of human connecting peptide in normal and diabetic subjects. J Clin Invest 1978;62:197-203. ArticlePubMedPMC
  • 2. Kuhl C, Faber OK, Hornnes P, Jensen SL. C-peptide metabolism and the liver. Diabetes 1978;27(Suppl 1):197-200. ArticlePubMedPDF
  • 3. Marx N, Walcher D. C-Peptide and atherogenesis: C-Peptide as a mediator of lesion development in patients with type 2 diabetes mellitus? Exp Diabetes Res 2008;2008:385108ArticlePubMedPMCPDF
  • 4. Forst T, Kunt T, Wilhelm B, Weber MM, Pfutzner A. Role of C-Peptide in the regulation of microvascular blood flow. Exp Diabetes Res 2008;2008:176245ArticlePubMedPMCPDF
  • 5. Sari R, Balci MK. Relationship between C peptide and chronic complications in type-2 diabetes mellitus. J Natl Med Assoc 2005;97:1113-1118. PubMedPMC
  • 6. Chowta MN, Adhikari PM, Chowta NK, Shenoy AK, D'Souza S. Serum C peptide level and renal function in diabetes mellitus. Indian J Nephrol 2010;20:25-28. ArticlePubMedPMC
  • 7. Steffes MW, Sibley S, Jackson M, Thomas W. Beta-cell function and the development of diabetes-related complications in the diabetes control and complications trial. Diabetes Care 2003;26:832-836. PubMed
  • 8. Palmer JP, Fleming GA, Greenbaum CJ, Herold KC, Jansa LD, Kolb H, Lachin JM, Polonsky KS, Pozzilli P, Skyler JS, Steffes MW. C-peptide is the appropriate outcome measure for type 1 diabetes clinical trials to preserve beta-cell function: report of an ADA workshop, 21-22 October 2001. Diabetes 2004;53:250-264. PubMed
  • 9. Scheen AJ, Castillo MJ, Lefebvre PJ. Assessment of residual insulin secretion in diabetic patients using the intravenous glucagon stimulatory test: methodological aspects and clinical applications. Diabetes Metab 1996;22:397-406. PubMed
  • 10. Greenbaum CJ, Mandrup-Poulsen T, McGee PF, Battelino T, Haastert B, Ludvigsson J, Pozzilli P, Lachin JM, Kolb H. Type 1 Diabetes Trial Net Research Group. European C-Peptide Trial Study Group. Mixed-meal tolerance test versus glucagon stimulation test for the assessment of beta-cell function in therapeutic trials in type 1 diabetes. Diabetes Care 2008;31:1966-1971. PubMedPMC
  • 11. Abdullah BB, Patil BS, Thaseen A. Significance of C-peptide in type 2 diabetics: a study in the North Karnataka population of India. Al Ameen J Med Sci 2010;3:65-78.
  • 12. Koyama K, Chen G, Lee Y, Unger RH. Tissue triglycerides, insulin resistance, and insulin production: implications for hyperinsulinemia of obesity. Am J Physiol 1997;273(4 Pt 1):E708-E713. ArticlePubMed
  • 13. Kim BY, Jung CH, Mok JO, Kang SK, Kim CH. Association between serum C-peptide levels and chronic microvascular complications in Korean type 2 diabetic patients. Acta Diabetol 2012;49:9-15. ArticlePubMedPDF
  • 14. Garcia-Webb P, Bonser A, Welborn TA. Correlation between fasting serum C-peptide and B cell insulin secretory capacity in diabetes mellitus. Diabetologia 1982;22:296ArticlePubMedPDF
  • 15. Gottsater A, Landin-Olsson M, Fernlund P, Gullberg B, Lernmark A, Sundkvist G. Pancreatic beta-cell function evaluated by intravenous glucose and glucagon stimulation: a comparison between insulin and C-peptide to measure insulin secretion. Scand J Clin Lab Invest 1992;52:631-639. ArticlePubMed
  • 16. Jones AG, Besser RE, McDonald TJ, Shields BM, Hope SV, Bowman P, Oram RA, Knight BA, Hattersley AT. Urine C-peptide creatinine ratio is an alternative to stimulated serum C-peptide measurement in late-onset, insulin-treated diabetes. Diabet Med 2011;28:1034-1038. ArticlePubMed
  • 17. Faber OK, Binder C. C-peptide response to glucagon: a test for the residual beta-cell function in diabetes mellitus. Diabetes 1977;26:605-610. ArticlePubMed
  • 18. Inukai T, Matsutomo R, Tayama K, Aso Y, Takemura Y. Relation between the serum level of C-peptide and risk factors for coronary heart disease and diabetic microangiopathy in patients with type-2 diabetes mellitus. Exp Clin Endocrinol Diabetes 1999;107:40-45. ArticlePubMed
  • 19. Shin SJ, Lee YJ, Hsaio PJ, Chen JH, Guh JY, Chen MT, Chen WC, Tsai JH. Relationships between beta-cell function and diabetic duration and albuminuria in type 2 diabetes mellitus. Pancreas 1997;14:192-198. ArticlePubMed
  • 20. Toyry JP, Niskanen LK, Mantysaari MJ, Lansimies EA, Haffner SM, Miettinen HJ, Uusitupa MI. Do high proinsulin and C-peptide levels play a role in autonomic nervous dysfunction? Power spectral analysis in patients with non-insulin-dependent diabetes and nondiabetic subjects. Circulation 1997;96:1185-1191. ArticlePubMed
  • 21. Bo S, Cavallo-Perin P, Gentile L, Repetti E, Pagano G. Relationship of residual beta-cell function, metabolic control and chronic complications in type 2 diabetes mellitus. Acta Diabetol 2000;37:125-129. ArticlePubMedPDF
  • 22. Klein R, Klein BE, Moss SE. The Wisconsin Epidemiologic Study of Diabetic Retinopathy XVI The relationship of C-peptide to the incidence and progression of diabetic retinopathy. Diabetes 1995;44:796-801. ArticlePubMed
  • 23. Sjoberg S, Gunnarsson R, Gjotterberg M, Lefvert AK, Persson A, Ostman J. Residual insulin production, glycaemic control and prevalence of microvascular lesions and polyneuropathy in long-term type 1 (insulin-dependent) diabetes mellitus. Diabetologia 1987;30:208-213. ArticlePubMedPDF
  • 24. Sima AA, Zhang W, Grunberger G. Type 1 diabetic neuropathy and C-peptide. Exp Diabesity Res 2004;5:65-77. ArticlePubMedPMCPDF
  • 25. Kamiya H, Zhang W, Sima AA. The beneficial effects of C-Peptide on diabetic polyneuropathy. Rev Diabet Stud 2009;6:187-202. ArticlePubMedPMC
Table 1
Characteristics of the clinic-based cohort of 192 participants with type 2 diabetes by C-peptide group
dmj-36-379-i001.jpg

Values are presented as mean±standard deviation or number (%). The four groups were defined as follows: Group 1 (basal C-peptide <1.9 ng/mL, ΔC-peptide <1.1 ng/mL), Group 2 (basal C-peptide <1.9 ng/mL, ΔC-peptide ≥1.1 ng/mL), Group 3 (basal C-peptide ≥1.9 ng/mL, ΔC-peptide <1.1 ng/mL), and Group 4 (basal C-peptide ≥1.9 ng/mL, ΔC-peptide ≥1.1 ng/mL).

DM, diabetes mellitus; BMI, body mass index; SBP, systolic blood pressure; DBP, diastolic blood pressure; FBG, fasting blood glucose; HbA1c, hemoglobin A1c; TC, total cholesterol; HDL-C, high density lipoprotein cholesterol; LDL-C, low density lipoprotein cholesterol; GFR, glomerular filtration rate; Apo, apolipoprotein; HOMA-IR, homeostasis model assessment of insulin resistance; HOMA-β, homeostasis model assessment of β-cell function.

Table 2
Diabetic microvascular complications by C-peptide group
dmj-36-379-i002.jpg

Values are presented as number (%). The four groups were defined as follows: Group 1 (basal C-peptide <1.9 ng/mL, ΔC-peptide <1.1 ng/mL), Group 2 (basal C-peptide <1.9 ng/mL, ΔC-peptide ≥1.1 ng/mL), Group 3 (basal C-peptide ≥1.9 ng/mL, ΔC-peptide <1.1 ng/mL), and Group 4 (basal C-peptide ≥1.9 ng/mL, ΔC-peptide ≥1.1 ng/mL).

NPDR/PDR, non-proliferative/proliferative retinopathy; Micro/Overt, micro albuminuria/overt albuminuria.

Table 3
Diabetic microvascular complications by basal and stimulated C-peptide
dmj-36-379-i003.jpg
Table 4
Multiple risk factors-adjusted ORs and 95% CIs in the relationship between retinopathy and basal C-peptide level
dmj-36-379-i004.jpg

Groups A, B, and C are composed of serial data (192 patients).

OR, odds ratio; CI, confidence interval; DM, diabetes mellitus; HbA1c, hemoglobin A1c.

Table 5
Multiple risk factors-adjusted ORs and 95% CIs in the relationship between retinopathy and stimulated C-peptide level
dmj-36-379-i005.jpg

Groups A and B are composed of serial data.

OR, odds ratio; CI, confidence interval; DM, diabetes mellitus.

Table 6
Multiple risk factors-adjusted ORs and 95% CIs in the relationship between neuropathy and basal C-peptide level
dmj-36-379-i006.jpg

Groups A and B are composed of serial data.

OR, odds ratio; CI, confidence interval; DM, diabetes mellitus; HbA1c, hemoglobin A1c.

Table 7
Multiple risk factors-adjusted ORs and 95% CIs in the relationship between neuropathy and stimulated C-peptide level
dmj-36-379-i007.jpg

Groups A and B are composed of serial data.

OR, odds ratio; CI, confidence interval; DM, diabetes mellitus; HbA1c, hemoglobin A1c.

Table 8
Correlation between nephropathy and multiple factors
dmj-36-379-i008.jpg

DM, diabetes mellitus; HbA1c, hemoglobin A1c; SBP, systolic blood pressure; FBS, fasting blood sugar.

Figure & Data

References

    Citations

    Citations to this article as recorded by  
    • A Nomogram for Predicting Vision-Threatening Diabetic Retinopathy Among Mild Diabetic Retinopathy Patients: A Case–Control and Prospective Study of Type 2 Diabetes
      Jing Ke, Kun Li, Bin Cao
      Diabetes, Metabolic Syndrome and Obesity.2023; Volume 16: 275.     CrossRef
    • The average 30-minute post-prandial C-peptide predicted diabetic retinopathy progress: a retro-prospective study
      Ting Pan, Jie Gao, Xinghua Cai, Huihui Zhang, Jun Lu, Tao Lei
      BMC Endocrine Disorders.2023;[Epub]     CrossRef
    • Dysregulation of miR-374a is involved in the progression of diabetic retinopathy and regulates the proliferation and migration of retinal microvascular endothelial cells
      Zhanhong Wang, Xiao Zhang, Yanjun Wang, Dailing Xiao
      Clinical and Experimental Optometry.2022; 105(3): 287.     CrossRef
    • The Relationship between the Lipid Accumulation Product and Beta-cell Function in Korean Adults with or without Type 2 Diabetes Mellitus: The 2015 Korea National Health and Nutrition Examination Survey
      Hye Eun Cho, Seung Bum Yang, Mi Young Gi, Ju Ae Cha, so Young Park, Hyun Yoon
      Endocrine Research.2022; 47(2): 80.     CrossRef
    • Effects of Serum C‐Peptide Level on Blood Lipid and Cardiovascular and Cerebrovascular Injury in Patients with Type 2 Diabetes Mellitus: A Meta‐Analysis
      Juan Qin, Rongli Sun, Ding Ding, Yuvaraja Teekaraman
      Contrast Media & Molecular Imaging.2022;[Epub]     CrossRef
    • Investigation of Diabetes Complication Risk Perception and Diabetes Self-Management Skills in Individuals with Diabetes
      Mehmet AYTEMUR, Bahar İNKAYA
      Turkish Journal of Diabetes and Obesity.2022; 6(2): 121.     CrossRef
    • Diabetic Retinopathy and Insulin Insufficiency: Beta Cell Replacement as a Strategy to Prevent Blindness
      Eli Ipp
      Frontiers in Endocrinology.2021;[Epub]     CrossRef
    • Association of C-peptide with diabetic vascular complications in type 2 diabetes
      Y. Wang, H. Wan, Y. Chen, F. Xia, W. Zhang, C. Wang, S. Fang, K. Zhang, Q. Li, N. Wang, Y. Lu
      Diabetes & Metabolism.2020; 46(1): 33.     CrossRef
    • Variations in glucose/C-peptide ratio in patients with type 2 diabetes associated with renal function
      John A. D'Elia, Christopher Mulla, Jiankang Liu, Larry A. Weinrauch
      Diabetes Research and Clinical Practice.2019; 150: 1.     CrossRef
    • The pharmacokinetics of porcine C‐peptide after intraperitoneal injection
      Naho Iizuka, Masuhiro Nishimura, Yasutaka Fujita, Osamu Sawamoto, Shinichi Matsumoto
      Xenotransplantation.2019;[Epub]     CrossRef
    • Association of KCNJ11(RS5219) gene polymorphism with biochemical markers of glycemic status and insulin resistance in gestational diabetes mellitus
      Lenin M, Ramesh Ramasamy, Sweta Kulkarani, Seetesh Ghose, Srinivasan A.R.S., Sathish Babu M
      Meta Gene.2018; 16: 134.     CrossRef
    • Glucagon secretion is increased in patients with Type 2 diabetic nephropathy
      Xiaoyu Wang, Juhong Yang, Baocheng Chang, Chunyan Shan, Yanguang Xu, Miaoyan Zheng, Ying Wang, Huizhu Ren, Liming Chen
      Journal of Diabetes and its Complications.2016; 30(3): 488.     CrossRef
    • Relationship between serum C-peptide level and diabetic retinopathy according to estimated glomerular filtration rate in patients with type 2 diabetes
      Jin Ook Chung, Dong Hyeok Cho, Dong Jin Chung, Min Young Chung
      Journal of Diabetes and its Complications.2015; 29(3): 350.     CrossRef
    • Independent association between serum C‐peptide levels and fat mass‐to‐lean mass ratio in the aging process
      Ying Li, Lian Shun Zheng, Yue Li, Duo Duo Zhao, Lu Meng
      Geriatrics & Gerontology International.2015; 15(7): 918.     CrossRef
    • Relationship Between β-Cell Function, Metabolic Control, and Microvascular Complications in Type 2 Diabetes Mellitus
      Lihua Zhao, Jing Ma, Shaoxin Wang, Yun Xie
      Diabetes Technology & Therapeutics.2015; 17(1): 29.     CrossRef
    • Association of fasting insulin and C peptide with diabetic retinopathy in Latinos with type 2 diabetes
      Jane Z Kuo, Xiuqing Guo, Ronald Klein, Barbara E Klein, Robert N Weinreb, Pauline Genter, Fone-Ching Hsiao, Mark O Goodarzi, Jerome I Rotter, Yii-Der Ida Chen, Eli Ipp
      BMJ Open Diabetes Research & Care.2014; 2(1): e000027.     CrossRef
    • Association between physical activity and serum C‐peptide levels among the elderly
      Ying Li, Lu Meng, QianQian Miao, Yasuto Sato
      Geriatrics & Gerontology International.2014; 14(3): 647.     CrossRef
    • Age at Diagnosis and C-Peptide Level Are Associated with Diabetic Retinopathy in Chinese
      Xiaoling Cai, Xueyao Han, Simin Zhang, Yingying Luo, Yingli Chen, Linong Ji, Alfred S. Lewin
      PLoS ONE.2014; 9(3): e91174.     CrossRef
    • Prevalence and risk factors for diabetic retinopathy in Asian Indians with young onset Type 1 and Type 2 Diabetes
      Ramachandran Rajalakshmi, Anandakumar Amutha, Harish Ranjani, Mohammed K. Ali, Ranjit Unnikrishnan, Ranjit Mohan Anjana, K.M. Venkat Narayan, Viswanathan Mohan
      Journal of Diabetes and its Complications.2014; 28(3): 291.     CrossRef
    • Prediction of response to GLP-1 receptor agonist therapy in Japanese patients with type 2 diabetes
      Kenjiro Imai, Tetsuro Tsujimoto, Atsushi Goto, Maki Goto, Miyako Kishimoto, Ritsuko Yamamoto-Honda, Hiroshi Noto, Hiroshi Kajio, Mitsuhiko Noda
      Diabetology & Metabolic Syndrome.2014;[Epub]     CrossRef
    • The Association between the Serum C-Peptide Level and Bone Mineral Density
      Ying Li, Hua Liu, Yasuto Sato, Bin He
      PLoS ONE.2013; 8(12): e83107.     CrossRef
    • C-Peptide and Its Career from Innocent Bystander to Active Player in Diabetic Atherogenesis
      Corinna Lebherz, Nikolaus Marx
      Current Atherosclerosis Reports.2013;[Epub]     CrossRef
    • C-Peptide and Vascular Complications in Type 2 Diabetic Subjects
      Seok Man Son
      Diabetes & Metabolism Journal.2012; 36(5): 345.     CrossRef

    • PubReader PubReader
    • Cite this Article
      Cite this Article
      export Copy Download
      Close
      Download Citation
      Download a citation file in RIS format that can be imported by all major citation management software, including EndNote, ProCite, RefWorks, and Reference Manager.

      Format:
      • RIS — For EndNote, ProCite, RefWorks, and most other reference management software
      • BibTeX — For JabRef, BibDesk, and other BibTeX-specific software
      Include:
      • Citation for the content below
      Correlations between Glucagon Stimulated C-peptide Levels and Microvascular Complications in Type 2 Diabetes Patients
      Diabetes Metab J. 2012;36(5):379-387.   Published online October 18, 2012
      Close
    • XML DownloadXML Download
    Related articles
    Correlations between Glucagon Stimulated C-peptide Levels and Microvascular Complications in Type 2 Diabetes Patients
    Correlations between Glucagon Stimulated C-peptide Levels and Microvascular Complications in Type 2 Diabetes Patients
    Table 1 Characteristics of the clinic-based cohort of 192 participants with type 2 diabetes by C-peptide group

    Values are presented as mean±standard deviation or number (%). The four groups were defined as follows: Group 1 (basal C-peptide <1.9 ng/mL, ΔC-peptide <1.1 ng/mL), Group 2 (basal C-peptide <1.9 ng/mL, ΔC-peptide ≥1.1 ng/mL), Group 3 (basal C-peptide ≥1.9 ng/mL, ΔC-peptide <1.1 ng/mL), and Group 4 (basal C-peptide ≥1.9 ng/mL, ΔC-peptide ≥1.1 ng/mL).

    DM, diabetes mellitus; BMI, body mass index; SBP, systolic blood pressure; DBP, diastolic blood pressure; FBG, fasting blood glucose; HbA1c, hemoglobin A1c; TC, total cholesterol; HDL-C, high density lipoprotein cholesterol; LDL-C, low density lipoprotein cholesterol; GFR, glomerular filtration rate; Apo, apolipoprotein; HOMA-IR, homeostasis model assessment of insulin resistance; HOMA-β, homeostasis model assessment of β-cell function.

    Table 2 Diabetic microvascular complications by C-peptide group

    Values are presented as number (%). The four groups were defined as follows: Group 1 (basal C-peptide <1.9 ng/mL, ΔC-peptide <1.1 ng/mL), Group 2 (basal C-peptide <1.9 ng/mL, ΔC-peptide ≥1.1 ng/mL), Group 3 (basal C-peptide ≥1.9 ng/mL, ΔC-peptide <1.1 ng/mL), and Group 4 (basal C-peptide ≥1.9 ng/mL, ΔC-peptide ≥1.1 ng/mL).

    NPDR/PDR, non-proliferative/proliferative retinopathy; Micro/Overt, micro albuminuria/overt albuminuria.

    Table 3 Diabetic microvascular complications by basal and stimulated C-peptide

    Table 4 Multiple risk factors-adjusted ORs and 95% CIs in the relationship between retinopathy and basal C-peptide level

    Groups A, B, and C are composed of serial data (192 patients).

    OR, odds ratio; CI, confidence interval; DM, diabetes mellitus; HbA1c, hemoglobin A1c.

    Table 5 Multiple risk factors-adjusted ORs and 95% CIs in the relationship between retinopathy and stimulated C-peptide level

    Groups A and B are composed of serial data.

    OR, odds ratio; CI, confidence interval; DM, diabetes mellitus.

    Table 6 Multiple risk factors-adjusted ORs and 95% CIs in the relationship between neuropathy and basal C-peptide level

    Groups A and B are composed of serial data.

    OR, odds ratio; CI, confidence interval; DM, diabetes mellitus; HbA1c, hemoglobin A1c.

    Table 7 Multiple risk factors-adjusted ORs and 95% CIs in the relationship between neuropathy and stimulated C-peptide level

    Groups A and B are composed of serial data.

    OR, odds ratio; CI, confidence interval; DM, diabetes mellitus; HbA1c, hemoglobin A1c.

    Table 8 Correlation between nephropathy and multiple factors

    DM, diabetes mellitus; HbA1c, hemoglobin A1c; SBP, systolic blood pressure; FBS, fasting blood sugar.

    Yoon HJ, Cho YZ, Kim Jy, Kim BJ, Park KY, Koh GP, Lee DH, Lim DM. Correlations between Glucagon Stimulated C-peptide Levels and Microvascular Complications in Type 2 Diabetes Patients. Diabetes Metab J. 2012;36(5):379-387.
    Received: Sep 09, 2011; Accepted: May 23, 2012
    DOI: https://doi.org/10.4093/dmj.2012.36.5.379.

    Diabetes Metab J : Diabetes & Metabolism Journal
    Close layer
    TOP