
- Current
- Browse
- Collections
-
For contributors
- For Authors
- Instructions to authors
- Article processing charge
- e-submission
- For Reviewers
- Instructions for reviewers
- How to become a reviewer
- Best reviewers
- For Readers
- Readership
- Subscription
- Permission guidelines
- About
- Editorial policy
Articles
- Page Path
- HOME > Diabetes Metab J > Volume 41(2); 2017 > Article
-
Original ArticleObesity and Metabolic Syndrome Association between Blood Mercury Level and Visceral Adiposity in Adults
-
Jong Suk Park1, Kyoung Hwa Ha2,3, Ka He4, Dae Jung Kim2,3

-
Diabetes & Metabolism Journal 2017;41(2):113-120.
DOI: https://doi.org/10.4093/dmj.2017.41.2.113
Published online: December 21, 2016
1Department of Endocrinology and Metabolism, Yonsei University College of Medicine, Seoul, Korea.
2Cardiovascular and Metabolic Disease Etiology Research Center, Ajou University School of Medicine, Suwon, Korea.
3Department of Endocrinology and Metabolism, Ajou University School of Medicine, Suwon, Korea.
4Department of Epidemiology and Biostatistics, Indiana University Bloomington School of Public Health, Bloomington, IN, USA.
- Corresponding author: Dae Jung Kim. Department of Endocrinology and Metabolism, Ajou University School of Medicine, 164 World cup-ro, Yeongtong-gu, Suwon 16499, Korea. djkim@ajou.ac.kr
Copyright © 2017 Korean Diabetes Association
This is an Open Access article distributed under the terms of the Creative Commons Attribution Non-Commercial License (http://creativecommons.org/licenses/by-nc/4.0/) which permits unrestricted non-commercial use, distribution, and reproduction in any medium, provided the original work is properly cited.
ABSTRACT
-
Background
- Few studies have examined the association between mercury exposure and obesity. The aim of this study is to investigate the association between blood mercury concentrations and indices of obesity in adults.
-
Methods
- A total of 200 healthy subjects, aged 30 to 64 years, who had no history of cardiovascular or malignant disease, were examined. Anthropometric and various biochemical profiles were measured. Visceral adipose tissue (VAT) was measured using dual-energy X-ray absorptiometry (DXA).
-
Results
- All subjects were divided into three groups according to blood mercury concentrations. Compared with the subjects in the lowest tertile of mercury, those in the highest tertile were more likely to be male; were current alcohol drinkers and smokers; had a higher body mass index (BMI), waist circumference (WC), and VAT; had higher levels of blood pressure, fasting glucose, and insulin resistance; and consumed more fish. The blood mercury concentration was significantly associated with anthropometric parameters, showing relationships with BMI, WC, and VAT. After adjusting for multiple risk factors, the odds ratios (ORs) for high mercury concentration was significantly higher in the highest VAT tertile than in the lowest VAT tertile (OR, 2.66; 95% confidence interval, 1.05 to 6.62; P<0.05).
-
Conclusion
- The blood mercury concentration was significantly associated with VAT in healthy adults. Further studies are warranted to confirm our findings.
- There has been a growing concern regarding the environmental and health effects of heavy metals. In particular, mercury is one of the most dangerous heavy metals and has been reported to increase oxidative stress and vascular inflammation [1]. Recently, some studies investigating the metabolic effects of mercury exposure had controversial findings. Several studies have suggested that mercury exposure plays a role in the induction or exacerbation of chronic metabolic diseases such as diabetes mellitus, metabolic syndrome (MetS), and cardiovascular disease [2345], whereas other studies have reported conflicting results [678910].
- Although multiple studies demonstrate an association between mercury exposure and individual MetS components, there is a lack of data indicating the interrelation between mercury exposure and obesity. Some animal studies have suggested that blood mercury concentration is associated with obesity [1112], which is a well-known risk factor for metabolic diseases. Although a few human studies have investigated the association between blood mercury level and adiposity, which is measured using body mass index (BMI) and waist circumference (WC), the findings have been inconsistent [45913]. However, BMI and WC are not direct measures of adiposity. Furthermore, to our knowledge, no study has examined the relationship between the more direct measures of adiposity and blood mercury concentration.
- Recently, a new algorithm to measure visceral adipose tissue (VAT) using dual-energy X-ray absorptiometry (DXA) instead of computer tomography (CT) and magnetic resonance imaging has been introduced, and DXA VAT has been demonstrated using volumetric CT as the reference standard [141516]. Therefore, we investigated the association between blood mercury concentration and obesity-related parameters using DXA in healthy adults.
INTRODUCTION
- Study participants
- In order to improve models predicting cardiovascular and metabolic disease, we established a multicenter population-based cohort study called the Cardiovascular and Metabolic Diseases Etiology Research Center. The details of the study design and procedures have been described previously [17].
- The study was a cross-sectional analysis of baseline data from a prospective cohort study in progress. We included 200 healthy volunteers (adults aged 30 to 64 years, residing in Suwon, Yongin, and Hwaseong, Republic of Korea) who completed baseline health examinations and were measured for heavy metals. Subjects were excluded if they were suspected of having a current acute illness or a history of malignancy. We also excluded subjects with a clinical history of cardiovascular disease and those who were pregnant. The study design, data collection, and analyses were approved by the Institutional Review Boards of the centers involved (IRB; No. AJIRB-BMR-SUR-13-272), and written informed consent was obtained from all participants.
- Questionnaire
- Personal interviews were obtained using a standard questionnaire administered by trained personnel. The questionnaire included questions about demographic characteristics, smoking habits, alcohol consumption, and medical history. We also collected dietary data, including fish intake, which was assessed using a validated interviewer-administered semiquantitative food frequency questionnaire developed for use in Korea [18]. The questionnaire listed the most frequently consumed fish in Korea: mackerel, yellow corvine, hairtail, anchovy, squid, and pickled seafood. Fish consumption frequency was categorized as rare, <1 time/month, 2 to 4 times/month, and ≥1 time/week. Smoking status was divided into two categories: non-smoker and current smoker. Alcohol consumption was reported as ‘yes’ for participants who had consumed at least one glass of alcohol every month over the last year. Regular exercise was reported as ‘yes’ if the participant performed moderate or strenuous exercise on a regular basis, regardless of whether it was indoor or outdoor exercise (for more than 30 minutes at a time and more than five times per week in the case of moderate exercise such as cycling [slow], tennis [doubles], and light weight lifting; for more than 20 minutes at a time in the case of strenuous exercise such as running, climbing, fast cycling, tennis [singles], and heavy weight lifting), or when subjects walked for more than 30 minutes at a time more than five times per week.
- Clinical characteristics
- An automatic height-weight scale (BSM330; InBody Co. Ltd., Seoul, Korea) was used to measure the height (cm) and weight (kg) to a resolution of 0.1 cm and 0.1 kg, respectively. BMI was calculated by dividing the weight (kg) by the square of the height (m2). WC was measured at the midpoint between the lower border of the rib cage and the iliac crest. The definition of abdominal obesity by WC (defined by the Korean Society for the Study of Obesity) was ≥90 cm for men and ≥85 cm for women [19]. Systolic and diastolic blood pressures (BP) were measured by an experienced technician using an automated BP monitor (HEM-7080IC; Omron Healthcare, Lake Forest, IL, USA) by placing the arm at heart level after a 5-minute rest period.
- Biochemical parameters
- Blood samples were collected from all subjects after 8 hours of fasting. Samples were immediately centrifuged, and serum samples were stored at −70℃ until analysis by biochemical assay at a central laboratory (Seoul Clinical Laboratories, Seoul, Korea). Fasting serum glucose (FSG) was measured using the colorimetric method, and fasting serum insulin was determined by means of the radioimmunoassay method. Total cholesterol, high density lipoprotein cholesterol, and triglycerides (TGs) were determined through enzymatic methods; and low density lipoprotein cholesterol was calculated according to the Friedewald formula. Insulin resistance and β-cell function were estimated from FSG and insulin using the updated homeostatic model assessment (HOMA2) calculator [20]. Blood mercury concentrations were measured using the gold amalgam method (DMA-80; Milestone, Sorisole, Italy). The limit of detection for mercury was 0.05 µg/L, and the concentrations of all samples were higher than the limit of detection. The interassay coefficient of variation for the mercury assay was 5.7%.
- Dual-energy X-ray absorptiometry
- Total body DXA was measured using the Lunar iDXA (GE Healthcare, Madison, WI, USA) instrument. Patient positioning and data acquisition were conducted in accordance with the operator's manual [14]. Visceral fat analysis was performed using CoreScan (Corescan Pty Ltd., Ascot, Australia), a software option for the assessment of visceral fat (mass in g and volume in cm3) in the android region.
- Statistical analysis
- Demographic and biochemical data are presented as either mean±standard deviation (SD), median (interquartile range), or proportion, whereas mercury concentrations are presented as geometric mean with SD. Mercury concentrations, TG, homeostasis model assessment of insulin resistance (HOMA-IR), and homeostasis model assessment of β-cell function (HOMA-β) were log transformed to correct for skewed distributions. Intergroup comparisons were performed using analysis of variance tests, and a post hoc analysis was performed with Dunnett's test. Chi-square tests were used to compare categorical variables with percentages. Spearman correlation analysis was performed for investigation of association between mercury concentration and metabolic parameters. A high mercury level was arbitrarily defined as a value greater than 5.0 µg/L, an action level above which an increased risk of adverse health effects exist [21]. Logistic regression analysis was used to explore the association between high mercury level and VAT after adjusting for other risk factors. Adjusted odds ratios (ORs) and corresponding 95% confidence intervals (CIs) were estimated using multivariate logistic regression analysis models. The SPSS version 20.0 (IBM Co., Armonk, NY, USA) was used for all statistical analyses. P values <0.05 were considered statistically significant.
METHODS
- Characteristics of the subjects according to blood mercury concentrations
- The subjects were divided into three groups according to blood mercury concentrations. The baseline clinical and biochemical characteristics of the study subjects are presented in Table 1. The geometric means of blood mercury concentrations across tertiles were 1.90, 3.44, and 6.15 µg/L. Compared with participants in the lowest tertile of mercury, those in the highest tertile were more likely to be male; were current alcohol drinkers and smokers; had a higher BMI, WC, and VAT; and had higher levels of BP, fasting glucose, and HOMA-IR. In addition, subjects with higher mercury concentrations consumed more fish.
- Correlation between serum mercury concentrations and other variables
- In the analysis of correlations between log-transformed blood mercury and metabolic parameters, male, BMI, WC, VAT, systolic BP, diastolic BP, FSG, HOMA-IR, smoking, alcohol, and fish consumption showed correlation with blood mercury (Table 2).
- Comparisons of blood mercury concentrations according to anthropometric parameters
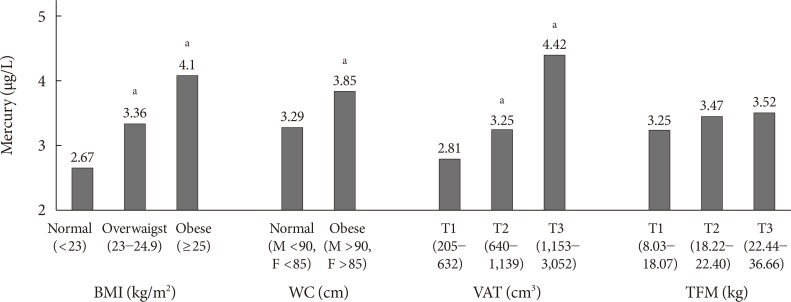
- Blood mercury concentrations in subjects were compared according to the categories of anthropometric parameters (Fig. 1). The blood mercury concentration was lowest in those with normal BMI and higher in the obese group. Centrally obese subjects had a higher concentration of blood mercury than those with normal WC. Subjects were stratified into three groups according to VAT mass, and the blood mercury concentration was significantly higher in the highest tertile compared with the lowest tertile. On the contrary, no significant difference in the blood mercury concentration was observed according to total fat mass (TFM) tertile.
- Multivariable analysis for high mercury level according to VAT
- Table 3 presents the ORs and 95% CIs for a high mercury level according to VAT tertile. In the unadjusted multivariable logistic regression analysis, when tertile 1 was set as a reference, ORs of the blood mercury concentration increased significantly according to the VAT tertile. After adjusting for confounding variables, this relationship remained statistically significant.
RESULTS
- The present study investigated the relationship between the blood mercury concentration and obesity in Korean adults and found that the blood mercury level was significantly associated with visceral adiposity after adjustment for confounding parameters. To the best of our knowledge, this is the first report on the associations between mercury concentrations in the blood and visceral adiposity based on DXA.
- Although determining the exact body accumulation of heavy metals is very difficult, blood concentrations of heavy metals are widely used as an indicator of exposure [2223]. In addition, blood mercury has been used in epidemiologic studies as a marker for mercury exposure in the general population [1324]. The geometric mean of the blood mercury concentration in this study was 3.42 µg/L. This finding is lower than that of other previous Korean studies [42526] but higher than that of previous reports from the United States and Canada [272829]. Fish consumption is one of major causes of mercury exposure [30], and fish and seafood are one of the favorite foods in Korea, which may explain why the blood mercury concentrations of the participants in this study were higher than those of adults in the United States and Canada. In addition, most enrolled subjects resided in inland areas, which may explain the lower blood mercury concentrations in this study compared with the results of other Korean studies. In this study, the blood mercury concentration tended to increase with increasing fish consumption frequency, and this finding is consistent with that of previous studies [3132]. However, further studies will be necessary to elucidate other significant contributing exposure sources.
- In our study, mercury concentrations were significantly higher in males and correlated positively with smoking status, alcohol intake, and BPs; these findings are similar to previous studies [452633]. In addition, we noted consistent increases in fasting glucose and HOMA-IR with increasing blood concentrations of mercury. Recently, several studies have reported that mercury induces an increase in insulin resistance or β-cell dysfunction [23435]. However, these findings have been inconsistent; some studies found no association between blood mercury and hyperglycemia [10]. Our results support the hypothesis that blood mercury may affect insulin resistance, and further prospective studies should be performed to establish causal inference and elucidate the mechanisms.
- Blood mercury concentrations showed significant differences according to anthropometric parameters in this study. The blood mercury concentration increased according to BMI, WC, and VAT, and these obesity indices were increased in relation to the blood mercury concentration. However, these findings differed from those of previous studies. In a study with Brazilian inhabitants, hair mercury content was not associated with BMI [36]. Further, using data from the National Health and Nutrition Examination Survey, Rothenberg et al. [13] reported that blood mercury concentrations were inversely correlated with BMI. In contrast, Cho et al. [26] showed that a higher BMI was independently associated with a higher blood mercury level.
- While BMI is an indirect measure of general adiposity, TFM is a direct measure of general adiposity. However, we did not find any association between blood mercury level and TFM. Although BMI is generally parallel to TFM (r=0.79, P<0.01 in the present results), we could not explain the reason for this discrepancy. However, adiposity can differ in patients with the same BMI.
- In addition, WC and waist-to-hip ratio are indirect measures of central adiposity, whereas VAT is a direct measure of central adiposity. In the present study, WC was significantly correlated with blood mercury levels, which is concurrent with the previous results [433343537]. Moreover, blood mercury concentrations were also significantly associated with visceral adiposity after adjusting for confounding variables. Although the mechanism of the relationship between central adiposity and the blood mercury level is not yet clear, a few possible explanations have been suggested regarding the association between heavy metal exposure and adipose tissues [3839]. First, because heavy metals tend to accumulate in adipose tissues, the amount of adipose tissue may affect heavy metal concentrations in blood. Qin et al. [40] have reported that the mercury concentration is significantly higher in visceral fat than in subcutaneous fat. In contrast, a recent in vivo investigation has observed an increase in mercury concentration in the blood of diabetic mice, but the authors suppose that body fat gain and low mercury accumulation in adipose tissue increased mercury concentrations in blood and organs in diabetic mice [12]. Second, some data have reported that obesity is accompanied by impaired biliary secretion and that persons with more body fat eliminate heavy metals more slowly than those with less body fat [4142]. Because mercury is excreted mainly in the feces by processes of biliary excretion, impaired mercury excretion is one possible mechanism for this association [43]. Therefore, although the mechanism underlying the relationship of blood mercury level and central obesity is not completely understood, VAT might play an important role in blood mercury concentration. Taken together, our findings suggest that high visceral fat mass levels should be considered as a confounding factor when blood mercury is used as an indicator of exposure.
- Several limitations of our study need to be considered. First, cross-sectional design cannot determine whether there was a causal relationship between mercury concentrations and visceral adiposity. Second, our study population was relatively small. More prospective large-population studies are necessary to confirm the relationship. Third, the mercury exposure was evaluated using a single blood sample measurement. Despite these limitations, our results are meaningful because a significant association between the blood mercury level and VAT was found.
- In conclusion, we demonstrated that the blood mercury concentration was significantly associated with VAT in adults. Further prospective large-scale studies are required to elucidate the mechanism behind the relationship between mercury exposure and obesity index.
DISCUSSION
-
Acknowledgements
- This study was supported by a grant from the Korean Health Technology R&D Project, Ministry of Health and Welfare, Korea (HI13C0715).
ACKNOWLEDGMENTS
-
CONFLICTS OF INTEREST: No potential conflict of interest relevant to this article was reported.
NOTES
- 1. Houston MC. Role of mercury toxicity in hypertension, cardiovascular disease, and stroke. J Clin Hypertens (Greenwich) 2011;13:621-627. ArticlePubMedPMC
- 2. He K, Xun P, Liu K, Morris S, Reis J, Guallar E. Mercury exposure in young adulthood and incidence of diabetes later in life: the CARDIA Trace Element Study. Diabetes Care 2013;36:1584-1589. PubMedPMC
- 3. Sargis RM. The hijacking of cellular signaling and the diabetes epidemic: mechanisms of environmental disruption of insulin action and glucose homeostasis. Diabetes Metab J 2014;38:13-24. ArticlePubMedPMC
- 4. Eom SY, Choi SH, Ahn SJ, Kim DK, Kim DW, Lim JA, Choi BS, Shin HJ, Yun SW, Yoon HJ, Kim YM, Hong YS, Yun YW, Sohn SJ, Kim H, Park KS, Pyo HS, Kim H, Oh SY, Kim J, Lee SA, Ha M, Kwon HJ, Park JD. Reference levels of blood mercury and association with metabolic syndrome in Korean adults. Int Arch Occup Environ Health 2014;87:501-513. ArticlePubMedPDF
- 5. Kim YN, Kim YA, Yang AR, Lee BH. Relationship between blood mercury level and risk of cardiovascular diseases: results from the Fourth Korea National Health and Nutrition Examination Survey (KNHANES IV) 2008-2009. Prev Nutr Food Sci 2014;19:333-342. ArticlePubMedPMC
- 6. Futatsuka M, Kitano T, Wakamiya J. An epidemiological study on diabetes mellitus in the population living in a methyl mercury polluted area. J Epidemiol 1996;6:204-208. ArticlePubMed
- 7. Yoshizawa K, Rimm EB, Morris JS, Spate VL, Hsieh CC, Spiegelman D, Stampfer MJ, Willett WC. Mercury and the risk of coronary heart disease in men. N Engl J Med 2002;347:1755-1760. ArticlePubMed
- 8. Lee BK, Kim Y. Blood cadmium, mercury, and lead and metabolic syndrome in South Korea: 2005-2010 Korean National Health and Nutrition Examination Survey. Am J Ind Med 2013;56:682-692. ArticlePubMed
- 9. Rhee SY, Hwang YC, Woo JT, Sinn DH, Chin SO, Chon S, Kim YS. Blood lead is significantly associated with metabolic syndrome in Korean adults: an analysis based on the Korea National Health and Nutrition Examination Survey (KNHANES), 2008. Cardiovasc Diabetol 2013;12:9ArticlePubMedPMCPDF
- 10. Moon SS. Additive effect of heavy metals on metabolic syndrome in the Korean population: the Korea National Health and Nutrition Examination Survey (KNHANES) 2009-2010. Endocrine 2014;46:263-271. ArticlePubMedPDF
- 11. Vahter ME, Mottet NK, Friberg LT, Lind SB, Charleston JS, Burbacher TM. Demethylation of methyl mercury in different brain sites of Macaca fascicularis monkeys during long-term subclinical methyl mercury exposure. Toxicol Appl Pharmacol 1995;134:273-284. ArticlePubMed
- 12. Yamamoto M, Yanagisawa R, Motomura E, Nakamura M, Sakamoto M, Takeya M, Eto K. Increased methylmercury toxicity related to obesity in diabetic KK-Ay mice. J Appl Toxicol 2014;34:914-923. ArticlePubMed
- 13. Rothenberg SE, Korrick SA, Fayad R. The influence of obesity on blood mercury levels for U.S. non-pregnant adults and children: NHANES 2007-2010. Environ Res 2015;138:173-180. ArticlePubMedPMC
- 14. Lin H, Yan H, Rao S, Xia M, Zhou Q, Xu H, Rothney MP, Xia Y, Wacker WK, Ergun DL, Zeng M, Gao X. Quantification of visceral adipose tissue using lunar dual-energy X-ray absorptiometry in Asian Chinese. Obesity (Silver Spring) 2013;21:2112-2117. ArticlePubMed
- 15. Rothney MP, Catapano AL, Xia J, Wacker WK, Tidone C, Grigore L, Xia Y, Ergun DL. Abdominal visceral fat measurement using dual-energy X-ray: association with cardiometabolic risk factors. Obesity (Silver Spring) 2013;21:1798-1802. ArticlePubMed
- 16. Kaul S, Rothney MP, Peters DM, Wacker WK, Davis CE, Shapiro MD, Ergun DL. Dual-energy X-ray absorptiometry for quantification of visceral fat. Obesity (Silver Spring) 2012;20:1313-1318. ArticlePubMedPMCPDF
- 17. Kim HJ, Kim YG, Park JS, Ahn YH, Ha KH, Kim DJ. Association between blood glucose level derived using the oral glucose tolerance test and glycated hemoglobin level. Korean J Intern Med 2016;31:535-542. ArticlePubMedPMCPDF
- 18. Yun SH, Shim JS, Kweon S, Oh K. Development of a food frequency questionnaire for the Korea National Health and Nutrition Examination Survey: data from the Fourth Korea National Health and Nutrition Examination Survey (KNHANES IV). Korean J Nutr 2013;46:186-196.Article
- 19. Lee S, Park HS, Kim SM, Kwon HS, Kim DY, Kim DJ, Cho GJ, Han JH, Kim SR, Park CY, Oh SJ, Lee CB, Kim KS, Oh SW, Kim YS, Choi WH, Yoo HJ. Cut-off points of waist circumference for defining abdominal obesity in the Korean population. Korean J Obes 2006;15:1-9.
- 20. Levy JC, Matthews DR, Hermans MP. Correct homeostasis model assessment (HOMA) evaluation uses the computer program. Diabetes Care 1998;21:2191-2192. ArticlePubMedPDF
- 21. Schulz C, Angerer J, Ewers U, Kolossa-Gehring M. The German human biomonitoring commission. Int J Hyg Environ Health 2007;210:373-382. ArticlePubMed
- 22. Gallagher CM, Meliker JR. Blood and urine cadmium, blood pressure, and hypertension: a systematic review and meta-analysis. Environ Health Perspect 2010;118:1676-1684. ArticlePubMedPMC
- 23. Park S, Lee BK. Body fat percentage and hemoglobin levels are related to blood lead, cadmium, and mercury concentrations in a Korean adult population (KNHANES 2008-2010). Biol Trace Elem Res 2013;151:315-323. ArticlePubMedPDF
- 24. Mortensen ME, Caudill SP, Caldwell KL, Ward CD, Jones RL. Total and methyl mercury in whole blood measured for the first time in the U.S. population: NHANES 2011-2012. Environ Res 2014;134:257-264. ArticlePubMedPMC
- 25. Kim NS, Lee BK. National estimates of blood lead, cadmium, and mercury levels in the Korean general adult population. Int Arch Occup Environ Health 2011;84:53-63. ArticlePubMedPDF
- 26. Cho S, Jacobs DR Jr, Park K. Population correlates of circulating mercury levels in Korean adults: the Korea National Health and Nutrition Examination Survey IV. BMC Public Health 2014;14:527ArticlePubMedPMCPDF
- 27. Mahaffey KR, Clickner RP, Bodurow CC. Blood organic mercury and dietary mercury intake: National Health and Nutrition Examination Survey, 1999 and 2000. Environ Health Perspect 2004;112:562-570. ArticlePubMedPMC
- 28. Caldwell KL, Mortensen ME, Jones RL, Caudill SP, Osterloh JD. Total blood mercury concentrations in the U.S. population: 1999-2006. Int J Hyg Environ Health 2009;212:588-598. ArticlePubMed
- 29. Wong SL, Lye EJ. Lead, mercury and cadmium levels in Canadians. Health Rep 2008;19:31-36.
- 30. Lincoln RA, Shine JP, Chesney EJ, Vorhees DJ, Grandjean P, Senn DB. Fish consumption and mercury exposure among Louisiana recreational anglers. Environ Health Perspect 2011;119:245-251. ArticlePubMed
- 31. Mahaffey KR, Clickner RP, Jeffries RA. Adult women's blood mercury concentrations vary regionally in the United States: association with patterns of fish consumption (NHANES 1999-2004). Environ Health Perspect 2009;117:47-53. ArticlePubMed
- 32. Smith KM, Barraj LM, Kantor M, Sahyoun NR. Relationship between fish intake, n-3 fatty acids, mercury and risk markers of CHD (National Health and Nutrition Examination Survey 1999-2002). Public Health Nutr 2009;12:1261-1269. ArticlePubMed
- 33. You CH, Kim BG, Kim JM, Yu SD, Kim YM, Kim RB, Hong YS. Relationship between blood mercury concentration and waist-to-hip ratio in elderly Korean individuals living in coastal areas. J Prev Med Public Health 2011;44:218-225. ArticlePubMed
- 34. Kim KN, Park SJ, Choi B, Joo NS. Blood mercury and insulin resistance in nondiabetic Koreans (KNHANES 2008-2010). Yonsei Med J 2015;56:944-950. ArticlePubMedPMC
- 35. Chang JW, Chen HL, Su HJ, Liao PC, Guo HR, Lee CC. Simultaneous exposure of non-diabetics to high levels of dioxins and mercury increases their risk of insulin resistance. J Hazard Mater 2011;185:749-755. ArticlePubMed
- 36. Barbosa AC, Jardim W, Dórea JG, Fosberg B, Souza J. Hair mercury speciation as a function of gender, age, and body mass index in inhabitants of the Negro River basin, Amazon, Brazil. Arch Environ Contam Toxicol 2001;40:439-444. ArticlePubMedPDF
- 37. Bae S, Park SJ, Yeum KJ, Choi B, Kim YS, Joo NS. Cut-off values of blood mercury concentration in relation to increased body mass index and waist circumference in Koreans. J Investig Med 2016;64:867-871.ArticlePubMedPDF
- 38. Kawakami T, Hanao N, Nishiyama K, Kadota Y, Inoue M, Sato M, Suzuki S. Differential effects of cobalt and mercury on lipid metabolism in the white adipose tissue of high-fat diet-induced obesity mice. Toxicol Appl Pharmacol 2012;258:32-42. ArticlePubMed
- 39. Xuehui C. Accumulation of heavy metals and organochlorine pesticides in human milk and adipose tissues, and its health concerns [master's thesis]. Hong Kong: Hong Kong Baptist University; 2007.
- 40. Qin YY, Leung CK, Leung AO, Wu SC, Zheng JS, Wong MH. Persistent organic pollutants and heavy metals in adipose tissues of patients with uterine leiomyomas and the association of these pollutants with seafood diet, BMI, and age. Environ Sci Pollut Res 2010;17:229-240.ArticlePDF
- 41. Brzoska MM, Moniuszko-Jakoniuk J. Interactions between cadmium and zinc in the organism. Food Chem Toxicol 2001;39:967-980. ArticlePubMed
- 42. Michalek JE, Pirkle JL, Caudill SP, Tripathi RC, Patterson DG Jr, Needham LL. Pharmacokinetics of TCDD in veterans of operation ranch hand: 10-year follow-up. J Toxicol Environ Health 1996;47:209-220. ArticlePubMed
- 43. Skalnaya MG, Tinkov AA, Demidov VA, Serebryansky EP, Nikonorov AA, Skalny AV. Hair toxic element content in adult men and women in relation to body mass index. Biol Trace Elem Res 2014;161:13-19. ArticlePubMedPDF
REFERENCES
Blood mercury concentrations according to anthropometric parameters. BMI, body mass index; WC, waist circumference; VAT, visceral adipose tissue; TFM, total fat mass. aP<0.05 vs. the lowest group.
Characteristics of the study subjects according to blood mercury concentrations
Values are presented as mean±standard deviation, number (%), or median (interquartile range). Analysis of variance or chi-square test was applied to compare among groups.
BMI, body mass index; WC, waist circumference; VAT, visceral adipose tissue; TFM, total fat mass; SBP, systolic blood pressure; DBP, diastolic blood pressure; FSG, fasting serum glucose; TC, total cholesterol; TG, triglyceride; LDL-C, low density lipoprotein cholesterol; HDL-C, high density lipoprotein cholesterol; HOMA-IR, homeostasis model assessment of insulin resistance; HOMA-β, homeostasis model assessment of β-cell function.
aGeometric mean±standard deviation, bSmoking status was divided into two categories: non-smoker and current smoker, cAlcohol consumption was indicated as ‘yes’ for participants who had consumed at least one glass of alcohol every month over the last year, dRegular exercise was indicated as ‘yes’ when the participant performed moderate or strenuous exercise on a regular basis, regardless of indoor or outdoor exercise.
Correlation between blood mercury concentrations and other variables
Mercury, TG, HOMA-IR, and HOMA-β were log transformed. Smoking, alcohol consumption, exercise and fish consumption were divided into two categories: yes or no. Spearman correlation analysis was used.
BMI, body mass index; WC, waist circumference; VAT, visceral adipose tissue; TFM, total fat mass; SBP, systolic blood pressure; DBP, diastolic blood pressure; FSG, fasting serum glucose; TC, total cholesterol; TG, triglyceride; LDL-C, low density lipoprotein cholesterol; HDL-C, high density lipoprotein cholesterol; HOMA-IR, homeostasis model assessment of insulin resistance; HOMA-β, homeostasis model assessment of β-cell function.
Odds ratios and 95% confidence intervals for high mercury concentrations according to VAT tertile
Adjusted odds ratios and corresponding 95% confidence intervals were estimated using multivariate logistic regression analysis models. High mercury concentration was defined as >5 µg/L.
VAT, visceral adipose tissue.
aModel 1: unadjusted, bModel 2: adjustment for age, gender, smoking, alcohol consumption, body mass index, fasting serum glucose, systolic blood pressure, diastolic blood pressure, homeostasis model assessment of insulin resistance, and fish consumption.
Figure & Data
References
Citations
- Exposure to Metal Mixtures and Overweight or Obesity Among Chinese Adults
Gaojie Fan, Qing Liu, Mingyang Wu, Jianing Bi, Xiya Qin, Qing Fang, Zhengce Wan, Yongman Lv, Youjie Wang, Lulu Song
Biological Trace Element Research.2023; 201(8): 3697. CrossRef - Methylmercury drives lipid droplet formation and adipokine expression during the late stages of adipocyte differentiation in 3T3-L1 cells
Yasukazu Takanezawa, Yui Kashiwano, Ryosuke Nakamura, Yuka Ohshiro, Shimpei Uraguchi, Masako Kiyono
Toxicology.2023; 486: 153446. CrossRef - Expression Profiling of Adipogenic and Anti-Adipogenic MicroRNA Sequences following Methylmercury Exposure in Caenorhabditis elegans
Giancarlo Garofalo, Tyson Nielsen, Samuel Caito
Toxics.2023; 11(11): 934. CrossRef - Report of the Scientific Committee of the Spanish Agency for Food Safety and Nutrition (AESAN) on the available evidence in relation to the potential obesogenic activity of certain chemical compounds that may be present in foods
Ana María Rivas Velasco, Irene Bretón Lesmes, Araceli Díaz Perales, Ángel Gil Izquierdo, María José González Muñoz, Victoria Moreno Arribas, María del Puy Portillo Baquedano, Silvia Pichardo Sánchez
Food Risk Assess Europe.2023;[Epub] CrossRef - Lead, mercury, and cadmium exposures are associated with obesity but not with diabetes mellitus: Korean National Environmental Health Survey (KoNEHS) 2015–2017
Min Kyong Moon, Inae Lee, Aram Lee, Hyunwoong Park, Min Joo Kim, Sunmi Kim, Yoon Hee Cho, Sooyeon Hong, Jiyoung Yoo, Gi Jeong Cheon, Kyungho Choi, Young Joo Park, Jeongim Park
Environmental Research.2022; 204: 111888. CrossRef - The Effect of Mixture of Heavy Metals on Obesity in Individuals ≥50 Years of Age
Hai Nguyen Duc, Hojin Oh, Min-Sun Kim
Biological Trace Element Research.2022; 200(8): 3554. CrossRef - MicroRNA Expression Influences Methylmercury-Induced Lipid Accumulation and Mitochondrial Toxicity in Caenorhabditis elegans
Tyson Nielsen, Nicole Crawford, Megan Martell, Belal Khalil, Farooq Imtiaz, Jennifer L. Newell-Caito, Samuel Caito
Chemical Research in Toxicology.2022; 35(1): 77. CrossRef - Relationship Between Serum Levels of Arsenic, Cadmium, and Mercury and Body Mass Index and Fasting Plasma Glucose in a Mexican Adult Population
Héctor Hernández-Mendoza, Héctor Edmundo Álvarez-Loredo, Elizabeth Teresita Romero-Guzmán, Darío Gaytán-Hernández, Consuelo Chang-Rueda, Israel Martínez-Navarro, Bertha Irene Juárez-Flores, María Judith Rios-Lugo
Biological Trace Element Research.2022; 200(12): 4916. CrossRef - Heavy metal-induced lipogenic gene aberration, lipid dysregulation and obesogenic effect: a review
Yang Zhou, Frank Peprah Addai, Xinshuang Zhang, Yuelin Liu, Yinfeng Wang, Feng Lin, Alex Tuffour, Jie Gu, Guangxiang Liu, Haifeng Shi
Environmental Chemistry Letters.2022; 20(3): 1611. CrossRef - Differential fat accumulation in early adulthood according to adolescent‐BMI and heavy metal exposure
Larissa Betanzos‐Robledo, Martha M. Téllez‐Rojo, Hector Lamadrid‐Figueroa, Ernesto Roldan‐Valadez, Karen E. Peterson, Erica C. Jansen, Nil Basu, Alejandra Cantoral
New Directions for Child and Adolescent Development.2022; 2022(181-182): 37. CrossRef - The Association of Mercury and ALT with Obesity in Korean Adults: Using Data from the Korea National Health and Nutrition Examination Survey for 11 Years (KNHANES 2005, 2008~2017)
Sang Shin Pyo
Korean Journal of Clinical Laboratory Science.2022; 54(3): 192. CrossRef - Plasma titanium level is positively associated with metabolic syndrome: A survey in China’s heavy metal polluted regions
Miao Huang, Jingyuan Chen, Guangyu Yan, Yiping Yang, Dan Luo, Xiang Chen, Meian He, Hong Yuan, Zhijun Huang, Yao Lu
Ecotoxicology and Environmental Safety.2021; 208: 111435. CrossRef - Relationship Between Elevated Hair Mercury Levels, Essential Element Status, and Metabolic Profile in Overweight and Obese Adults
Anatoly V. Skalny, Jung-Su Chang, Igor P. Bobrovnitsky, Philippe Yu Kopylov, Margarita G. Skalnaya, Shih-Yi Huang, Monica Maria Bastos Paoliello, Ekaterina S. Ivanova, Weu Wang, Alexey A. Tinkov
Biological Trace Element Research.2021; 199(8): 2874. CrossRef - Associations between metabolic syndrome and four heavy metals: A systematic review and meta-analysis
Ping Xu, Aiping Liu, Fengna Li, Alexey A. Tinkov, Longjian Liu, Ji-Chang Zhou
Environmental Pollution.2021; 273: 116480. CrossRef - Cadmium, lead and mercury in the blood of psoriatic and vitiligo patients and their possible associations with dietary habits
Marta Wacewicz-Muczyńska, Katarzyna Socha, Jolanta Soroczyńska, Marek Niczyporuk, Maria H. Borawska
Science of The Total Environment.2021; 757: 143967. CrossRef - Crude oil and public health issues in Niger Delta, Nigeria: Much ado about the inevitable
Orish Ebere Orisakwe
Environmental Research.2021; 194: 110725. CrossRef - Mercury in the human adrenal medulla could contribute to increased plasma noradrenaline in aging
Roger Pamphlett, Stephen Kum Jew, Philip A. Doble, David P. Bishop
Scientific Reports.2021;[Epub] CrossRef - Multiple metal exposure and obesity: A prospective cohort study of adults living along the Yangtze River, China
Qi Zhong, Qi-rong Qin, Wan-jun Yang, Jia-liu He, Jin-liang Zhu, Zhen-yu Zhu, Fen Huang
Environmental Pollution.2021; 285: 117150. CrossRef - Association between Blood Mercury Levels and Non-Alcoholic Fatty Liver Disease in Non-Obese Populations: The Korean National Environmental Health Survey (KoNEHS) 2012–2014
Yun-Jung Yang, Eun-Jung Yang, Kyongjin Park, Subin Oh, Taehyen Kim, Yeon-Pyo Hong
International Journal of Environmental Research and Public Health.2021; 18(12): 6412. CrossRef - Hair Lead, Aluminum, and Other Toxic Metals in Normal-Weight and Obese Patients with Coronary Heart Disease
Anatoly V. Skalny, Philippe Yu Kopylov, Monica M. B. Paoliello, Jung-Su Chang, Michael Aschner, Igor P. Bobrovnitsky, Jane C.-J. Chao, Jan Aaseth, Sergei N. Chebotarev, Alexey A. Tinkov
International Journal of Environmental Research and Public Health.2021; 18(15): 8195. CrossRef - Methylmercury chronic exposure affects the expression of DNA single-strand break repair genes, induces oxidative stress, and chromosomal abnormalities in young dyslipidemic APOE knockout mice
Cássia R. Roque, Letícia R. Sampaio, Mayumi N. Ito, Daniel V. Pinto, Juan S.R. Caminha, Paulo I.G. Nunes, Ramon S. Raposo, Flávia A. Santos, Cláudia C. Windmöller, Maria Elena Crespo-Lopez, Jacqueline I. Alvarez-Leite, Reinaldo B. Oriá, Ronald F. Pinheiro
Toxicology.2021; 464: 152992. CrossRef - Methylmercury-Induced Metabolic Alterations in Caenorhabditis elegans Are Diet-Dependent
Nicole Crawford, Megan Martell, Tyson Nielsen, Belal Khalil, Farooq Imtiaz, Etienne Nguidjo, Jennifer Newell-Caito, Julia Bornhorst, Tanja Schwerdtle, Samuel Caito
Toxics.2021; 9(11): 287. CrossRef - Antioxidant status in relation to heavy metals induced oxidative stress in patients with polycystic ovarian syndrome (PCOS)
Manal Abudawood, Hajera Tabassum, Atheer H. Alanazi, Fatmah Almusallam, Feda Aljaser, Mir Naiman Ali, Naif D. Alenzi, Samyah T. Alanazi, Manal A. Alghamdi, Ghadah H. Altoum, Manar A. Alzeer, Majed O. Alotaibi, Arwa Abudawood, Hazem K. Ghneim, Lulu Abdulla
Scientific Reports.2021;[Epub] CrossRef - Association of Blood Mercury Levels with the Risks of Overweight and High Waist-to-Height Ratio in Children and Adolescents: Data from the Korean National Health and Nutrition Examination Survey
Ky Young Cho
Children.2021; 8(12): 1087. CrossRef - The sex-specific effects of blood lead, mercury, and cadmium levels on hepatic steatosis and fibrosis: Korean nationwide cross-sectional study
Seung Min Chung, Jun Sung Moon, Ji Sung Yoon, Kyu Chang Won, Hyoung Woo Lee
Journal of Trace Elements in Medicine and Biology.2020; 62: 126601. CrossRef - Elevated blood mercury level has a non-linear association with infertility in U.S. women: Data from the NHANES 2013–2016
Fangfang Zhu, Chi Chen, Yingxuan Zhang, Si Chen, Xian Huang, Jingwei Li, Yanxi Wang, Xiaorong Liu, Gaopi Deng, Jie Gao
Reproductive Toxicology.2020; 91: 53. CrossRef - Methylmercury Induces Metabolic Alterations in Caenorhabditis elegans: Role for C/EBP Transcription Factor
Samuel W Caito, Jennifer Newell-Caito, Megan Martell, Nicole Crawford, Michael Aschner
Toxicological Sciences.2020; 174(1): 112. CrossRef - Association of Fish Consumption and Mercury Exposure During Pregnancy With Metabolic Health and Inflammatory Biomarkers in Children
Nikos Stratakis, David V. Conti, Eva Borras, Eduardo Sabido, Theano Roumeliotaki, Eleni Papadopoulou, Lydiane Agier, Xavier Basagana, Mariona Bustamante, Maribel Casas, Shohreh F. Farzan, Serena Fossati, Juan R. Gonzalez, Regina Grazuleviciene, Barbara He
JAMA Network Open.2020; 3(3): e201007. CrossRef - Elemental Analysis of Aging Human Pituitary Glands Implicates Mercury as a Contributor to the Somatopause
Roger Pamphlett, Stephen Kum Jew, Philip A. Doble, David P. Bishop
Frontiers in Endocrinology.2019;[Epub] CrossRef - Mercury leads to features of polycystic ovary syndrome in rats
Eduardo Merlo, Ingridy R.G. Schereider, Maylla R. Simões, Dalton V. Vassallo, Jones B. Graceli
Toxicology Letters.2019; 312: 45. CrossRef - In utero exposure to mercury and childhood overweight or obesity: counteracting effect of maternal folate status
Guoying Wang, Jessica DiBari, Eric Bind, Andrew M. Steffens, Jhindan Mukherjee, Tami R. Bartell, David C. Bellinger, Xiumei Hong, Yuelong Ji, Mei-Cheng Wang, Marsha Wills-Karp, Tina L. Cheng, Xiaobin Wang
BMC Medicine.2019;[Epub] CrossRef - Mercury Is Taken Up Selectively by Cells Involved in Joint, Bone, and Connective Tissue Disorders
Roger Pamphlett, Stephen Kum Jew
Frontiers in Medicine.2019;[Epub] CrossRef - Cohort Profile: The Cardiovascular and Metabolic Diseases Etiology Research Center Cohort in Korea
Jee-Seon Shim, Bo Mi Song, Jung Hyun Lee, Seung Won Lee, Ji Hye Park, Dong Phil Choi, Myung Ha Lee, Kyoung Hwa Ha, Dae Jung Kim, Sungha Park, Won-Woo Lee, Yoosik Youm, Eui-Cheol Shin, Hyeon Chang Kim
Yonsei Medical Journal.2019; 60(8): 804. CrossRef - Chronic mercury at low doses impairs white adipose tissue plasticity
Danize Aparecida Rizzetti, Patricia Corrales, Janaina Trindade Piagette, José Antonio Uranga-Ocio, Gema Medina-Gomez, Franck Maciel Peçanha, Dalton Valentim Vassallo, Marta Miguel, Giulia Alessandra Wiggers
Toxicology.2019; 418: 41. CrossRef - Associations of cumulative exposure to heavy metal mixtures with obesity and its comorbidities among U.S. adults in NHANES 2003–2014
Xin Wang, Bhramar Mukherjee, Sung Kyun Park
Environment International.2018; 121: 683. CrossRef - Blood mercury concentration in relation to metabolic and weight phenotypes using the KNHANES 2011–2013 data
Kayoung Lee
International Archives of Occupational and Environmental Health.2018; 91(2): 185. CrossRef - The association of total blood mercury levels and overweight among Korean adolescents: analysis of the Korean National Health and Nutrition Examination Survey (KNHANES) 2010–2013
Yi-Yeon Shin, In-Kyung Ryu, Mi-Jung Park, Shin-Hye Kim
Korean Journal of Pediatrics.2018; 61(4): 121. CrossRef - Heavy Metal Exposure and Metabolic Syndrome: Evidence from Human and Model System Studies
Antonio Planchart, Adrian Green, Cathrine Hoyo, Carolyn J. Mattingly
Current Environmental Health Reports.2018; 5(1): 110. CrossRef - Association between Blood Mercury Level and Visceral Adiposity in Adults
Seong-Su Moon
Diabetes & Metabolism Journal.2017; 41(2): 96. CrossRef
 PubReader
 Cite
Cite


