
- Current
- Browse
- Collections
-
For contributors
- For Authors
- Instructions to authors
- Article processing charge
- e-submission
- For Reviewers
- Instructions for reviewers
- How to become a reviewer
- Best reviewers
- For Readers
- Readership
- Subscription
- Permission guidelines
- About
- Editorial policy
Articles
- Page Path
- HOME > Diabetes Metab J > Volume 48(2); 2024 > Article
-
Original ArticleCardiovascular risk/Epidemiology Risk of Cardiovascular Disease according to Baseline Low-Density Lipoprotein Cholesterol Level in Different Age Groups in Korean Diabetes Population: A Cohort Study
-
Tae Kyung Yoo1*
 , Kyung-Do Han2*, Eun-Jung Rhee3, Won-Young Lee3,4
 -
Diabetes & Metabolism Journal 2024;48(2):265-278.
DOI: https://doi.org/10.4093/dmj.2022.0443
Published online: February 26, 2024
- 758 Views
- 149 Download
1Department of Medicine, MetroWest Medical Center, Framingham, MA, USA
2Department of Statistics and Actuarial Science, Soongsil University, Seoul, Korea
3Division of Endocrinology and Metabolism, Department of Internal Medicine, Kangbuk Samsung Hospital, Sungkyunkwan University School of Medicine, Seoul, Korea
4Department of Health Sciences and Technology, Samsung Advanced Institute for Health Sciences & Technology (SAIHST), Sungkyunkwan University, Seoul, Korea
-
Corresponding authors: Won-Young Lee Division of Endocrinology and Metabolism, Department of Internal Medicine, Kangbuk Samsung Hospital, Sungkyunkwan University School of Medicine, 29 Saemunan-ro, Jongno-gu, Seoul 03181, Korea E-mail: drlwy@hanmail.net
-
Eun-Jung Rhee Division of Endocrinology and Metabolism, Department of Internal Medicine, Kangbuk Samsung Hospital, Sungkyunkwan University School of Medicine, 29 Saemunan-ro, Jongno-gu, Seoul 03181, Korea E-mail: hongsiri@hanmail.net
- *Tae Kyung Yoo and Kyung-Do Han contributed equally to this study as first authors.
Copyright © 2024 Korean Diabetes Association
This is an Open Access article distributed under the terms of the Creative Commons Attribution Non-Commercial License (http://creativecommons.org/licenses/by-nc/4.0/) which permits unrestricted non-commercial use, distribution, and reproduction in any medium, provided the original work is properly cited.
ABSTRACT
-
Background
- The association between low-density lipoprotein (LDL-C) levels and cardiovascular disease (CVD) risk in different age groups within the diabetes mellitus (DM) population remains unclear. The cohort study was conducted to investigate this relationship.
-
Methods
- We assessed the 2009 to 2012 Korean National Health Screening and National Health Insurance Service records, with follow-up to the primary outcome (myocardial infarction [MI] or stroke) or December 2018. After excluding the participants with a history of MI or stroke, 2,227,394 participants with DM were included and categorized according to baseline LDL-C levels and age. Cox proportional hazards modeling was conducted. The CVD risk of age <40 years and LDL-C <70 mg/dL was set as the reference. In each age group, LDL-C <70 mg/dL was used as a reference for the subgroup analysis.
-
Results
- The cut-off LDL-C value for increased MI risk in each age group varied (<40 years old, LDL-C ≥160 mg/dL: hazard ratios [HR], 2.03; 95% confidence interval [CI], 1.644 to 2.506) (40–49-year-old, LDL-C <115 mg/dL: HR, 1.245; 95% CI, 1.04 to 1.489) (50–59-year-old, LDL-C <115 mg/dL: HR, 1.21; 95% CI, 1.014 to 1.445) (60-69-year-old, LDL-C <145 mg/dL: HR, 1.229; 95% CI, 1.022 to 1.479) (≥70 years old group, LDL-C <100 mg/dL: HR, 1.238; 95% CI, 1.018 to 1.504). The cut-off LDL-C values for increased stroke risk varied in each age subgroup (<40 years old, LDL-C ≥160 mg/dL: HR, 1.395; 95% CI, 1.094 to 1.779) (40–49-year-old, LDL-C <145 mg/dL: HR, 1.13; 95% CI, 1.019 to 1.253) (50–59-year-old, LDL-C <160 mg/dL: HR, 1.079; 95% CI, 1.008 to 1.154) (60–69-year-old, LDL-C <130 mg/dL: HR, 1.07; 95% CI, 1.022 to 1.119) (≥70 years old, LDL-C <115 mg/dL: HR, 1.064; 95% CI, 1.019 to 1.112).
-
Conclusion
- The effect of LDL-C on the risk of CVD differs depending on the age of the population with DM.
Highlights
- Atherosclerotic cardiovascular disease (ASCVD) remains the leading cause of mortality and a major contributor to disability worldwide [1]. Multiple factors contribute to ASCVD development. Factors such as age, sex, and ethnicity are considered nonmodifiable risk factors. In contrast, diabetes mellitus (DM), abnormal cholesterol level, and elevated blood pressure are manageable risk factors [2].
- Among the risk factors, DM confers at least a two-fold excess risk in ASCVD and is associated with an increased risk of premature ASCVD [3]. As obesity and metabolic syndrome are often precursors of DM, dyslipidemia is a frequent comorbidity in the population with DM [3]. This co-existing dyslipidemia in the DM population plays an additive role in ASCVD by driving plaque formation, leading to sclerosis of blood vessels, increasing arterial stiffness, and eventually increasing cardiovascular disease (CVD) mortality [4]. Hence, optimal management of low-density lipoprotein cholesterol (LDL-C) levels and appropriate indications for statin treatment are crucial issues in the primary prevention of ASCVD in the DM population [5].
- The American Diabetes Association guidelines recommend moderate-intensity statin therapy for patients with diabetes aged 40 to 75 years without CVD and high-intensity statin therapy for high-risk diabetes patients aged 50 to 70 years [5]. However, this recommendation grouped a wide spectrum of age groups into one, while there is growing evidence that LDL-C levels may have a differential impact on CVD development in different age groups [6]. For more target-specific treatment, information on LDL-C levels and the risk of ASCVD in different age groups is needed; however, related studies are scarce.
- We hypothesized that there may be distinct associations between LDL-C levels and the risk of ASCVD within each age group. We conducted a large-scale cohort study in a Korean adult population to investigate the varying associations between LDL-C levels and the risk of ASCVD in different age groups among individuals with DM.
INTRODUCTION
- Study cohort
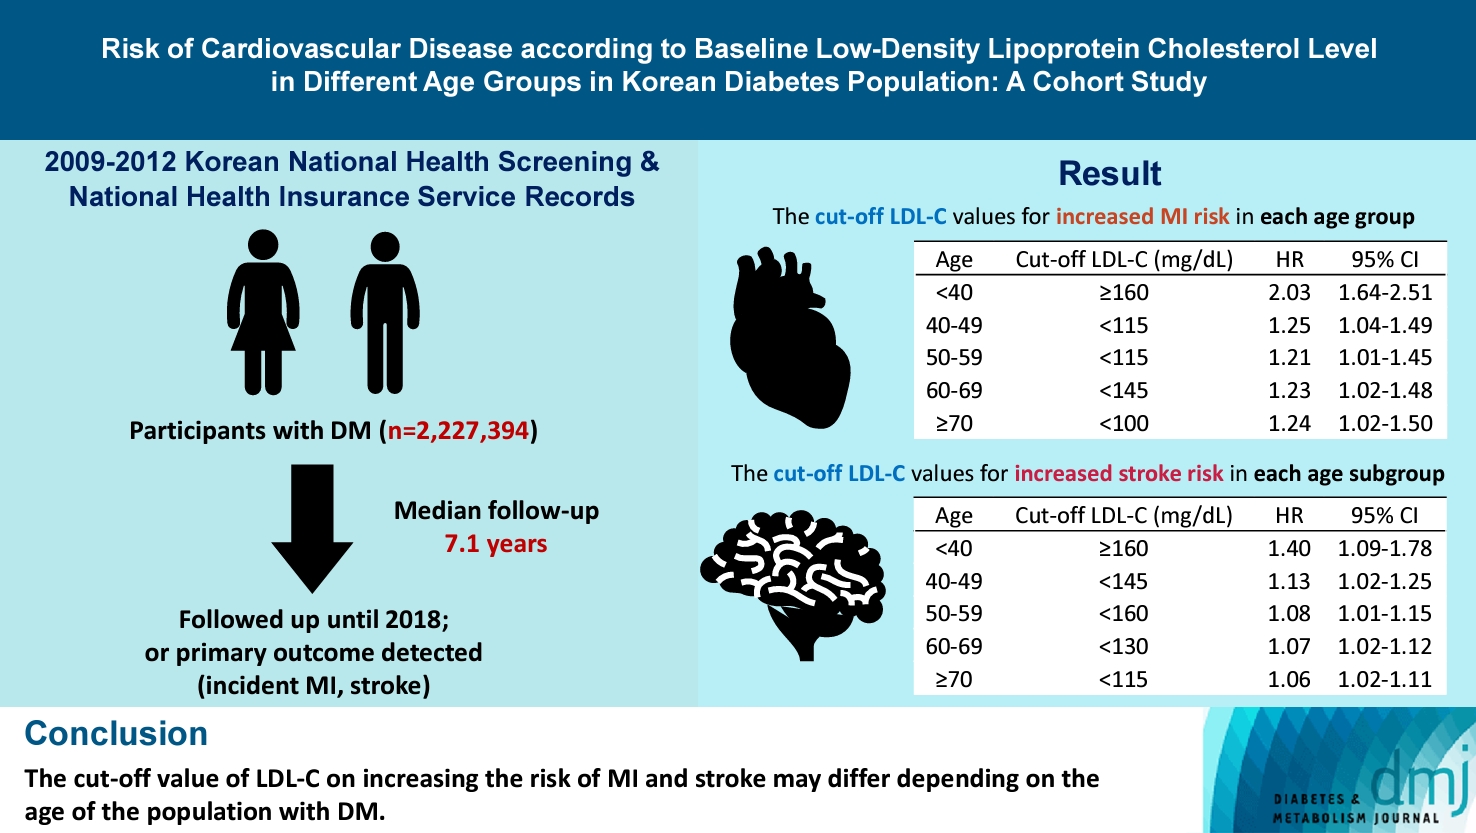
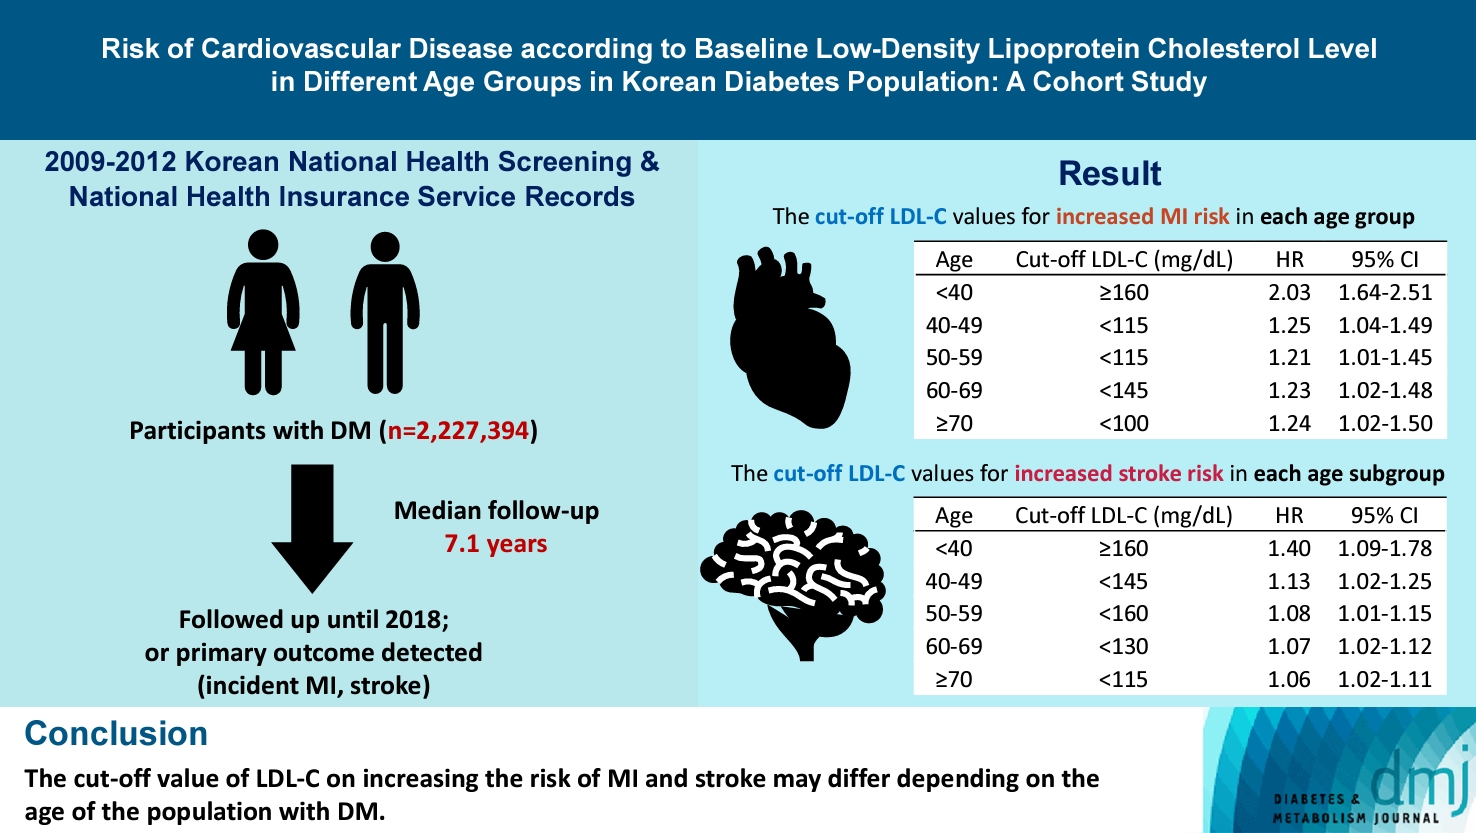
- We assessed the Korean National Health Screening (KNHS) and National Health Insurance Service (NHIS) records. The NHIS is a single-payer, mandatory program for Korean residents that covers almost 100% of the South Korean population [7]. The study population comprised Korean adults over 20 years old and included data from annual or biannual health checkups. This dataset was representative of the entire Korean population, providing a comprehensive representation of health status and risk factors across various age groups [8,9]. The study records encompassed baseline demographic information, International Classification of Diseases, 10th Revision (ICD-10) codes, treatment details, examination findings, and health screening results of the participants. This comprehensive dataset provided valuable information for population-based epidemiology and disease research platforms, facilitating a wide range of studies related to public health and disease analysis [7,8]. The Institutional Review Board (IRB) of the NHIS and Soongsil University approved this study (SSU-202003-HR-201-01) and waived the requirement for informed consent because only anonymized and de-identified data were used.
- The outcome, study inclusion and exclusion criteria
- Part of our cohort was assessed in a previous study [10]. We evaluated the data of the participants who underwent health examinations between 2009 and 2012 from the NHIS and KNHS databases. Our study specifically included individuals with DM at the baseline. The primary outcomes of interest were the occurrence of new-onset myocardial infarction (MI) or stroke during the follow-up period. To identify participants with diabetes at baseline, we applied the following criteria: (1) individuals with a fasting blood glucose level ≥126 mg/dL during a health examination and (2) those with a prescription history of antidiabetic medication and a corresponding ICD-10 code (E11–14) claim history in either the KNHS or NHIS database in the year of the health examination. Participants who met either of these criteria were considered to have DM [11,12]. MI was defined if the participants had a hospitalization record due to MI with ICD-10 codes I21 and I22. Stroke was defined as a history of hospitalization due to ischemic stroke with ICD-10 codes I63 and I64 and had an imaging finding indicating ischemic stroke. If participants met the above definitions of MI or stroke before 2009, they were considered to have a history of MI or stroke and were excluded from the analysis. The same definitions for MI and stroke were used during the follow-up period. Participants who experienced both MI and stroke during the follow-up period were counted separately for MI and stroke.
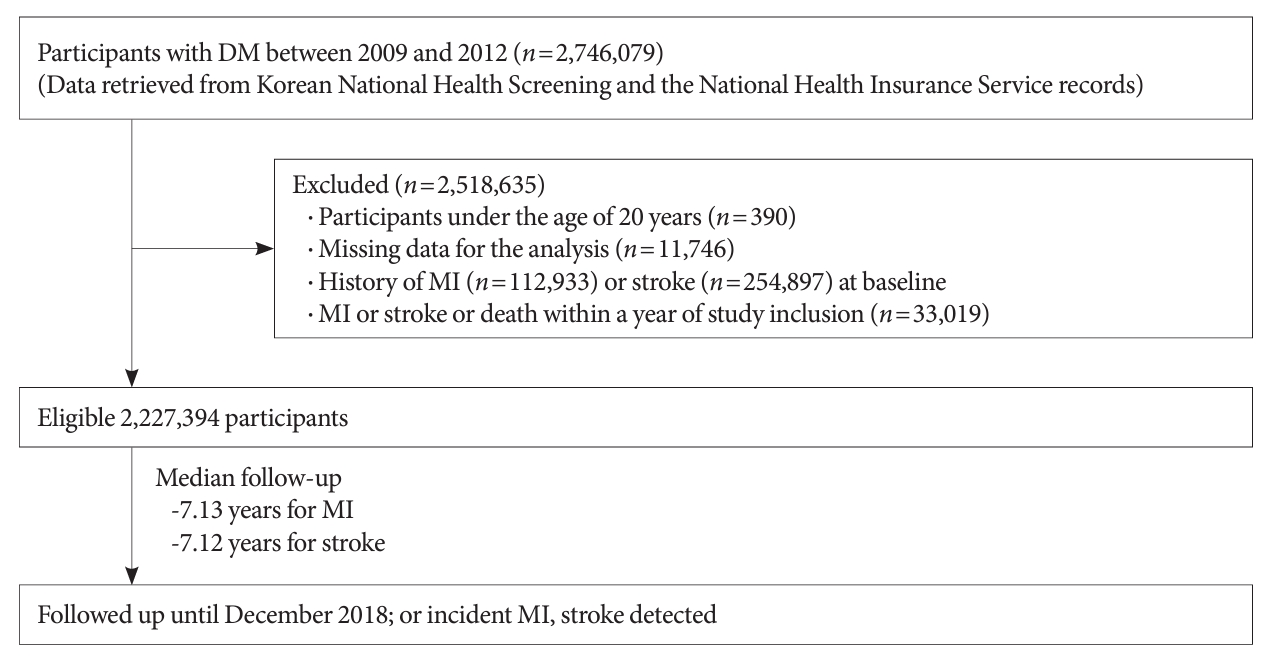
- The flow diagram of the study participants is as follows. Initially, 2,746,079 participants with DM were assessed. We excluded participants under the age of 20 years (age <20 years, n=390), those with missing data for the analysis (n=117,446), those with a diagnosis of MI or stroke before study inclusion (MI, n=112,933; stroke, n=254,897). Additionally, in order to account for a lag period, individuals diagnosed with MI or stroke within a year of study inclusion were excluded (n=33,019). Finally, 2,227,394 participants were included in the analysis (Fig. 1). Study participants were followed until the primary outcome was detected or until December 31st, 2018. The NHIS claims records were analyzed at the end of the follow-up period to determine the primary outcome.
- Data collection and measurements
- The number of oral hypoglycemic agents (OHAs) used and DM duration were analyzed by examining ICD-10 codes E11–14 claims and a history of antidiabetic medication claims before 2009. Hypertension was defined as having a record of systolic blood pressure ≥140 mm Hg, diastolic blood pressure ≥90 mm Hg, ICD codes I10–15, or an antihypertensive medication claim history [13]. Those prescribed statins in the year of health examination were defined as statin users. Trained medical personnel collected anthropometric data in a standardized manner. Body mass index (BMI) was calculated using the following formula: weight (kg) divided by height (m) squared. Waist circumference was measured as the length between the midpoint of the rib cage and the iliac crest [9]. Lifestyle information, such as smoking history, alcohol consumption, physical activity, and income, was collected by self-report using a standardized questionnaire. Blood samples were collected after fasting for at least 8 hours. Income level was categorized into quartiles, and the lowest 25 percentile of the Korean population was defined as low-income. Participants were divided into current, ex-smoker, and non-smoker groups [14]. Alcohol consumption was divided into heavy (>30 g/day), mild (≤30 g/day), and none [15]. Regular exercise was defined as more than 20 minutes of vigorous-intensity exercise at least three times per week or more than 150 minutes of moderate-intensity exercise per week [16,17]. All covariate data are based on data from the index year.
- Statistical methods
- Data are expressed as frequencies (%, categorical variables), mean±standard deviation, or geometric means (95% confidence interval [CI]) for continuous variables. The chi-square test and Student’s t-test were used to compare the means of the variables. Participants were classified into eight groups based on their baseline LDL-C levels, with intervals of 15 mg/dL, a convention previously employed in a similar study (<70, <85, <100, <115, <130, <145, <160, and ≥160 mg/dL) and five groups according to the age group (<40, 40–49, 50–59, 60–69, and ≥70 years) [18]. Cox proportional hazard modeling was conducted to calculate the risk of the primary outcome according to LDL-C levels. Hazard ratio (HR) and 95% CI were calculated. The composite analysis used individuals under 40 years old with LDL-C levels below 70 mg/dL (<70 mg/dL) as the baseline reference. Furthermore, a subgroup analysis was conducted using the reference of ASCVD risk with LDL-C <70 mg/dL for each age group to assess the impact of LDL-C levels within specific age groups. Additional subgroup analysis was conducted based on sex, hypertension, and statin use. Confounding factors (age, sex, BMI, income, smoking, drinking, regular exercise, hypertension, statin use, serum fasting glucose, DM duration, insulin use, and use of more than three types of OHAs) were adjusted in an adjusted model. As a sensitivity analysis, we performed an analysis by selecting participants who underwent LDL-C testing at the beginning of the study and had a subsequent LDL-C test after a 2-year interval. Within this selected subgroup, we calculated the average LDL-C level and conducted the same analysis accordingly. Lastly, a separate analysis was conducted to assess age’s impact in each LDL-C group. In the same LDL-C group, we estimated the risk of MI or stroke according to different age groups using the Cox proportional hazard modeling. Two-sided P values <0.05 were considered statistically significant. SAS version 9.4 (SAS Institute Inc., Cary, NC, USA) was used to conduct all statistical analyses.
- Availability of data and materials
- The datasets were derived from sources in the public domain: National Health Information Database of the NHIS, https://nhiss.nhis.or.kr/.
METHODS
- Baseline characteristics
- During the follow-up period (MI: median, 7.13 years [interquartile range, IQR, 6.01 to 8.08]; stroke: median, 7.12 years [IQR, 6.01 to 8.07]), among the 2,227,394 participants, 57,214 MI cases and 81,122 stroke cases were detected. Those who had both MI and stroke were 7,227 cases. Table 1 shows the baseline characteristics of the participants. Participants were divided into LDL-C groups according to their baseline LDL-C levels: LDL-C <70 mg/dL (n=276,130), LDL-C <85 mg/dL (n=251,936), LDL-C <100 mg/dL (n=330,253), LDL-C <115 mg/dL (n=359,671), LDL-C <130 mg/dL (n=332,435), LDL-C <145 mg/dL (n=261,853), LDL-C <160 mg/dL (n=179,963), and LDL-C ≥160 mg/dL (n=235,153). The mean age of the participants was the highest in the LDL-C <70 mg/dL group (56.32±11.99). The proportions of men (69.82%), current smoking (33.01%), heavy drinking (16.41%), hypertension (60.91%), statin use (46.21%), DM duration ≥5 years (34.84%), insulin use (10%), and ≥3 OHAs (17.65%) were highest in the LDL-C <70 mg/dL group. The LDL-C ≥160 mg/dL group had the lowest proportion of men (49.13%), smokers (23.66%), heavy drinking (7.58%), regular exercise (18.33%), DM duration ≥5 years (19.72%), insulin use (5.6%), and ≥3 OHAs (10.23%). All baseline parameters showed significant differences between the groups (P<0.0001).
- The risk of MI according to the baseline LDL-C level
- Table 2 shows the risk of MI according to LDL-C level. The LDL-C <70 mg/dL (reference), <85 mg/dL (HR, 0.976; 95% CI, 0.943 to 1.01), and <100 mg/dL (HR, 1.003; 95% CI, 0.971 to 1.036) group did not show a significant difference in the risk of MI. However, the risk of MI increased gradually from <115 mg/dL (HR, 1.056; 95% CI, 1.023 to 1.09) group to ≥160 mg/dL (HR, 1.456; 95% CI, 1.408 to 1.506).
- In the <40-year-old group, the risk of MI did not increase to an LDL-C level of 160 mg/dL. However, the LDL-C ≥160 mg/dL group showed a significantly elevated risk of MI compared with the LDL-C <70 mg/dL group (LDL-C ≥160 mg/dL: HR, 2.03; 95% CI, 1.644 to 2.506). The 40–49-year-old group and 50–59-year-old-group’s MI risk was elevated from <115 mg/dL (40–49-year-old group: HR, 1.245; 95% CI, 1.04 to 1.489; 50–59-year-old group: HR, 1.21; 95% CI, 1.014 to 1.445) compared to LDL-C<70 mg/dL in the <40-year-old-group. In the 60–69-year-old group, <145 mg/dL was the cut-off for increased MI risk (HR, 1.229; 95% CI, 1.022 to 1.479). In the ≥70-year-old-group, the risk of MI was increased in the LDL-C <100 mg/dL group (LDL-C <100 mg/dL group: HR, 1.238; 95% CI, 1.018 to 1.504) (Table 2).
- Regardless of statin use, age, sex, or hypertension, a similar trend was observed in the subgroup analysis. The risk of MI in men increased from ≥160 mg/dL in <40-year-old group. However, the women group did not show an increase in the composite risk of MI regardless of age and LDL-C level. In our subgroup analysis, the risk of MI was elevated in individuals under 40 years old with LDL-C levels of ≥ 160 mg/dL, particularly in those without statin use and with hypertension. Statin users had generally a low risk of MI compared with the reference group (<40 years old and LDL-C <70 mg/dL). In addition, patients ≥70 years old showed a tendency to increase according to LDL-C (Table 3, Supplementary Tables 1-4).
- When we conducted the same analysis using the average LDL-C level, the cut-off of LDL-C level for increased risk of MI was ≥160 for the <40-year-old group, <130 for the 40–49, 50–59, and 60–69-year-old group, <115 for ≥70-year-old group (Supplementary Table 5). Lastly, within the same LDL-C group, the influence of age on the risk of MI was mostly insignificant (Supplementary Table 6).
- The risk of stroke according to the baseline LDL-C level
- Table 4 shows the risk of stroke according to LDL-C level. LDL-C <70 mg/dL (reference), <85 mg/dL (HR, 1.001; 95% CI, 0.973 to 1.03), and <100 mg/dL (HR, 0.994; 95% CI, 0.967 to 1.021) group did not show a significant difference in the risk of stroke. However, the risk of stroke increased from <115 mg/dL (HR, 1.029; 95% CI, 1.002 to 1.056) group to ≥160 mg/dL (HR, 1.226; 95% CI, 1.191 to 1.262) gradually.
- In the <40-year-old group, the risk of stroke exhibited a distinctive J-shaped pattern. While the overall risk of stroke was generally low in this age group, it was even lower for those with LDL-C levels between 70 and 160 mg/dL. However, the risk increased significantly for individuals with LDL-C levels of 160 mg/dL or higher (LDL-C <70 mg/dL: HR, 1.000; reference; LDL-C ≥160 mg/dL: HR, 1.395; 95% CI, 1.094 to 1.779). The 40–49, 50–59, and 60–69-year-old group’s stroke risk was elevated from <70 mg/dL, compared with <40-year-old and LDL-C <70 mg/dL group (<70 mg/dL; 40–49-year-old: HR, 1.255; 95% CI, 1.036 to 1.520; 50–59-year-old: HR, 1.465; 95% CI, 1.219 to 1.762; 60–69-year-old: HR, 1.658; 95% CI, 1.375 to 2.001; ≥70-year-old: HR, 1.819; 95% CI, 1.497 to 2.209). In the subgroup analysis according to age, after the age of 40, stroke risk in each age group increased from <145, <160, <130, and <115 mg/dL for the 40–49, 50–59, 60–69, ≥70-year-old groups, respectively, compared to the LDL-C <70 mg/dL group in each age group. Overall, in the same age group, the risk of stroke was increased at the lower level of LDL-C as the participants aged, except for the 50–59-year-old group.
- Regardless of sex, hypertension, or statin use, a similar trend was observed in the subgroup analysis. The statin use and the hypertension subgroups showed a lower LDL-C cut-off at each age group than the no statin use and no hypertension subgroup. The risk of stroke increased from >160 mg/dL in men to >40-year-old group. However, the women group did not show an increase in the composite risk of stroke, regardless of age or LDL-C level. When we compared the risk of stroke in each age group with LDL-C <70 mg/dL as a reference, the cut-off for increased risk of stroke was >160 mg/dL in the 50–59-year-old group, <160 mg/dL in the 60–69-year-old group, and <100 mg/dL in the ≥70-year-old group (Table 5, Supplementary Tables 7-10). When we conducted the same analysis using the average LDL-C level, the cut-off of LDL-C level for increased risk of stroke was ≥160 for <40-year-old group, <130 for 40–49 and 60–69, <145 for 50–59, and <115 for ≥70-year-old group (Supplementary Table 11). Lastly, in the same LDL-C group, age showed graded associations with increased risk of stroke (Supplementary Table 12).
RESULTS
- Our study showed that the association between LDL-C levels and the risk of MI and stroke differed according to age. The cut-off value of LDL-C for increased risk of MI in the <40-year-old group was ≥160 mg/dL, but it was <115 mg/dL for the 40–49 and 50–59-year-old group, <145 mg/dL in the 60–69-year-old group, and <100 mg/dL in the ≥70-year-old group. For stroke, the cut-off value of LDL-C for an increased risk of stroke in the <40-year-old group was ≥160 mg/dL. After the age of 40 years, stroke risk increased at LDL-C levels <70 mg/dL, suggesting that the risk of stroke is more sensitive to LDL-C than that of MI. In each age subgroup, the cut-off for an increased risk of stroke was higher in the younger age group. Our study is distinct in that we utilized a substantial volume of data to uncover a graded relationship between LDL-C levels and the risk of stroke or MI according to different age groups.
- Multiple previous studies have demonstrated a graded association between cholesterol levels and ASCVD; however, only a few studies have assessed their relationship in different age groups in the DM population. Mortensen and Nordestgaard [19] assessed different age groups (aged 20 to 100 years) without a history of ASCVD or DM at baseline who were not taking statins. This study showed that an increased LDL-C level was more strongly associated with an increased absolute risk of ASCVD in the 70–100-year-old group than in the 20–69-yearold group. The authors concluded that this finding supports the idea of the cumulative burden of LDL-C over a person’s lifetime and a progressive effect on ASCVD with age [19]. This study was limited in its application as it excluded the DM population. Our study results showed a similar result, as the cut-off for MI was lower in older age groups. The cut-off for increased stroke risk in each age group (subgroup analysis) was also generally lower in older age groups, suggesting that ASCVD risk is more sensitive to LDL-C levels in older age groups compared with younger age groups in the DM population.
- Previously, using the Korean National Health Insurance System database from 2009 to 2012, Kim et al. [10] showed that the risk of CVD increased significantly with an LDL-C level of ≥70 mg/dL in those who were taking statins and LDL-C level ≥130 mg/dL in those who were not on statins in DM population, suggesting that patients with DM with LDL-C ≥130 mg/dL should be considered for statin treatment. However, the study adjusted for age as a confounding factor in the analysis, so it did not provide information about the differential impact of age on the relationship between LDL-C levels and the risk of CVD among patients with DM [10].
- For the population with DM, current guidelines recommend starting moderate-intensity statin therapy in adults aged 40 to 75 years with LDL-C ≥70 mg/dL without calculating the 10-year ASCVD risk [20]. The American Heart Association recommended an LDL-C goal of <100 mg/dL in those who are under the age of 40 years with DM and increased risk of CVD and those over the age of 40 years with one or more major CVD risk factors [21]. However, our analysis showed that the risk of ASCVD did not increase to an LDL-C level of 160 mg/dL in the <40-year-old group. In the 40–49-year-old group, the risk of MI did not increase up to <100 mg/dL group, and the relative risk of stroke did not increase up to <130 mg/dL, compared with the stroke risk of <70 mg/dL in each age group (subgroup analysis). This finding suggests that statin therapy to prevent ASCVD in the DM population should be tailored according to the age group of each patient. In the <40-year-old group, LDL-C of 160 mg/dL; in the 40–69-year-old group, LDL-C <115 mg/dL; ≥70-year-old group, LDL-C <100 mg/dL should be considered the initiation of statin treatment for the primary prevention of CVD.
- Our study showed several interesting findings. First, stroke risk was more sensitive to age than to MI. The risk of stroke was significantly higher in older age groups compared with the reference value (age <40, LDL-C <70 mg/dL), regardless of the baseline LDL-C level, confirming the previous notion that age is the strongest non-modifiable factor for stroke [22]. Therefore, we conducted a subgroup analysis using the risk of CVD with LDL-C <70 mg/dL in each age group as a reference. Second, regardless of the LDL-C level in all age groups, the statin group did not show a significant increase in composite CVD risk compared with the reference group. This may be due to the pleiotropic effects of statins [23]. Statins can exert cardiovascular protective effects independent of LDL-C lowering by inhibiting the production of isoprenoid intermediates in the cholesterol synthesis pathway [23]. Third, in the subgroup analysis of each age group in the women, the risk of CVD increased in the LDL-C >160 mg/dL groups. Fourth, notable differences were observed in the impact of LDL-C levels and age on the risk of MI compared to the risk of stroke. In the case of stroke, there was a clear trend of increasing risk with advancing age when compared to individuals under 40 years old with LDL-C levels <70 mg/dL, which differed from the risk pattern observed for MI. For those under the age of 40, the risk of stroke showed a J-shaped pattern, but it increased in individuals under 40 years old with LDL-C levels either <70 or ≥160 mg/dL. Fifth, regarding the risk of MI, it increased in men under 40 years old with LDL-C levels ≥160 mg/dL. Additionally, the risk of MI was higher in individuals under 40 years old with LDL-C levels ≥160 mg/dL who were not using statins or had hypertension. Lowering LDL-C in these specific groups may hold particular clinical importance. Furthermore, among patients aged 70 years or older, there was a tendency for the risk of MI to increase in correlation with LDL-C levels, highlighting the importance of lipid control, especially in the elderly population.
- Our study is unique in that it is one of the few major studies that assessed a wide spectrum of age groups, which were divided into multiple levels to specifically analyze the association between LDL-C level and ASCVD risk in each age group. Additionally, we defined each condition using standard diagnostic criteria. Valid information was provided through a well-established database, namely, the NHIS and KNHS databases. Standard statistical methods were used to confirm our hypothesis.
- Despite the strengths of our study, our results require cautious interpretation. First, although we adjusted for multiple confounding factors, factors such as smoking, drinking, and physical exercise might have changed during the study period. Second, since we used annual or biannual health examination data, selection bias should be considered, as those who are more cautious about their health status might be more eager to get regular examinations. However, considering the high participation rate in health examinations in South Korea, selection bias may be minimal [24-27]. Third, some of the information was provided by patient self-reports, which could have caused self-report bias. Fourth, this study involved a single ethnicity, Koreans. Fifth, it’s worth noting that the overall proportion of participants with DM duration of 5 years or more (ranging from 19.72% to 34.4%), insulin use (5.6% to 10%), and those using three or more OHA (≥3) (ranging from 10.23% to 17.65%) in each group was relatively low. This indicates that the number of patients in the advanced stages of DM was relatively small within the study population. Finally, statin use was recorded during the year of the health examination. Some participants could have started taking statins after the initial health examination when all the baseline data were collected. This may have affected our results.
- In conclusion, our study revealed that the impact of LDL-C on the risk of ASCVD varies depending on the age of the diabetic population. Furthermore, the association between LDL-C levels and ASCVD risk in diabetic patients under the age of 40 is not as pronounced as in other age groups. Specifically, in the under 40 age group, there was no significant increase in the risk of both MI and stroke until the LDL-C level reached 160 mg/dL. However, the risk of MI and stroke significantly increased in the under 40 age group with LDL-C levels of 160 mg/dL or higher, but this significance disappeared in the subgroup of individuals using statins. Lowering LDL-C levels and prescribing statins in this particular population could hold clinical significance.
DISCUSSION
SUPPLEMENTARY MATERIALS
Supplementary Table 1.
Supplementary Table 2.
Supplementary Table 3.
Supplementary Table 4.
Supplementary Table 5.
Supplementary Table 6.
Supplementary Table 7.
Supplementary Table 8.
Supplementary Table 9.
Supplementary Table 10.
Supplementary Table 11.
Supplementary Table 12.
-
CONFLICTS OF INTEREST
No potential conflict of interest relevant to this article was reported.
-
AUTHOR CONTRIBUTIONS
Conception or design: T.K.Y., E.J.R., W.Y.L.
Acquisition, analysis, or interpretation of data: K.D.H.
Drafting the work or revising: T.K.Y., E.J.R., W.Y.L.
Final approval of the manuscript: T.K.Y., E.J.R., W.Y.L.
-
FUNDING
None
NOTES
-
Acknowledgements
- We acknowledge the National Health Insurance Service (NHIS) and its employees for providing all the necessary data for this research.

Values are presented as mean±standard deviation, median (interquartile range), or number (%).
LDL-C, low-density lipoprotein cholesterol; DM, diabetes mellitus; OHA, oral hypoglycemic agent; BMI, body mass index; SBP, systolic blood pressure; DBP, diastolic blood pressure; HDL-C, high-density lipoprotein cholesterol.
- 1. Roth GA, Mensah GA, Johnson CO, Addolorato G, Ammirati E, Baddour LM, et al. Global burden of cardiovascular diseases and risk factors, 1990-2019: update from the GBD 2019 study. J Am Coll Cardiol 2020;76:2982-3021.PubMedPMC
- 2. Zibaeenejad F, Mohammadi SS, Sayadi M, Safari F, Zibaeenezhad MJ. Ten-year atherosclerosis cardiovascular disease (ASCVD) risk score and its components among an Iranian population: a cohort-based cross-sectional study. BMC Cardiovasc Disord 2022;22:162.ArticlePubMedPMCPDF
- 3. Schofield JD, Liu Y, Rao-Balakrishna P, Malik RA, Soran H. Diabetes dyslipidemia. Diabetes Ther 2016;7:203-19.ArticlePubMedPMCPDF
- 4. Hasheminasabgorji E, Jha JC. Dyslipidemia, diabetes and atherosclerosis: role of inflammation and ROS-redox-sensitive factors. Biomedicines 2021;9:1602.ArticlePubMedPMC
- 5. American Diabetes Association Professional Practice Committee. 10. Cardiovascular disease and risk management: standards of medical care in diabetes-2022. Diabetes Care 2022;45(Suppl 1):S144-74.ArticlePubMedPDF
- 6. Lind L, Sundstrom J, Arnlov J, Lampa E. Impact of aging on the strength of cardiovascular risk factors: a longitudinal study over 40 years. J Am Heart Assoc 2018;7:e007061.ArticlePubMedPMC
- 7. Song SO, Jung CH, Song YD, Park CY, Kwon HS, Cha BS, et al. Background and data configuration process of a nationwide population-based study using the Korean National Health Insurance System. Diabetes Metab J 2014;38:395-403.ArticlePubMedPMC
- 8. Rhee EJ, Kwon H, Park SE, Han KD, Park YG, Kim YH, et al. Associations among obesity degree, glycemic status, and risk of heart failure in 9,720,220 Korean adults. Diabetes Metab J 2020;44:592-601.PubMedPMC
- 9. Cho JH, Kwon HM, Park SE, Jung JH, Han KD, Park YG, et al. Protective effect of smoking cessation on subsequent myocardial infarction and ischemic stroke independent of weight gain: a nationwide cohort study. PLoS One 2020;15:e0235276.ArticlePubMedPMC
- 10. Kim MK, Han K, Joung HN, Baek KH, Song KH, Kwon HS. Cholesterol levels and development of cardiovascular disease in Koreans with type 2 diabetes mellitus and without pre-existing cardiovascular disease. Cardiovasc Diabetol 2019;18:139.ArticlePubMedPMCPDF
- 11. American Diabetes Association Professional Practice Committee. 2. Classification and diagnosis of diabetes: standards of medical care in diabetes-2022. Diabetes Care 2022;45(Suppl 1):S17-38.ArticlePubMedPDF
- 12. Hur KY, Moon MK, Park JS, Kim SK, Lee SH, Yun JS, et al. 2021 Clinical practice guidelines for diabetes mellitus of the Korean Diabetes Association. Diabetes Metab J 2021;45:461-81.PubMedPMC
- 13. Williams B, Mancia G, Spiering W, Agabiti Rosei E, Azizi M, Burnier M, et al. 2018 ESC/ESH guidelines for the management of arterial hypertension. Eur Heart J 2018;39:3021-104.PubMed
- 14. Ryan H, Trosclair A, Gfroerer J. Adult current smoking: differences in definitions and prevalence estimates: NHIS and NSDUH, 2008. J Environ Public Health 2012;2012:918368.ArticlePubMedPMCPDF
- 15. Hong JW, Noh JH, Kim DJ. The prevalence of and factors associated with high-risk alcohol consumption in Korean adults: the 2009-2011 Korea National Health and Nutrition Examination Survey. PLoS One 2017;12:e0175299.ArticlePubMedPMC
- 16. Piercy KL, Troiano RP, Ballard RM, Carlson SA, Fulton JE, Galuska DA, et al. The physical activity guidelines for Americans. JAMA 2018;320:2020-8.ArticlePubMedPMC
- 17. Bull FC, Al-Ansari SS, Biddle S, Borodulin K, Buman MP, Cardon G, et al. World Health Organization 2020 guidelines on physical activity and sedentary behaviour. Br J Sports Med 2020;54:1451-62.ArticlePubMedPMC
- 18. Kim YG, Jeong JH, Han KD, Roh SY, Min K, Lee HS, et al. Association between low-density lipoprotein cholesterol and sudden cardiac arrest in people with diabetes mellitus. Cardiovasc Diabetol 2023;22:36.ArticlePubMedPMCPDF
- 19. Mortensen MB, Nordestgaard BG. Elevated LDL-C cholesterol and increased risk of myocardial infarction and atherosclerotic cardiovascular disease in individuals aged 70-100 years: a contemporary primary prevention cohort. Lancet 2020;396:1644-52.PubMed
- 20. Grundy SM, Stone NJ, Bailey AL, Beam C, Birtcher KK, Blumenthal RS, et al. 2018 AHA/ACC/AACVPR/AAPA/ABC/ACPM/ADA/AGS/APhA/ASPC/NLA/PCNA guideline on the management of blood cholesterol: executive summary: a report of the American College of Cardiology/American Heart Association task force on clinical practice guidelines. Circulation 2019;139:e1046-81.PubMed
- 21. Buse JB, Ginsberg HN, Bakris GL, Clark NG, Costa F, Eckel R, et al. Primary prevention of cardiovascular diseases in people with diabetes mellitus: a scientific statement from the American Heart Association and the American Diabetes Association. Circulation 2007;115:114-26.ArticlePubMedPDF
- 22. Roy-O’Reilly M, McCullough LD. Age and sex are critical factors in ischemic stroke pathology. Endocrinology 2018;159:3120-31.ArticlePubMedPMCPDF
- 23. Oesterle A, Laufs U, Liao JK. Pleiotropic effects of statins on the cardiovascular system. Circ Res 2017;120:229-43.ArticlePubMedPMC
- 24. Shin DW, Cho J, Park JH, Cho B. National general health screening program in Korea: history, current status, and future direction. Precis Future Med 2022;6:9-31.ArticlePDF
- 25. Kang YJ, Myong JP, Eom H, Choi B, Park JH, L Kim EA. The current condition of the workers’ general health examination in South Korea: a retrospective study. Ann Occup Environ Med 2017;29:6.ArticlePubMedPMCPDF
- 26. Kim YS, Ho SH. Factors associated with lack of health screening among people with disabilities using Andersen’s behavioral model. Healthcare (Basel) 2023;11:656.ArticlePubMedPMC
- 27. Kang HT. Current status of the national health screening programs in South Korea. Korean J Fam Med 2022;43:168-73.ArticlePubMedPMCPDF
REFERENCES
Figure & Data
References
Citations
 PubReader
 ePub Link
 Cite
Cite- Figure
-
- Related articles
-
- Association between Low-Density Lipoprotein Cholesterol Level and Cardiovascular Outcomes in Korean Adults: A Nationwide Cohort Study
- Cardiovascular Outcomes according to Comorbidities and Low-Density Lipoprotein Cholesterol in Korean People with Type 2 Diabetes Mellitus
- Optimal Low-Density Lipoprotein Cholesterol Level for Primary Prevention in Koreans with Type 2 Diabetes Mellitus
- Myocardial Infarction, Stroke, and All-Cause Mortality according to Low-Density Lipoprotein Cholesterol Level in the Elderly, a Nationwide Study


