- Current
- Browse
- Collections
-
For contributors
- For Authors
- Instructions to authors
- Article processing charge
- e-submission
- For Reviewers
- Instructions for reviewers
- How to become a reviewer
- Best reviewers
- For Readers
- Readership
- Subscription
- Permission guidelines
- About
- Editorial policy
Articles
- Page Path
- HOME > Diabetes Metab J > Ahead-of print > Article
-
Original ArticleLifestyle Associations of Ultra-Processed Food Intake with Body Fat and Skeletal Muscle Mass by Sociodemographic Factors
-
Sukyoung Jung1
 , Jaehee Seo1, Jee Young Kim2, Sohyun Park3,4
 -
DOI: https://doi.org/10.4093/dmj.2023.0335
Published online: February 2, 2024
- 1,303 Views
- 79 Download
1Biomedical Research Institute, Chungnam National University Hospital, Daejeon, Korea
2National Food Safety Information Service, Seoul, Korea
3Department of Food Science and Nutrition, Hallym University, Chuncheon, Korea
4The Korean Institute of Nutrition, Hallym University, Chuncheon, Korea
- Corresponding author: Sukyoung Jung Biomedical Research Institute, Chungnam National University Hospital, 282 Munhwa-ro, Jung-gu, Daejeon 35015, Korea E-mail: sukyoung_jung@gwu.edu
Copyright © 2024 Korean Diabetes Association
This is an Open Access article distributed under the terms of the Creative Commons Attribution Non-Commercial License (http://creativecommons.org/licenses/by-nc/4.0/) which permits unrestricted non-commercial use, distribution, and reproduction in any medium, provided the original work is properly cited.
ABSTRACT
-
Background
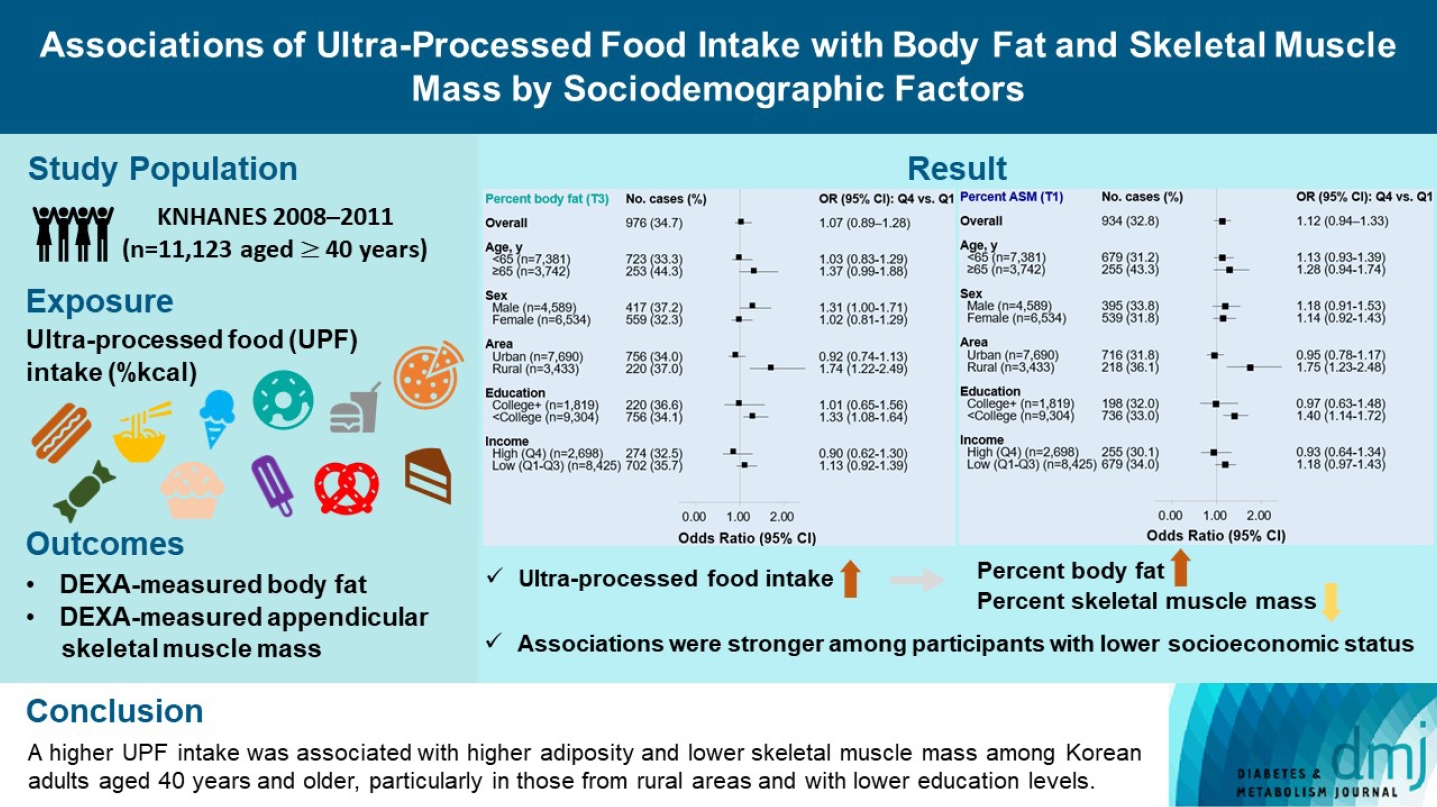
- The effects of excessive ultra-processed food (UPF) consumption on body composition measures or sociodemographic disparities are understudied in Korea. We aimed to investigate the association of UPF intake with percent body fat (PBF) and percent appendicular skeletal muscle mass (PASM) by sociodemographic status in adults.
-
Methods
- This study used data from the Korea National Health and Nutrition Examination Survey 2008–2011 (n=11,123 aged ≥40 years). We used a NOVA system to classify all foods reported in a 24-hour dietary recall, and the percentage of energy intake (%kcal) from UPFs was estimated. PBF and PASM were measured by dual-energy X-ray absorptiometry. Tertile (T) 3 of PBF indicated adiposity and T1 of PASM indicated low skeletal muscle mass, respectively. Multinomial logistic regression models were used to estimate odds ratios (OR) with 95% confidence interval (CI) after adjusting covariates.
-
Results
- UPF intake was positively associated with PBF-defined adiposity (ORper 10% increase, 1.04; 95% CI, 1.002 to 1.08) and low PASM (ORper 10% increase, 1.05; 95% CI, 1.01 to 1.09). These associations were stronger in rural residents (PBF: ORper 10% increase, 1.14; 95% CI, 1.06 to 1.23; PASM: ORper 10% increase, 1.15; 95% CI, 1.07 to 1.23) and not college graduates (PBF: ORper 10% increase, 1.06; 95% CI, 1.02 to 1.11; PASM: ORper 10% increase, 1.07; 95% CI, 1.03 to 1.12) than their counterparts.
-
Conclusion
- A higher UPF intake was associated with higher adiposity and lower skeletal muscle mass among Korean adults aged 40 years and older, particularly in those from rural areas and with lower education levels.
Highlights
- It is well established that obesity is a strong predictor of a range of health problems and premature deaths in adults [1], and there has been a rising trend worldwide, including in Korea [2,3]. More importantly, changed body composition, characterized by elevation in body fat and redistributing fat into abdominal region (adiposity) and loss of skeletal muscle mass and related loss of muscle strength and performance (sarcopenia), is associated with an increased risk of cardiovascular diseases, metabolic syndrome, and diabetes [4]. Body composition has been assessed directly through medical imaging modalities (e.g., dual-energy X-ray absorptiometry [DEXA], computed tomography [CT], and magnetic resonance imaging [MRI]) or indirectly through impedance analysis and anthropometrics [5]. Among them, the body mass index (BMI) and waist circumference (WC) have been most commonly used [5]; however, they overlook the balance between body compartments (body fat and skeletal muscle), which are of great importance in health [4]. DEXA can quantify body composition more accurately than anthropometrics and is more feasible than CT or MRI [5].
- Considering the fact that unfavorable changes in body composition are a diet-related chronic condition, it is preventable by following a healthy diet [6]. In recent years, ultra-processed foods (UPFs) have received extensive attention due to their rising consumption and related negative health impacts [7]. NOVA classification, the most prominent method of food classification based on food processing levels, defines UPFs as being often energy-dense, low in some important nutrients, and high in sugar, unhealthy fat, and salt [8]. Collective evidence from meta-analyses showed that higher UPF intake is linked with a 1.26- to 1.55-fold increased risk of obesity; however, most individual studies used the BMI to define obesity [9,10].
- A few studies have measured body fat and/or lean body mass using DEXA and examined its association with UPF intake, but no consistent findings are available. A study using a Spanish older population showed a positive association between UPF intake and overweight, obesity, or metabolic syndrome [11]; another study using Brazilian young adults aged 23 to 25 showed that higher UPF intake was associated with higher percent body fat (PBF) in both males and females, but lower percent lean body mass only in females [12]; and one study using Korean adults focused on whether overall diet quality mediates the association between UPF intake and body composition and reported a null association between UPF intake and DEXA-measured visceral fat mass [13].
- Furthermore, sociodemographic disparities in UPF intake have been reported in several studies [14-19]. Although such disparities vary by country, the important message is that there are more vulnerable subgroups to UPF intake and related health outcomes. For example, males, younger adults, and urban residents are more likely to consume UPFs [18], and the prevalence of obesity in these groups is higher than in their counterparts [20]. However, no study has yet examined the possible differences in associations between UPF intake and body composition measurements among different sociodemographic statuses in Korea.
- Considering the above, this study aimed to examine the association of UPF intake with DEXA-measured PBF and percent appendicular skeletal muscle mass (PASM), as well as whether such associations differ by sociodemographic factors among Korean adults aged 40 years and older using data from the Korea National Health and Nutrition Examination Survey (KNHANES) 2008 to 2011.
INTRODUCTION
- Study population
- The KNHANES is a nationally representative and cross-sectional study performed since 1998 by the Korea Disease Control and Prevention Agency for monitoring the health and nutritional status of the civilian non-institutionalized population in Korea. For representativeness, a complex and multistage probability sampling design is utilized. KNHANES data collection components vary by survey cycle; however, it generally consists of three surveys: health interview surveys, health examination surveys, and nutrition surveys. More details of the KNHANES have been described on the KNHANES website (https://knhanes.kdca.go.kr/knhanes/main.do).
- Among 11,530 adults aged 40 years and older who participated in all three surveys and DEXA examination between 2008 and 2011, we excluded participants if they had the following conditions: being pregnant or lactating (n=2); missing or implausible energy intakes (<500 or >5,000 kcal) (n=157); missing information on covariates (n=248). The final analytic sample included 11,123 adults (4,589 males and 6,534 females) (Supplementary Fig. 1).
- Assessment of exposure: ultra-processed food intake
- Each participant’s dietary data was obtained using a 24-hour dietary recall interview in their homes 1 week after the health interviews and examinations. Participants reported the description, quantity (in units of volume), and time and place of eating all foods and beverages consumed in the previous 24 hours. The multiple-pass approach was applied to obtain an accurate food recall with the assistance of standard measuring tools. The 7th Edition of the Korean Food Composition Table of the Rural Development Administration [21] was used to estimate daily intakes of total energy and nutrients, which are publicly available on the KNHANES website.
- Food classification using NOVA system
- All consumed items at the food or ingredient level were classified by two investigators (S.J. and J.Y.K.) into one of the four NOVA food groups: unprocessed or minimally processed foods (group 1), processed culinary ingredients (group 2), processed foods (group 3), and UPFs (group 4) [8]. This study focused on UPFs, which are defined as “formulations of food substances often modified by chemical processes and then assembled into ready-to-consume hyper-palatable food and drink products using flavours, colours, emulsifiers and a myriad of other cosmetic additives [8].” Some examples of UPFs are mass-produced and packaged bread, biscuits, burgers, cakes, cookies, chocolate, candies, dumplings, ice cream, nuggets, noodles, sugar-sweetened beverages, pre-prepared dishes, and sausages.
- Applying the principle suggested by Monteiro et al. [8], we first identified the main ingredients of the food and classified them into either group 3 or group 4, depending on the extent and purpose of food processing, with a focus on the maintenance of the food matrix. For example, if someone consumed seven individual foods (bread, fried eggs, strawberry, chocolate milk, steak, banana, and sausage) during the past 24 hours, then each was classified as follows: minimally processed (strawberry and banana), processed (fried eggs and steak), or ultra-processed (bread, chocolate milk, and sausage) using a 5-digit food code. Some dish-based Korean cuisine is difficult to explicitly classify as one type because it is combined with many different specific ingredients. In such cases, we additionally considered traditional eating experiences and the preservation of natural foods’ matrix [22]. After classification, the percentage of calories (%kcal) that came from each NOVA group was estimated. The main exposure in our study was UPF intake (as % kcal from UPFs).
- Assessment of outcomes: body composition
- Body composition was measured by DEXA (Discovery-W fanbeam densitometer, Hologic Inc., Marlborough, MA, USA). Two body composition measures are the main outcomes of interest in this study: PBF (total body fat [kg]/weight×100) and PASM (weight-adjusted appendicular skeletal muscle mass [ASM], ASM/weight×100). For further analyses, these body composition measures were each scaled to their sex-specific tertile distributions, with tertile 3 of PBF indicating adiposity (≥24.5% for males; ≥36.0% for females) and tertile 1 of PASM indicating low skeletal muscle mass (<30.7% for males; <24.1% for females).
- Assessment of covariates
- Covariates included age (years), sex (male or female), residential area (urban or rural), education level (college graduate or not), monthly household income (quartiles of equivalized household income), marital status (married or not), current smoking (yes or no), current drinking (yes or no), walking exercise (yes or no), weight training (yes or no), and total energy intake (kcal/day).
- Statistical analysis
- For categorical analysis, UPF intake was divided into quartile groups. General characteristics of the study participants were presented as the weighted means and their standard errors (SEs) for continuous variables and the weighted prevalence and their SEs for categorical variables by UPF intake quartiles. To determine the significance of differences in general characteristics between UPF intake quartiles, we used an analysis of variance for continuous variables and a chi-square test for categorical variables, respectively.
- We tested departure from a linear association of UPF intake with PBF and PASM using the restricted cubic spline model fitting with three knots (5th, 50th, and 95th percentiles) [23]. The adjusted differences in two body composition measures were estimated by using the median of the lowest UPF intake quartile (1.6% kcal from UPF) as a reference. There was no evidence of a nonlinear association of UPF intake with both PBF and PASM (P for nonlinearity=0.20 for PBF; P for nonlinearity=0.37 for PASM) (Supplementary Fig. 2).
- As categorical analyses, multinomial logistic regression models were used to estimate the covariate-adjusted odds ratios (ORs) and 95% confidence intervals (CIs) for higher PBF (tertiles 2 and 3) and lower PASM (tertiles 1 and 2), comparing quartiles 2, 3, and 4 with quartile 1 of UPF intake. As continuous analyses (potential linear trends), a 10% increase in UPF intake was used to estimate ORs for higher PBF or lower PASM in multinomial logistic regression models. A multivariable-adjusted model included age, sex, residential area, education level, monthly household income level, marital status, current smoking, current drinking, walking exercise, weight training, and total energy intake. We further conducted stratified analyses to examine whether the association of UPF intake with PBF-defined adiposity and low skeletal muscle mass varied across age (<65 or ≥65 years), sex (male or female), residential area (urban or rural), education level (≥college graduate or <college graduate), and income level (quartile 4 or quartiles 1 to 3).
- Sample weights were incorporated for all analyses to account for the complex sampling design of the KNHANES using PROC SURVEY procedures in SAS software version 9.4 (SAS Institute Inc., Cary, NC, USA). The level of significance was set at 0.05 with a two-sided test.
- Ethics statement
- KNHANES was approved by the Korea Disease Control and Prevention Agency ethics review board. All participants gave written informed consent before participation in KNHANES, and all survey data were anonymized before analysis. Our study protocol was approved by the Institutional Review Board of Hallym University (HIRB-2021-087-R-CR).
METHODS
- Participant characteristics
- Table 1 shows the characteristics of participants by UPF intake quartiles. Among 11,123 participants, the median %kcal from UPFs was 1.6% in quartile 1 and 40.7% in quartile 4. A higher UPF intake was associated with younger age, urban residency, higher education, higher household income, not being married, current smoking, current drinking, less walking, more weight training, higher intakes of energy, protein, and fat, and lower carbohydrate intake.
- UPF intake in relation to PBF and PASM
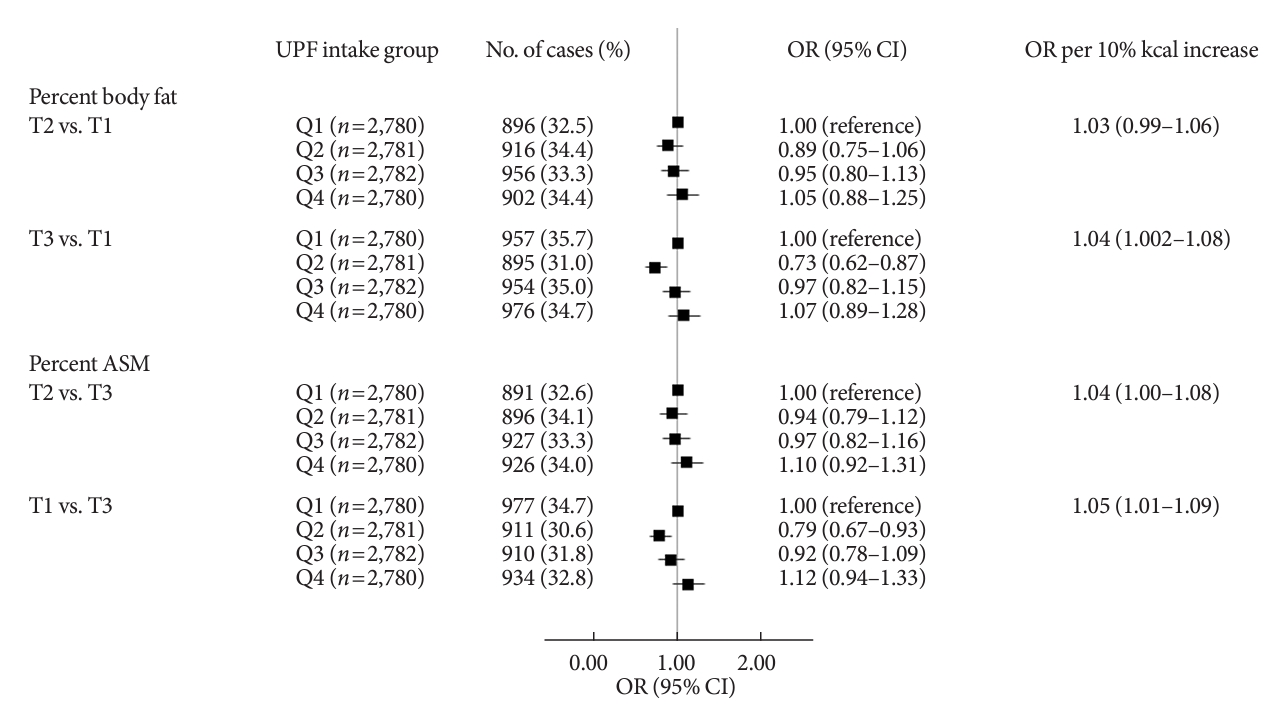
- The associations between UPF intake and PBF as well as PASM are shown in Fig. 1. When UPF intake was treated categorically, after adjusting for demographic and lifestyle covariates, UPF intake had a suggestive positive association with odds of having PBF-defined adiposity (OR Q4 vs. Q1, 1.07; 95% CI, 0.89 to 1.28) and with odds of having low PASM (OR Q4 vs. Q1, 1.12; 95% CI, 0.94 to 1.33). When UPF intake was treated continuously, a per 10% kcal increase in UPF intake was associated with a 4% higher odds of having PBF-defined adiposity (OR, 1.04; 95% CI, 1.002 to 1.08) and a 5% higher odds of having low PASM (OR, 1.05; 95% CI, 1.01 to 1.09).
- Subgroup analysis
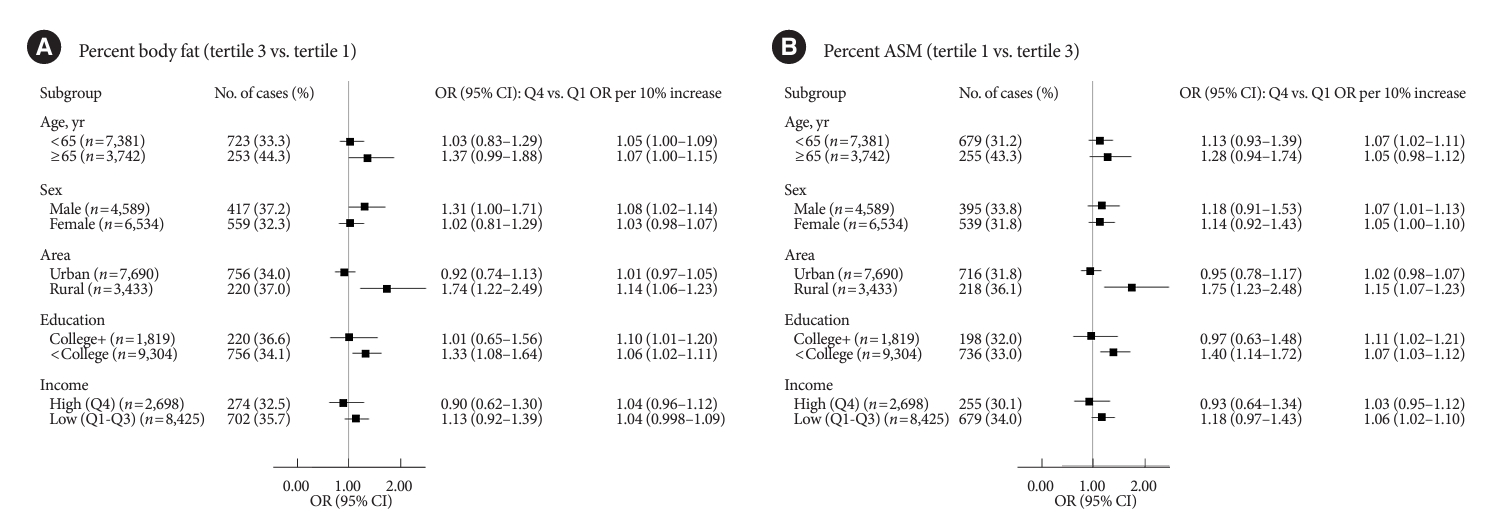
- Fig. 2 shows the stratified associations of UPF intake with PBF-defined adiposity and low PASM according to sociodemographic factors. Although there were differences in statistical significance, ORs per 10% kcal increase in UPF intake for higher PBF between age or sex subgroups were not remarkably different (<65 years 1.05 vs. ≥65 years 1.07; males 1.08 vs. females 1.03). Similar trends were observed for lower PASM (<65 years 1.07 vs. ≥65 years 1.05; males 1.07 vs. females 1.05). When stratified by residential area, UPF intake was positively associated with both PBF-defined adiposity and low PASM in rural residents but not in urban residents (urban vs. rural residents: 1.01 vs. 1.14 for higher PBF; 1.02 vs. 1.15 for lower PASM). In education-stratified analyses, adults with less than a college degree had positive associations with PBF-defined adiposity (OR Q4 vs. Q1, 1.33; 95% CI, 1.08 to 1.64; ORper 10% increase, 1.06; 95% CI, 1.02 to 1.11), but those with a college degree or higher had positive associations only when UPF intake was treated continuously (OR Q4 vs. Q1, 1.01; 95% CI, 0.65 to 1.56; ORper 10% increase, 1.10; 95% CI, 1.01 to 1.20). Similar trends were observed for the association between UPF intake and low PASM (<college graduate: OR Q4 vs. Q1, 0.97; 95% CI, 0.63 to 1.48; ORper 10% increase, 1.11; 95% CI, 1.02 to 1.21; ≥college graduate: OR Q4 vs. Q1, 1.40; 95% CI, 1.14 to 1.72; ORper 10% increase, 1.07; 95% CI, 1.03 to 1.12). ORs per 10% kcal increase in UPF intake for higher PBF or lower PASM between income levels were not remarkably different.
RESULTS
- In this nationally representative sample of Korean adults, higher %kcal from UPFs were associated with greater PBF (adiposity) and lower PASM (low muscle mass) after controlling for sociodemographic and lifestyle variables. Residential-stratified analyses showed that a significant positive association of UPF intake with PBF-defined adiposity and low ASM was observed in rural residents but not in urban residents. Education-stratified analyses showed that a stronger positive association of UPF intake with PBF-defined adiposity and low ASM was observed in those with less than a college degree than those with a college degree or above. There were no substantial differences between age groups, sexes, or income levels.
- There are purported mechanisms underlying UPF intake and adiposity. First, it is related to food choice. Relatively low pricing due to inexpensive ingredients, attractive packaging, and the hyperpalatability of UPFs might promote excessive UPF consumption, which increases total energy intake and adiposity [24]. Second, it is related to food composition (e.g., nutrients, food texture, added sugar, fat, and salt, energy density, artificial sweeteners, and additives) [24]. For example, unfavorable profiles of nutrients may increase oxidative stress and inflammation in adipose tissue (added sugar, folate) [25,26], stimulate lipogenesis, leading to visceral adipocyte hypertrophy (vitamin C, fiber) [27,28], and inhibit thermogenesis (iron, fiber) [28,29]. Indeed, our study participants in the highest UPF quartile consumed lower amounts of most nutrients (e.g., fiber, iron, vitamin C, etc.) than those in the lowest quartile (Supplementary Table 1). Thus, the given mechanisms may explain the positive association between UPF intake and adiposity in our study. Lastly, it is related to digestive processes. For example, industrial processing may disrupt food matrices, which leads to reduced effort in oral processing, decreased oral transit time, and an increased eating rate [24,30].
- We observed a positive association between UPF intake and adiposity, which has been well supported by previous studies based on meta-analysis or review of observational studies [9-11,31,32], a randomized controlled trial [33], or a cross-sectional design [13,34,35]. Despite consistent findings, it should be noted that most studies employ anthropometric measurements to define adiposity (e.g., BMI and WC), which are simple to use but only surrogates of visceral adiposity [5]. Especially, the correlation between BMI and visceral adipose tissue was fairly low, and it was weaker in certain racial groups [5]. A previous study using data from both Korea and the United States showed that BMI may not be an accurate measure of adiposity in Korean adults compared to United States adults [36]. A possible explanation is that Asians tend to show relatively higher PBF with low BMI patterns [37], and especially the Korean population showed a narrower range of BMI than the United States population [36]. Thus, it may be more reliable to use DEXA-measured adiposity, particularly when targeting Koreans.
- To date, there are three studies that used DEXA to measure adiposity and examined the association with UPF intake but did not show consistent findings. A longitudinal study using Spanish adults aged 55 to 75 revealed that a higher UPF intake is associated with greater visceral fat and total fat accumulation, irrespective of sex [11]. In a study using a birth cohort of healthy Brazilian adults aged 23 to 25 years, a higher UPF intake was associated with higher PBF, fat mass index, android fat, and gynoid fat, but it was associated with a lower percent lean body mass only in females [12]. Although the main objective is to examine the mediation role of overall diet quality in the association between UPF intake and adiposity, a study using Korean adults aged 30 to 64 years showed that a higher UPF intake is associated with a higher bioimpedance-measured PBF but not with DEXA-measured visceral fat mass [13]. We observed positive associations of UPF intake with adiposity defined by DEXA-measured PBF and low DEXA-measured muscle mass but no association with BMI or WC (Supplementary Fig. 3).
- The positive association of UPF intake with PBF and PASM was stronger in adults from rural areas and with lower education levels in our study. The observed residential disparities may be explained by disparities in access to “premium” UPFs that could have a beneficial impact on adiposity between geographical areas. UPFs are not necessarily harmful because there are certain types of UPFs (plain yogurt, nutrient-rich granola, and UPFs with organic ingredients) that are highly processed but can be beneficial to health [38-40]. Large grocery stores are more prevalent in urban than rural areas, and they are likely to provide a broader selection of foods, including premium UPFs. Thus, access to premium UPFs may be more challenging for rural residents. It is possible that rural residents in our study may have consumed more conventional (unhealthy) UPFs than premium ones, despite consuming less UPFs than urban residents overall. The level of understanding of UPFs may explain the observed education disparities. It is likely that increased knowledge of nutritional quality and concern for health among people with higher education levels lead to valuing nutritional quality over convenience and taste in food choices [15,41]. Thus, people with lower education levels may be more likely to choose unhealthy UPFs due to insufficient knowledge of traditional or premium UPFs and nutrition overall. Since premium UPFs are usually more expensive than conventional ones, individuals with lower socioeconomic levels are less likely to easily access premium UPFs than those with higher socioeconomic levels [19,42]. In the current NOVA classification system, it would be challenging to distinguish premium UPFs from other traditional UPFs; thus, further studies need to address this issue.
- Our study had important strengths. First, we used DEXAmeasured PBF as well as ASM as more reliable measurements of body composition than anthropometric measurements. Second, to our knowledge, this is the first study showing a targeted analysis of the differential association of UPF intake with body fat and muscle mass according to several sociodemographic factors in a nationally representative sample of Korean adults. Our findings could urge policymakers to address this disparity and several public health strategies could be pursued, particularly targeting rural residents and people with lower education levels.
- There are some limitations that should be noted as well. First, we cannot make a strong causal statement that consuming more UPFs is likely to lead to a higher incidence of obesity or low muscle mass because of the cross-sectional study design. Second, despite the use of standardized protocols, self-reported dietary intake is subject to underreporting issues and measurement errors, and the use of a single 24-hour dietary recall may not fully capture an individual’s usual intake because of day-to-day variation. Compared with the double-labeled water method, total energy intake estimated by a 24-hour dietary recall is 12% underreported in Korean adults [43]. Furthermore, women living alone and with a lower education level are more likely to underreport than their counterparts [44]. Thus, cautious interpretations are needed. Third, our study participants are Korean adults, limiting the generalizability of our study findings to other study settings (e.g., different races and ethnicities, ages, or locations). Fourth, there are uncontrolled confounders (e.g., unmeasured factors like genetic predisposition, knowledge of UPFs, food environment, or unknown factors) that may have affected the size and/or direction of the association. Finally, it is possible that individuals aware of adiposity may change their diet and avoid UPFs, leading to potential reverse causality and underestimating such associations.
- In conclusion, Korean adults who consumed more UPFs may have higher odds of adiposity and low muscle mass than those who consumed fewer UPFs. These associations of UPF intake with adiposity and low muscle mass were stronger among adults from rural areas and with lower education levels than their counterpart. Although causality cannot be established due to the cross-sectional design, our findings could be used as evidence to recommend limiting UPF intake for better body composition. Further studies with a more advanced study design are required to support our results and establish a causal relationship that provides more definite evidence.
DISCUSSION
SUPPLEMENTARY MATERIALS
Supplementary Table 1.
Supplementary Fig. 1.
Supplementary Fig. 2.
Supplementary Fig. 3.
-
CONFLICTS OF INTEREST
No potential conflict of interest relevant to this article was reported.
-
AUTHOR CONTRIBUTIONS
Conception or design: S.J.
Acquisition, analysis, or interpretation of data: S.J.
Drafting the work or revising: S.J.
Final approval of the manuscript: all authors.
-
FUNDING
Sukyoung Jung’s work was supported by the National Research Foundation of Korea (NRF) grant funded by the Korea government (Ministry of Science and ICT) (RS-2023-00274240). The funders had no role in study design, data collection and analysis, decision to publish, or preparation of the manuscript.
NOTES
-
Acknowledgements
- We appreciate the in-depth review of the statistical and methodological accuracy of this paper performed by the Academic Clinical Research Operating and Supporting System, Chungnam National University Hospital Biomedical Research Institute.

| Characteristic |
UPF intake quartiles |
P valuea | |||
|---|---|---|---|---|---|
| Q1 (n=2,780) | Q2 (n=2,781) | Q3 (n=2,782) | Q4 (n=2,780) | ||
| Median UPF intake, %kcal/day | 1.6 | 9.9 | 22.0 | 40.7 | |
| Demographic | |||||
| Age, yr | 59.7±0.3 | 56.4±0.3 | 54.2±0.3 | 51.9±0.2 | <0.0001 |
| Age group, ≥65 years | 35.8±1.2 | 26.5±1.0 | 18.1±0.8 | 12.6±0.7 | <0.0001 |
| Female sex | 53.8±1.2 | 52.1±1.2 | 51.1±1.2 | 51.1±1.2 | 0.4158 |
| Rural residents | 30.3±2.4 | 25.9±2.2 | 25.4±2.4 | 22.5±2.3 | 0.0001 |
| Socioeconomic | |||||
| Education level | |||||
| Less than college graduate | 88.3±1.0 | 81.4±1.1 | 76.8±1.3 | 74.8±1.4 | <0.0001 |
| College graduate or above | 11.7±1.0 | 18.6±1.1 | 23.2±1.3 | 25.2±1.4 | |
| Household income | |||||
| Q1 | 32.6±1.3 | 22.8±1.1 | 16.7±1.0 | 14.9±0.9 | <0.0001 |
| Q2 | 25.1±1.3 | 25.4±1.1 | 25.0±1.3 | 24.3±1.2 | |
| Q3 | 21.9±1.2 | 26.8±1.2 | 28.8±1.2 | 28.2±1.2 | |
| Q4 | 20.4±1.3 | 25.0±1.3 | 29.4±1.4 | 32.6±1.5 | |
| Married | 98.6±0.3 | 98.8±0.3 | 98.6±0.3 | 97.6±0.4 | 0.0387 |
| Lifestyle | |||||
| Current smoking | 15.4±0.9 | 20.8±1.0 | 23.0±1.1 | 26.9±1.2 | <0.0001 |
| Current drinking | 56.6±1.2 | 66.8±1.1 | 71.9±1.1 | 78.2±0.9 | <0.0001 |
| Walking exerciseb | 47.2±1.3 | 44.0±1.3 | 39.0±1.2 | 39.5±1.1 | <0.0001 |
| Weight trainingc | 18.3±1.1 | 21.8±1.1 | 22.5±1.1 | 23.3±1.0 | 0.0057 |
| Diet | |||||
| Energy, kcal/day | 1,702±18 | 1,818±19 | 1,951±18 | 2,095±20 | <0.0001 |
| Carbohydrate, %kcal/day | 75.1±0.2 | 71.7±0.3 | 69.6±0.3 | 68.6±0.2 | <0.0001 |
| Protein, %kcal/day | 13.5±0.1 | 14.3±0.1 | 14.5±0.1 | 14.3±0.1 | <0.0001 |
| Fat, %kcal/day | 11.4±0.2 | 14.0±0.2 | 15.9±0.2 | 17.1±0.2 | <0.0001 |
Values are presented as mean±standard error.
UPF, ultra-processed food.
a P values for differences by UPF intake quartiles were obtained using general linear models for continuous variables and Rao-Scott chi-square tests for categorical variables,
b Walking exercise was defined as walking more than 5 days a week for at least 30 minutes per session,
c Weight training was defined as weight training more than 2 days a week.
- 1. GBD 2019 Risk Factors Collaborators. Global burden of 87 risk factors in 204 countries and territories, 1990-2019: a systematic analysis for the Global Burden of Disease Study 2019. Lancet 2020;396:1223-49.PubMedPMC
- 2. Yang YS, Han BD, Han K, Jung JH, Son JW; Taskforce Team of the Obesity Fact Sheet of the Korean Society for the Study of Obesity. Obesity fact sheet in Korea, 2021: trends in obesity prevalence and obesity-related comorbidity incidence stratified by age from 2009 to 2019. J Obes Metab Syndr 2022;31:169-77.ArticlePubMedPMC
- 3. World Health Organization. Obesity and overweight fact sheet. Available from: http://www.who.int/mediacentre/factsheets/fs311/en (cited 2023 Nov 11).
- 4. Ponti F, Santoro A, Mercatelli D, Gasperini C, Conte M, Martucci M, et al. Aging and imaging assessment of body composition: from fat to facts. Front Endocrinol (Lausanne) 2020;10:861.ArticlePubMedPMC
- 5. Neeland IJ, Ross R, Despres JP, Matsuzawa Y, Yamashita S, Shai I, et al. Visceral and ectopic fat, atherosclerosis, and cardiometabolic disease: a position statement. Lancet Diabetes Endocrinol 2019;7:715-25.ArticlePubMed
- 6. Hemler EC, Hu FB. Plant-based diets for personal, population, and planetary health. Adv Nutr 2019;10(Suppl 4):S275-83.ArticlePubMedPMCPDF
- 7. Popkin BM, Ng SW. The nutrition transition to a stage of high obesity and noncommunicable disease prevalence dominated by ultra-processed foods is not inevitable. Obes Rev 2022;23:e13366.ArticlePubMedPDF
- 8. Monteiro CA, Cannon G, Levy RB, Moubarac JC, Louzada ML, Rauber F, et al. Ultra-processed foods: what they are and how to identify them. Public Health Nutr 2019;22:936-41.ArticlePubMedPMC
- 9. Askari M, Heshmati J, Shahinfar H, Tripathi N, Daneshzad E. Ultra-processed food and the risk of overweight and obesity: a systematic review and meta-analysis of observational studies. Int J Obes (Lond) 2020;44:2080-91.ArticlePubMedPDF
- 10. Moradi S, Entezari MH, Mohammadi H, Jayedi A, Lazaridi AV, Kermani MA, et al. Ultra-processed food consumption and adult obesity risk: a systematic review and dose-response metaanalysis. Crit Rev Food Sci Nutr 2023;63:249-60.ArticlePubMed
- 11. Konieczna J, Morey M, Abete I, Bes-Rastrollo M, Ruiz-Canela M, Vioque J, et al. Contribution of ultra-processed foods in visceral fat deposition and other adiposity indicators: prospective analysis nested in the PREDIMED-Plus trial. Clin Nutr 2021;40:4290-300.ArticlePubMed
- 12. Rudakoff LC, Magalhaes EI, Viola PC, de Oliveira BR, da Silva Coelho CC, Braganca ML, et al. Ultra-processed food consumption is associated with increase in fat mass and decrease in lean mass in Brazilian women: a cohort study. Front Nutr 2022;9:1006018.ArticlePubMedPMC
- 13. Shim JS, Ha KH, Kim DJ, Kim HC. Diet quality partially mediates the association between ultraprocessed food consumption and adiposity indicators. Obesity (Silver Spring) 2023;31:2430-9.ArticlePubMed
- 14. Marron-Ponce JA, Sanchez-Pimienta TG, Louzada ML, Batis C. Energy contribution of NOVA food groups and sociodemographic determinants of ultra-processed food consumption in the Mexican population. Public Health Nutr 2018;21:87-93.ArticlePubMed
- 15. Baraldi LG, Martinez Steele E, Canella DS, Monteiro CA. Consumption of ultra-processed foods and associated sociodemographic factors in the USA between 2007 and 2012: evidence from a nationally representative cross-sectional study. BMJ Open 2018;8:e020574.ArticlePubMedPMC
- 16. Ozcariz SGI, Pudla KJ, Martins APB, Peres MA, Conzalez-Chica DA. Sociodemographic disparities in the consumption of ultra-processed food and drink products in Southern Brazil: a population-based study. J Public Health (Berl) 2019;27:649-58.ArticlePDF
- 17. Khandpur N, Cediel G, Obando DA, Jaime PC, Parra DC. Sociodemographic factors associated with the consumption of ultra-processed foods in Colombia. Rev Saude Publica 2020;54:19.ArticlePubMedPMCPDF
- 18. Shim JS, Shim SY, Cha HJ, Kim J, Kim HC. Socioeconomic characteristics and trends in the consumption of ultra-processed foods in Korea from 2010 to 2018. Nutrients 2021;13:1120.ArticlePubMedPMC
- 19. Juul F, Parekh N, Martinez-Steele E, Monteiro CA, Chang VW. Ultra-processed food consumption among US adults from 2001 to 2018. Am J Clin Nutr 2022;115:211-21.ArticlePubMedPDF
- 20. Jang HJ, Oh H. Trends and inequalities in overall and abdominal obesity by sociodemographic factors in Korean adults, 1998-2018. Int J Environ Res Public Health 2021;18:4162.ArticlePubMedPMC
- 21. Rural Development Administration, National Institute of Agriculatural Sciences. Standard food composition table. 7th ed. Suwon: Rural development Administration, National Institute of Agriculatural Sciences; 2006.
- 22. Park HJ, Park S, Kim JY. Development of Korean NOVA Food Classification and estimation of ultra-processed food intake among adults: using 2018 Korea National Health and Nutrition Examination Survey. Korean J Community Nutr 2022;27:455-67.ArticlePDF
- 23. Desquilbet L, Mariotti F. Dose-response analyses using restricted cubic spline functions in public health research. Stat Med 2010;29:1037-57.ArticlePubMed
- 24. Valicente VM, Peng CH, Pacheco KN, Lin L, Kielb EI, Dawoodani E, et al. Ultraprocessed foods and obesity risk: a critical review of reported mechanisms. Adv Nutr 2023;14:718-38.ArticlePubMedPMC
- 25. Prasad K, Dhar I. Oxidative stress as a mechanism of added sugar-induced cardiovascular disease. Int J Angiol 2014;23:217-26.ArticlePubMedPMC
- 26. Kelli HM, Corrigan FE 3rd, Heinl RE, Dhindsa DS, Hammadah M, Samman-Tahhan A, et al. Relation of changes in body fat distribution to oxidative stress. Am J Cardiol 2017;120:2289-93.ArticlePubMedPMC
- 27. Park Y, Jang J, Lee D, Yoon M. Vitamin C inhibits visceral adipocyte hypertrophy and lowers blood glucose levels in high-fatdiet-induced obese C57BL/6J mice. Biomed Sci Lett 2018;24:311-8.Article
- 28. Han SF, Jiao J, Zhang W, Xu JY, Zhang W, Fu CL, et al. Lipolysis and thermogenesis in adipose tissues as new potential mechanisms for metabolic benefits of dietary fiber. Nutrition 2017;33:118-24.ArticlePubMed
- 29. Yook JS, Thomas SS, Toney AM, You M, Kim YC, Liu Z, et al. Dietary iron deficiency modulates adipocyte iron homeostasis, adaptive thermogenesis, and obesity in C57BL/6 mice. J Nutr 2021;151:2967-75.ArticlePubMedPMCPDF
- 30. Forde CG, Mars M, de Graaf K. Ultra-processing or oral processing?: a role for energy density and eating rate in moderating energy intake from processed foods. Curr Dev Nutr 2020;4:nzaa019.ArticlePubMedPMCPDF
- 31. Crimarco A, Landry MJ, Gardner CD. Ultra-processed foods, weight gain, and co-morbidity risk. Curr Obes Rep 2022;11:80-92.ArticlePubMedPDF
- 32. Harb AA, Shechter A, Koch PA, St-Onge MP. Ultra-processed foods and the development of obesity in adults. Eur J Clin Nutr 2023;77:619-27.ArticlePubMedPDF
- 33. Hall KD, Ayuketah A, Brychta R, Cai H, Cassimatis T, Chen KY, et al. Ultra-processed diets cause excess calorie intake and weight gain: an inpatient randomized controlled trial of Ad libitum food intake. Cell Metab 2019;30:67-77.ArticlePubMedPMC
- 34. Zhang Z, Kahn HS, Jackson SL, Steele EM, Gillespie C, Yang Q. Associations between ultra- or minimally processed food intake and three adiposity indicators among US adults: NHANES 2011 to 2016. Obesity (Silver Spring) 2022;30:1887-97.PubMedPMC
- 35. Shim JS, Ha KH, Kim DJ, Kim HC. Ultra-processed food consumption and obesity in Korean adults. Diabetes Metab J 2023;47:547-58.ArticlePubMedPMCPDF
- 36. Jeong SM, Lee DH, Rezende LF, Giovannucci EL. Different correlation of body mass index with body fatness and obesity-related biomarker according to age, sex and race-ethnicity. Sci Rep 2023;13:3472.ArticlePubMedPMCPDF
- 37. Carpenter CL, Yan E, Chen S, Hong K, Arechiga A, Kim WS, et al. Body fat and body-mass index among a multiethnic sample of college-age men and women. J Obes 2013;2013:790654.ArticlePubMedPMCPDF
- 38. Baspinar B, Guldas M. Traditional plain yogurt: a therapeutic food for metabolic syndrome? Crit Rev Food Sci Nutr 2021;61:3129-43.ArticlePubMed
- 39. Akagawa S, Akagawa Y, Nakai Y, Yamagishi M, Yamanouchi S, Kimata T, et al. Fiber-rich barley increases butyric acid-producing bacteria in the human gut microbiota. Metabolites 2021;11:559.ArticlePubMedPMC
- 40. Meadows AD, Swanson SA, Galligan TM, Naidenko OV, O’Connell N, Perrone-Gray S, et al. Packaged foods labeled as organic have a more healthful profile than their conventional counterparts, according to analysis of products sold in the U.S. in 2019-2020. Nutrients 2021;13:3020.ArticlePubMedPMC
- 41. Zagorsky JL, Smith PK. The association between socioeconomic status and adult fast-food consumption in the U. S. Econ Hum Biol 2017;27(Pt A):12-25.
- 42. Scrinis G, Monteiro CA. Ultra-processed foods and the limits of product reformulation. Public Health Nutr 2018;21:247-52.ArticlePubMed
- 43. Kim EK, Fenyi JO, Kim JH, Kim MH, Yean SE, Park KW, et al. Comparison of total energy intakes estimated by 24-hour diet recall with total energy expenditure measured by the doubly labeled water method in adults. Nutr Res Pract 2022;16:646-57.ArticlePubMedPMCPDF
- 44. Kye S, Kwon SO, Lee SY, Lee J, Kim BH, Suh HJ, et al. Underreporting of energy intake from 24-hour dietary recalls in the Korean National Health and Nutrition Examination Survey. Osong Public Health Res Perspect 2014;5:85-91.ArticlePubMedPMC
 PubReader
 ePub Link
 Cite
Cite