- Current
- Browse
- Collections
-
For contributors
- For Authors
- Instructions to authors
- Article processing charge
- e-submission
- For Reviewers
- Instructions for reviewers
- How to become a reviewer
- Best reviewers
- For Readers
- Readership
- Subscription
- Permission guidelines
- About
- Editorial policy
Articles
- Page Path
- HOME > Diabetes Metab J > Volume 48(2); 2024 > Article
-
Original ArticleComplications Impact of Hyperglycemia on Complication and Mortality after Transarterial Chemoembolization for Hepatocellular Carcinoma
-
Sun Joon Moon1,2*
 , Chang Ho Ahn1,3*, Yun Bin Lee1,4, Young Min Cho1,4
 -
Diabetes & Metabolism Journal 2024;48(2):302-311.
DOI: https://doi.org/10.4093/dmj.2022.0255
Published online: January 3, 2024
- 789 Views
- 118 Download
1Department of Internal Medicine, Seoul National University College of Medicine, Seoul, Korea
2Division of Endocrinology and Metabolism, Department of Internal Medicine, Kangbuk Samsung Hospital, Sungkyunkwan University School of Medicine, Seoul, Korea
3Department of Internal Medicine, Seoul National University Bundang Hospital, Seongnam, Korea
4Department of Internal Medicine, Seoul National University Hospital, Seoul, Korea
-
Corresponding author: Young Min Cho Department of Internal Medicine, Seoul National University Hospital, Seoul National University College of Medicine, 101 Daehak-ro, Jongno-gu, Seoul 03080, Korea E-mail: ymchomd@snu.ac.kr
- *Sun Joon Moon and Chang Ho Ahn contributed equally to this study as first authors.
Copyright © 2024 Korean Diabetes Association
This is an Open Access article distributed under the terms of the Creative Commons Attribution Non-Commercial License (http://creativecommons.org/licenses/by-nc/4.0/) which permits unrestricted non-commercial use, distribution, and reproduction in any medium, provided the original work is properly cited.
ABSTRACT
-
Background
- Current guidelines regarding periprocedural glycemic control to prevent complications after nonsurgical invasive procedures are insufficient. Transarterial chemoembolization (TACE) is a widely used treatment for unresectable hepatocellular carcinoma. We aimed to investigate the association between diabetes mellitus (DM) per se and the degree of hyperglycemia with postprocedural complications after TACE.
-
Methods
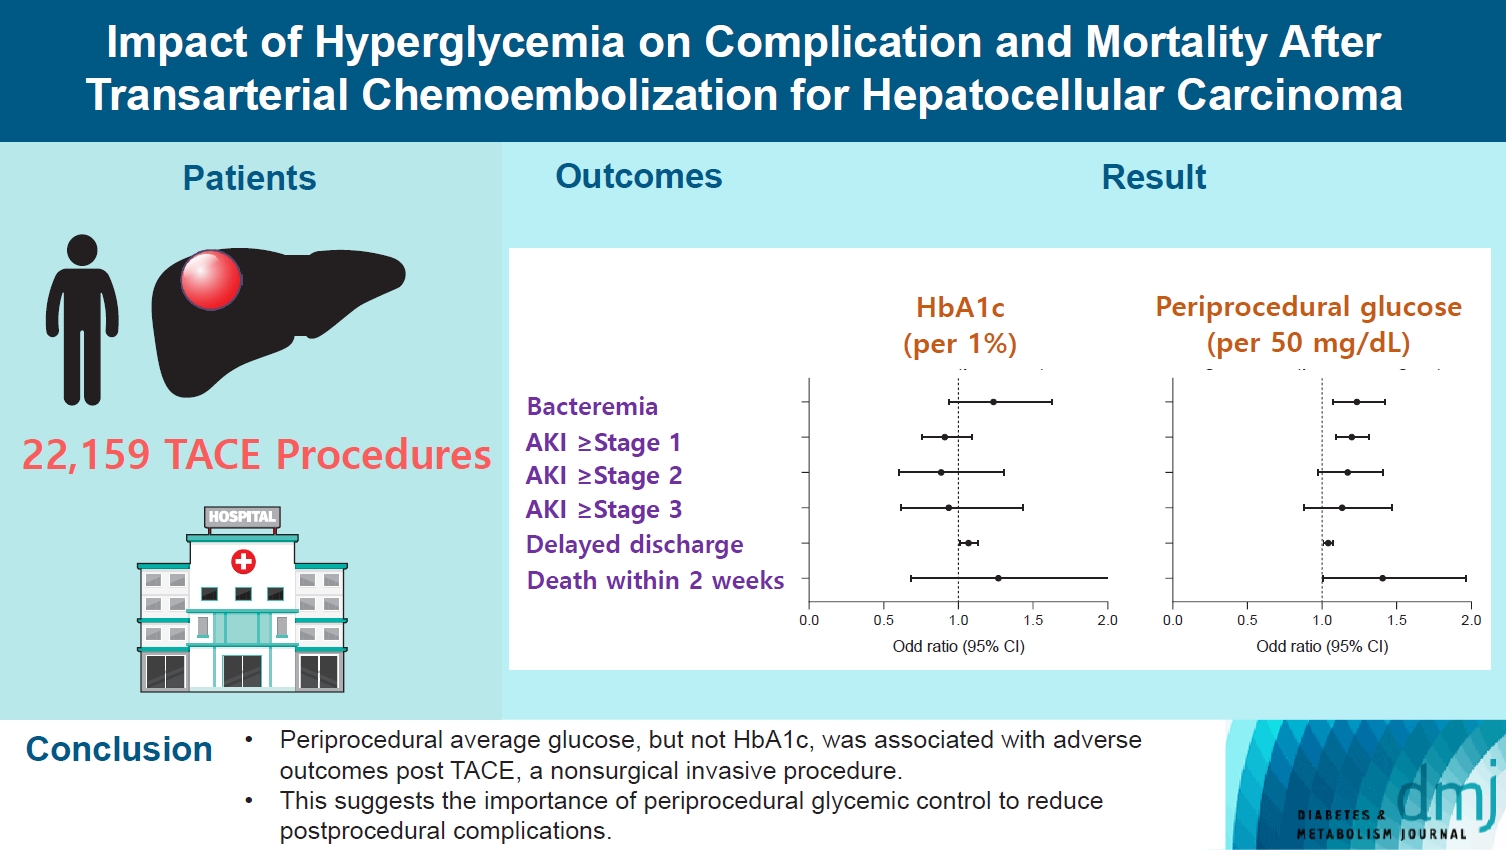
- A total of 22,159 TACE procedures performed at Seoul National University Hospital from 2005 to 2018 were retrospectively analyzed. The associations between DM, preprocedural glycosylated hemoglobin (HbA1c), and periprocedural average glucose with postprocedural adverse outcomes were evaluated. The primary outcome was occurrence of postprocedural bacteremia. Secondary outcomes were acute kidney injury (AKI), delayed discharge and death within 14 days. Periprocedural glucose was averaged over 3 days: the day of, before, and after the TACE procedures. Propensity score matching was applied for procedures between patients with or without DM.
-
Results
- Periprocedural average glucose was significantly associated with bacteremia (adjusted odds ratio per 50 mg/dL of glucose, 1.233; 95% confidence interval, 1.071 to 1.420; P=0.004), AKI, delayed discharge, and death within 14 days. DM per se was only associated with bacteremia and AKI. Preprocedural HbA1c was associated with delayed discharge. Average glucose levels above 202 and 181 mg/dL were associated with a significantly higher risk of bacteremia and AKI, respectively, than glucose levels of 126 mg/dL or lower.
-
Conclusion
- Periprocedural average glucose, but not HbA1c, was associated with adverse outcomes after TACE, which is a nonsurgical invasive procedure. This suggests the importance of periprocedural glycemic control to reduce postprocedural complications.
- • This study explored the influence of DM and hyperglycemia on post-TACE complications.
- • DM was linked to higher rates of bacteremia and AKI occurrences.
- • Elevated HbA1c levels were associated with prolonged hospital stays.
- • High peri-TACE glucose levels were linked to bacteremia, AKI, delayed discharge, and deaths.
- • Glucose levels ≥202 mg/dL and ≥181 mg/dL raise bacteremia and AKI risks vs. ≤126 mg/dL.
Highlights
- Diabetes mellitus (DM) is prevalent in the general population, and its prevalence is even higher among surgical patients, reaching approximately 20% [1]. Perioperative hyperglycemia is associated with adverse outcomes, including infection, longer hospital stays, acute kidney injury (AKI), delayed wound healing, and postoperative mortality after both cardiac and noncardiac surgeries [1-4]. Based on these observations, current clinical guidelines emphasize the importance of perioperative glycemic control and have suggested preoperative glycemic targets to prevent postoperative complications [5-7]. However, there are no clear guidelines regarding periprocedural glucose control for nonsurgical, minimally invasive procedures.
- The indications of nonsurgical procedures have expanded drastically with advances in catheter and imaging technologies [8]. Minimally invasive techniques can be applied in various body compartments, including the head and neck, chest, abdomen, and extremities, for both diagnostic and therapeutic purposes. Although to a lesser extent than a surgical approach, these interventions still carry a risk of postprocedural complications, including infection, bleeding, and even death [9,10]. DM and hyperglycemia are associated with complications of nonsurgical procedures similar to their relationship with postoperative complications. Previous studies have reported a possible association between hyperglycemia and each postprocedural complication individually. Periprocedural hyperglycemia was associated with restenosis after percutaneous coronary intervention (PCI), and intensive glycemic control reduced short- and long-term mortality after PCI [9,11]. DM is a significant risk factor for AKI after angiographic procedures using contrast media [10]. However, these reports did not comprehensively analyze various complications and could not determine whether diabetes per se or the severity of hyperglycemia is responsible for the observed postprocedural complications.
- In addition, chronic and acute hyperglycemia may be differentially associated with postprocedural complications. In a retrospective analysis of more than 430,000 surgeries at a tertiary medical center, perioperative average glucose, which reflects acute hyperglycemia, was significantly associated with postoperative mortality, while glycosylated hemoglobin (HbA1c), which reflects chronic hyperglycemia, was not [4]. As shown in surgical complications, the different impacts of short-term average glucose and HbA1c on postprocedural complications may have clinical implications in regard to whether long- or short-term glycemic control can prevent adverse outcomes.
- Transarterial chemoembolization (TACE), a nonsurgical procedure, is widely used as a primary therapy for unresectable hepatocellular carcinoma (HCC) [12]. Arterial catheterization, use of contrast media and injection of cytotoxic chemo-agents during TACE procedure can all contribute to the risk of complications. The rate of adverse events after TACE varies from 1.0% for bacteremia to nearly 50% for worsening liver enzymes [13]. Patients with liver diseases have higher prevalence of DM than general population [14,15]. However, it is not reported whether DM or hyperglycemia increase the risk of complications after TACE.
- In this study, we aimed to investigate the association between diabetes and hyperglycemia with postprocedural complications after TACE, a nonsurgical procedure for the treatment of HCC. We analyzed the effects of diabetes and longand short-term glycemic control, estimated by HbA1c and periprocedural glucose levels, on the development of postprocedural complications after TACE.
INTRODUCTION
- Study dataset
- We retrospectively reviewed the medical records of TACE procedures performed on HCC patients at Seoul National University Hospital between 2005.1.1 and 2018.12.31. The start date was chosen because point-of-care testing (POCT) glucose data have been included in electronic medical records since 2004.10, and a 2-month wash-out period was adopted. To include only elective TACE procedures, procedures conducted at the emergency department or performed within 7 days of an emergency room visit were excluded. Patients aged ≥18 years were included in the analysis. Procedures without available creatinine, bilirubin, and international normalized ratio data, which are the components of the Model for End-Stage Liver Disease (MELD) score within 90 days before TACE, were excluded from the analysis. Procedures performed on patients with endstage renal disease and who already had bacteremia within 14 days before TACE were also excluded from the analysis. Fig. 1 describes the selection of the procedure dataset for final analysis.
- Definitions of diabetes mellitus and adverse outcomes
- Individuals with DM were defined as those whose previous maximal HbA1c level was ≥6.5% (53 mmol/mol), random blood glucose level ≥200 mg/dL or who had been on antidiabetic medications before the procedure. To determine periprocedural average glucose, mean POCT glucose levels over 3 days, including 1 day before, 1 day after, and the day of the procedure, were used. POCT glucose was routinely measured in patients with DM before meals and before bedtime. For patients without known diabetes, POCT glucose was measured when patients’ random blood glucose levels were ≥126 mg/dL. HbA1c was adopted as the nearest value between 90 days before the procedure and 7 days after the procedure to reflect the preprocedural glycemic status. The primary outcome of the study was the rate of postprocedural bacteremia confirmed based on blood culture results, which was performed by the physician’s clinical decision. Secondary outcomes were the rates of AKI, delayed discharge, and death within 14 days after the date of TACE. We defined delayed discharge as the highest quartile of hospital stay after TACE. In our dataset, patients were discharged within 3 days in nearly three-quarters of TACE procedures (79.4%) and within 2 days in 66.6% of the procedures. Therefore, 4 days or more after TACE was regarded as delayed discharge in this study. Bacteremia was defined as a positive blood culture of true pathogens excluding contaminated skin commensal bacteria. Contamination with commensal bacteria was determined by reviewing the medical records. AKI was categorized as stage 1, 2, or 3, based on the Acute Kidney Injury Network (AKIN) criteria (stage 1, serum creatinine increase of 0.3 mg/dL or increase of 150% to 200% from baseline; stage 2, serum creatinine increase of >200% to 300% from baseline; serum creatinine increase of >300% from baseline or increase to ≥4 mg/dL with an acute increase of ≥0.5 mg/dL) [16]. We did not include urine output criteria, as they were not routinely recorded for most patients.
- Statistical analysis
- To analyze the association between DM and adverse outcomes, we used two datasets: (1) a nonmatched dataset and (2) a propensity score (PS)-matched dataset for patients with or without DM. For PS matching, age, sex, body mass index (BMI), year of TACE procedure, order of TACE, Modification of Diet in Renal Disease (MDRD) estimated glomerular filtration rate (eGFR), serum alpha fetoprotein (AFP), and MELD score were matched using the 1:1 nearest method. An absolute standard mean difference (SMD) of <0.1 was used to evaluate whether PS matching was successful. We used a logistic regression model for postprocedural adverse outcomes according to DM status, periprocedural average glucose level, and HbA1c level. Age, sex, BMI, MELD score, MDRD eGFR, serum AFP, year of TACE, and order of TACE were included as covariates. Because of the nature of HCC, TACE procedures were sometimes repeated for the same patient; therefore, we matched and adjusted the order of TACE to minimize this confounding effect. In addition, the year of TACE was categorized based on the distribution of the DM patients. A generalized additive model was used to analyze the continuous relationship between adverse outcomes and periprocedural average glucose or HbA1c levels. In the generalized additive model, the same covariates used in PS matching were adjusted. To investigate long-term outcome of TACE, we performed survival analysis to see whether DM, periprocedural glucose level or HbA1c is associated shorter duration of repeated TACE or death. Cox-proportional hazard model was used and forementioned covariates except for the order of TACE were included. All continuous variables are presented as the mean±standard deviation, and categorical variables are shown as numbers and proportions (%). Statistical analyses were performed using R version 3.6.2 (R Foundation, Vienna, Austria; https://www.r-project.org). A P value of <0.05 was considered statistically significant.
- Ethical statement
- This study was approved by the Institutional Review Board of Seoul National University Hospital (approval number: H-2002-096-1103). Written informed consent was waived due to a retrospective nature of this study.
METHODS
- Baseline characteristics of the dataset
- A total of 22,159 TACE procedures in 6,422 patients were included in the final analysis. The number of non-DM patient procedures was 13,874, and the number for DM patients was 8,285 (Table 1, Fig. 1). Age, BMI, and male percentage were higher in the DM patients who underwent TACE procedures. The average HbA1c levels were 7.19 (55 mmol/mol) and 5.57% (38 mmol/mol) for procedures of DM and non-DM patients, respectively (P<0.001). The periprocedural average glucose levels were 194.7 and 118.0 mg/dL for procedures of DM and non-DM patients, respectively (P<0.001). Serum creatinine was higher and eGFR was lower in the procedures of DM patients. The difference in MELD score, which reflects the severity of liver cirrhosis, was small but significantly higher in the DM group. Serum AFP level was lower in the DM group. The TACE procedures of DM patients were matched to those of non-DM patients at a 1:1 ratio, resulting in 8,248 procedures for each group. After PS matching, age, BMI, male percentage, year of TACE, order of TACE, eGFR, serum AFP, and MELD score were comparable between the DM and non-DM groups (all SMD <0.1) (Table 1).
- DM vs. non-DM groups
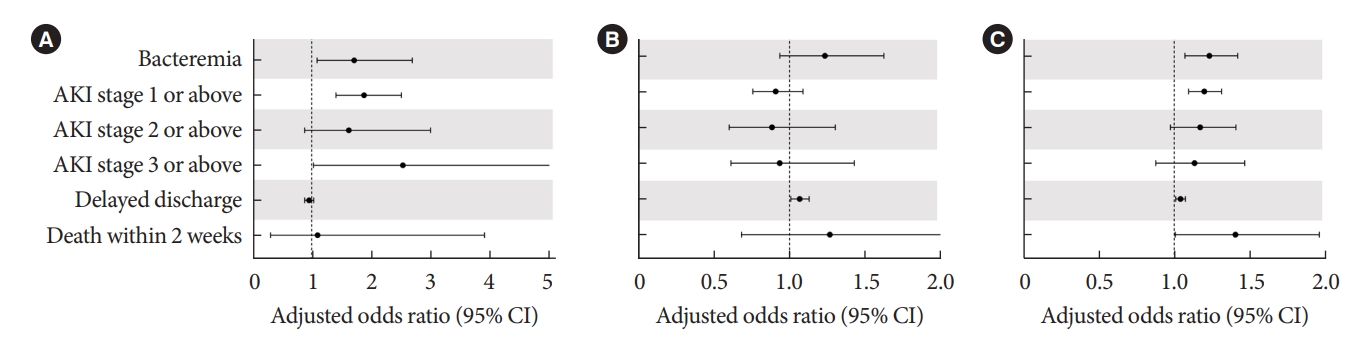
- Before PS matching, the DM group had a lower rate of delayed discharge (21.8% vs. 18.1%, P<0.001) (Table 2) and a higher rate of AKI (1.8% vs. 0.9%, P<0.001) (Table 2). The rate of bacteremia and death within 14 days was not significantly different between the DM and non-DM groups. After PS matching, the difference in delayed discharge was not significant between the DM and non-DM groups (18.1% vs. 18.8%, P=0.213). The rate of AKI was still significantly higher in the DM group (1.8% vs. 0.9%, P<0.001). In multivariate analysis, DM was associated with each and every stage of AKI (adjusted odds ratio [aOR], 1.880; 95% confidence interval [CI], 1.408 to 2.510; P<0.001) and bacteremia (aOR, 1.714; 95% CI, 1.090 to 2.694; P=0.020), delayed discharge (aOR, 0.953; 95% CI, 0.880 to 1.033; P=0.241), or death within 14 days (aOR, 1.096; 95% CI, 0.307 to 3.907; P=0.888) (Fig. 2A).
- HbA1c and periprocedural glucose
- HbA1c levels within 3 months before the procedure, and periprocedural average glucose levels, had a strong positive correlation (r=0.576, P<0.001). However, the association with adverse outcomes after TACE was different between HbA1c and the periprocedural average glucose levels. HbA1c levels within three months before the procedure were not significantly associated with adverse outcomes (Fig. 2B). Only delayed discharge showed a significant association with HbA1c level (aOR, 1.068; 95% CI, 1.010 to 1.112; P=0.057). In contrast, the periprocedural average glucose level was significantly associated with bacteremia (aOR, 1.233; 95% CI, 1.070 to 1.420; P=0.004), AKI stage I or above (aOR, 1.199; 95% CI, 1.095 to 1.313; P<0.001), delayed discharge (aOR, 1.041; 95% CI, 1.010 to 1.074; P=0.010), and death within 14 days (aOR, 1.405; 95% CI, 1.006 to 1.961; P=0.046) (Fig. 2C).
- Fig. 3 shows the continuous association between HbA1c and periprocedural average glucose with adverse outcomes after TACE. The probabilities of delayed discharge showed an increasing trend with increasing HbA1c levels (P=0.029) (Fig. 3). The probabilities of bacteremia, AKI, and delayed discharge increased with increasing periprocedural average glucose levels (P=0.002, P<0.001, and P=0.001, respectively) (Fig. 3). The periprocedural average glucose levels had an increasing trend with death within 14 days with marginal statistical significance (P=0.063) (Fig. 3). When considering a periprocedural average glucose of 126 mg/dL as the reference line, the probability of bacteremia and AKI were significantly increased at 202.4 and 182.4 mg/dL, respectively.
- Pre- vs. postprocedural glucose
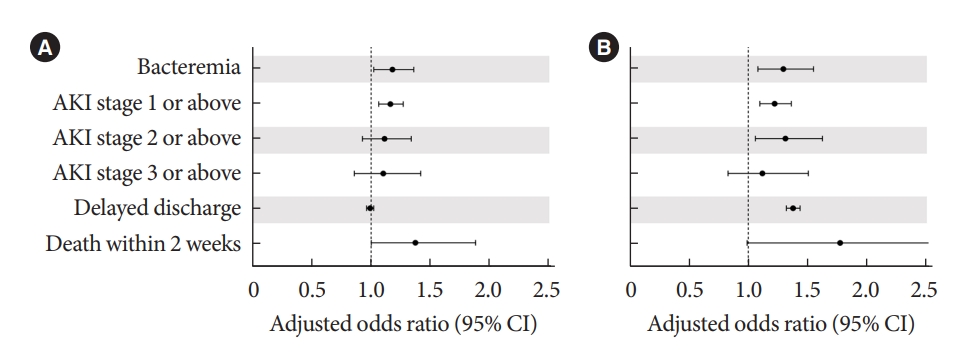
- Considering that postprocedural complications can induce stress hyperglycemia, we analyzed preprocedural and postprocedural average glucose levels separately to evaluate whether periprocedural hyperglycemia will act as a cause or result of complications. Preprocedural average glucose level showed a significant association with bacteremia, AKI and death within 14 days (Fig. 4). Postprocedural average glucose level also showed a significant association with bacteremia and AKI, but only marginal significance with death within 14 days (Fig. 4).
- Long-term outcome of TACE
- In survival analysis, DM was significantly associated with shorter duration until next TACE or death (hazard ratio, 2.10; 95% CI, 1.91 to 2.32; P<0.001) (Supplementary Fig. 1). High periprocedural glucose level (hazard ratio, 1.04; 95% CI, 1.01 to 1.07; P=0.020) (Supplementary Fig. 2) and HbA1c level (hazard ratio, 1.09; 95% CI, 1.02 to 1.16; P=0.009) (Supplementary Fig. 3) were also significantly associated with shorter duration until next TACE or death.
RESULTS
- Hyperglycemia is a well-known risk factor for postoperative complications after both cardiac and noncardiac surgeries. DM is highly prevalent among in-hospital patients [1]. Surgical stress can induce postoperative hyperglycemia even in patients without DM. Observational studies have consistently reported that perioperative hyperglycemia is associated with increased surgical complication risk, and tight perioperative glycemic control reduced surgical mortality within 30 days in randomized controlled trials [4,17,18]. Although the absolute risk of complications is lower for nonsurgical interventions, including angiography and percutaneous catheterization, than that of open surgeries, these interventions are not risk-free [19,20]. TACE, a nonsurgical procedure for HCC treatment, can also cause complications such as puncture site infection, bacteremia, AKI, and even death. Therefore, it can be expected that hyperglycemia is associated with postprocedural complications of nonsurgical procedures. However, unlike for surgeries, there are no consensuses or guidelines for periprocedural glycemic control in nonsurgical procedures yet. The current retrospective analysis of TACE procedures has demonstrated that the periprocedural average glucose level, which reflects short-term glycemic control, is associated with postprocedural complications, including bacteremia, AKI, delayed discharge, and early postprocedural mortality. Having DM, regardless of glycemic status, was associated with only AKI and bacteremia. Preprocedural HbA1c, which reflects long-term glycemic control, showed a trend of increased bacteremia, delayed discharge, and early death, but these associations were not statistically significant. These results suggest that poor periprocedural glycemic control is associated with postprocedural complications even for TACE, a minimally invasive procedure, and that short-term, rather than long-term, glycemic control is more crucial for its complications.
- DM was associated with a significant risk of AKI irrespective of short- or long-term glycemic control. Because contrast media is used during TACE, occurrence of AKI after TACE can be considered a form of contrast-induced nephropathy. In addition to contrast media usage, decreased liver function, bleeding, and fever after TACE can contribute to AKI after TACE. DM is a well-established risk factor for contrast-induced nephropathy and is included as a risk predictor in most prediction models for contrast-induced nephropathy [21]. Mechanistically, renal hypoxia and increased oxidative stress in the renal tubule play a pivotal role in developing contrast-induced nephropathy [22]. Diabetic nephropathy is characterized by microangiopathy in the renal glomerulus and tubules. Diabetic kidneys are already prone to renal hypoxia and having a high level of reactive oxygen species [22]. Thus, DM can increase the detrimental effects of contrast media on the kidneys.
- Bacteremia was significantly associated with DM itself and high periprocedural glucose level. Postprocedural bacteremia may lead to secondary complications, including metastatic infection. Systemic antibiotic treatment is usually required after documented bacteremia. Thus, the delayed discharge of those with bacteremia is unavoidable. In this study, the median length of stay for those with bacteremia was 10 days, which was more than three times longer than the median length of stay of all patients (data not shown). DM patients have a higher susceptibility to various types of infections than the general population does [23]. The risk of infection is even higher in DM patients with poor glycemic control than in those with optimal glycemic control [24]. Hyperglycemia increased the risk of hospital-acquired infection regardless of diabetes status [25]. Both in vivo and in vitro studies have shown that hyperglycemia directly impairs both innate and adaptive immunity [26]. The chemotactic and phagocytic functions of neutrophils are impaired under hyperglycemic conditions [27]. Exposure to hyperglycemic conditions impairs lymphocyte proliferation to antigen [28]. These preclinical studies also support the idea that hyperglycemia itself is a major contributor to infection susceptibility.
- Preprocedural HbA1c levels and periprocedural average glucose levels are intercorrelated but not identical. HbA1c levels reflect long-term glycemic status, while periprocedural average glucose levels represent acute glycemic status around the time of the procedure. In our study, the periprocedural average glucose level was more closely related to postprocedural complications than the HbA1c level. A similar result was also reported for surgical complications. In a retrospective analysis, preoperative HbA1c level was not associated with 30-day mortality, while perioperative glucose level, which was the average glucose level during the first three postoperative days, was significantly associated with 30-day mortality for both cardiac and noncardiac surgeries [4]. These results suggest that short-term glycemic control may be more critical for preventing postprocedural and postoperative complications than long-term glycemic control. In addition, HbA1c has limited reliability in patients with liver cirrhosis [29,30]. Red blood cell lifespan is altered in liver cirrhosis, and anemia is common among patients with liver cirrhosis. This may also be attributed to a weaker association with HbA1c level and postprocedural complications.
- In-hospital patients often experience hyperglycemia or aggravation of hyperglycemia due to various stress conditions [31]. TACE itself and postprocedural complications can aggravate hyperglycemia. Thus, it is possible that postprocedural hyperglycemia is the result of complications, not the cause of complications. To address this issue, we analyzed preprocedural and postprocedural average glucose separately on their association with postprocedural adverse outcomes. The preprocedural average glucose level, as well as the postprocedural average glucose level, was significantly associated with postprocedural adverse outcomes, including bacteremia, AKI, and death within 14 days. These results suggest that hyperglycemia is not merely a result of postprocedural complications but that it independently contributes to the occurrence of postprocedural complications.
- Our study included data of more than 22,000 TACE procedures. To the best of our knowledge, this is the largest study analyzing postprocedural complications after TACE. The dataset was from a single institution, and so, the procedural protocol was relatively consistent among patients. However, our study also has several limitations. First, HbA1c and blood glucose levels were not measured for all patients who underwent TACE. Second, TACE is a nonsurgical invasive procedure, but different nonsurgical procedures have different properties. The findings of our study cannot be generalized to other types of procedures, including percutaneous catheterization and radiofrequency ablation. Third, HbA1c may not be a reliable marker for estimating long-term glycemic control in patients with liver cirrhosis. Fourth, we did not include fasting blood glucose level ≥126 mg/dL in the definition of DM. Because our study was a retrospective study and inpatient setting, it was difficult to assess the fasting state. Fifth, we could not consider other treatment for HCC or tumor progression in investigating long-term outcome of TACE.
- In summary, periprocedural hyperglycemia is associated with an increased risk of bacteremia and AKI after TACE. In addition, hyperglycemia is associated with delayed discharge and, eventually, early postprocedural mortality. HbA1c only showed a tendency of association with adverse outcomes, suggesting that short-term rather than long-term glycemic control is more critical for avoiding postprocedural complications. Not only for surgery but also for nonsurgical procedures, such as TACE, periprocedural glycemic control is closely associated with postprocedural complications. Proper periprocedural glycemic control should be focused on maintaining periprocedural glucose levels within the euglycemic range. The impact of periprocedural hyperglycemia on the complications of other types of nonsurgical intervention requires further investigation.
DISCUSSION
SUPPLEMENTARY MATERIALS
Supplementary Fig. 1.
Supplementary Fig. 2.
Supplementary Fig. 3.
-
CONFLICTS OF INTEREST
No potential conflict of interest relevant to this article was reported.
-
AUTHOR CONTRIBUTIONS
Conception or design: S.J.M., C.H.A., Y.M.C.
Acquisition, analysis, or interpretation of data: S.J.M., C.H.A.
Drafting the work or revising: S.J.M, C.H.A., Y.B.L., Y.M.C.
Final approval of the manuscript: S.J.M., C.H.A., Y.B.L., Y.M.C.
-
FUNDING
Young Min Cho received grants from Sanofi and Daewoong and received consulting fees from LG Chemical. The funders had no role in study design, data collection and analysis, decision to publish, or preparation of the manuscript.
NOTES
-
Acknowledgements
- None


| Characteristic |
Before matching |
After matchinga |
||||||
|---|---|---|---|---|---|---|---|---|
| Non-DM | DM | SMD | P value | Non-DM | DM | SMD | P value | |
| No. of cases | 13,874 | 8,285 | 8,248 | 8,248 | ||||
| Age, yr | 61.5±10.6 | 65.0±9.5 | 0.349 | <0.001 | 64.6±9.6 | 64.9±9.5 | 0.032 | 0.040 |
| Male sex | 11,081 (79.9) | 7,053 (85.1) | 0.139 | <0.001 | 7,078 (85.8) | 7,027 (85.2) | ||
| BMI, kg/m2 | 23.7±3.3 | 24.1±3.3 | 0.134 | <0.001 | 24.1±3.3 | 24.2±3.3 | 0.004 | 0.812 |
| Year of TACE | 0.198 | <0.001 | 0.036 | 0.258 | ||||
| 2005–2009 | 3,504 (25.3) | 1,653 (20.0) | 1,731 (21.0) | 1,641 (19.9) | ||||
| 2010–2012 | 3,907 (28.2) | 1,973 (23.8) | 2,006 (24.3) | 1,966 (23.8) | ||||
| 2013–2014 | 2,128 (15.3) | 1,556 (18.8) | 1,472 (17.8) | 1,550 (18.8) | ||||
| 2015–2016 | 2,269 (16.4) | 1,703 (20.6) | 1,665 (20.2) | 1,701 (20.6) | ||||
| 2017–2018 | 2,066 (14.9) | 1,400 (16.9) | 1,374 (16.7) | 1,390 (16.9) | ||||
| Order of TACE | 4.3±3.8 | 5.1±4.3 | 0.196 | <0.001 | 4.9±4.2 | 5.1±4.3 | 0.048 | 0.002 |
| HbA1c, % | 5.57±0.42 | 7.19±1.32 | 1.654 | <0.001 | 5.59±0.42 | 7.20±1.32 | 1.648 | <0.001 |
| Perioperative average glucose, mg/dL | 118.0±26.5 | 194.7±57.0 | 1.726 | <0.001 | 118.9±26.5 | 194.8±57.1 | 1.705 | <0.001 |
| eGFR, mL/min/1.73 m2 | 93.26±25.33 | 87.87±28.04 | 0.202 | <0.001 | 89.50±23.27 | 87.99±28.00 | 0.058 | <0.001 |
| MELD score | 8.74±2.42 | 9.01±2.59 | 0.107 | <0.001 | 8.95±2.57 | 9.01±2.58 | 0.022 | 0.167 |
| AFP, ng/mL | 9,544±134,368 | 3,191±31,642 | 0.065 | <0.001 | 2,962±31,674 | 3,191±31,642 | 0.007 | 0.642 |
Values are presented as mean±standard deviation or number (%).
DM, diabetes mellitus; SMD, absolute standard mean difference; BMI, body mass index; TACE, transarterial chemoembolization; HbA1c, glycosylated hemoglobin; eGFR, estimated glomerular filtration rate; MELD, the Model for End-Stage Liver Disease; AFP, alpha fetoprotein.
a Propensity score was matched for age, sex, BMI, year of TACE, the order of TACE, eGFR, MELD score, and AFP using the 1:1 nearest method.
| Variable |
Before matching |
After matchinga |
||||
|---|---|---|---|---|---|---|
| Non-DM | DM | P value | Non-DM | DM | P value | |
| Bacteremia | 60 (0.4) | 52 (0.6) | 0.060 | 30 (0.4) | 52 (0.6) | 0.020 |
| AKI | 124 (0.9) | 148 (1.8) | <0.001 | 75 (0.9) | 147 (1.8) | <0.001 |
| AKI stage 1 | 91 (0.7) | 116 (1.4) | <0.001 | 57 (0.7) | 115 (1.4) | <0.001 |
| AKI stage 2 | 19 (0.1) | 9 (0.1) | 0.722 | 10 (0.1) | 9 (0.1) | 0.999 |
| AKI stage 3 | 14 (0.1) | 23 (0.3) | 0.003 | 8 (0.1) | 23 (0.3) | 0.011 |
| Delayed discharge | 3,028 (21.8) | 1,501 (18.1) | <0.001 | 1,553 (18.8) | 1,490 (18.1) | 0.213 |
| Death within 2 weeks | 8 (0.1) | 5 (0.1) | 0.999 | 5 (0.1) | 5 (0.1) | 0.999 |
Values are presented as number (%).
DM, diabetes mellitus; AKI, acute kidney injury.
a Propensity score was matched for age, sex, body mass index, year of transarterial chemoembolization (TACE), the order of TACE, estimated glomerular filtration rate, the Model for End-Stage Liver Disease (MELD) score, and alpha fetoprotein using the 1:1 nearest method.
- 1. Frisch A, Chandra P, Smiley D, Peng L, Rizzo M, Gatcliffe C, et al. Prevalence and clinical outcome of hyperglycemia in the perioperative period in noncardiac surgery. Diabetes Care 2010;33:1783-8.ArticlePubMedPMCPDF
- 2. Kwon S, Thompson R, Dellinger P, Yanez D, Farrohki E, Flum D. Importance of perioperative glycemic control in general surgery: a report from the Surgical Care and Outcomes Assessment Program. Ann Surg 2013;257:8-14.ArticlePubMed
- 3. Thourani VH, Weintraub WS, Stein B, Gebhart SS, Craver JM, Jones EL, et al. Influence of diabetes mellitus on early and late outcome after coronary artery bypass grafting. Ann Thorac Surg 1999;67:1045-52.ArticlePubMed
- 4. van den Boom W, Schroeder RA, Manning MW, Setji TL, Fiestan GO, Dunson DB. Effect of A1C and glucose on postoperative mortality in noncardiac and cardiac surgeries. Diabetes Care 2018;41:782-8.ArticlePubMedPDF
- 5. American Diabetes Association. 15. Diabetes care in the hospital: standards of medical care in diabetes-2021. Diabetes Care 2021;44(Suppl 1):S211-20.
- 6. Joshi GP, Chung F, Vann MA, Ahmad S, Gan TJ, Goulson DT, et al. Society for Ambulatory Anesthesia consensus statement on perioperative blood glucose management in diabetic patients undergoing ambulatory surgery. Anesth Analg 2010;111:1378-87.ArticlePubMed
- 7. Umpierrez GE, Hellman R, Korytkowski MT, Kosiborod M, Maynard GA, Montori VM, et al. Management of hyperglycemia in hospitalized patients in non-critical care setting: an endocrine society clinical practice guideline. J Clin Endocrinol Metab 2012;97:16-38.ArticlePubMed
- 8. Hoole SP, Bambrough P. Recent advances in percutaneous coronary intervention. Heart 2020;106:1380-6.ArticlePubMed
- 9. Lindsay J, Sharma AK, Canos D, Nandalur M, Pinnow E, Apple S, et al. Preprocedure hyperglycemia is more strongly associated with restenosis in diabetic patients after percutaneous coronary intervention than is hemoglobin A1C. Cardiovasc Revasc Med 2007;8:15-20.ArticlePubMed
- 10. Wang Y, Liu K, Xie X, Song B. Contrast-associated acute kidney injury: an update of risk factors, risk factor scores, and preventive measures. Clin Imaging 2021;69:354-62.ArticlePubMed
- 11. Ritsinger V, Malmberg K, Martensson A, Ryden L, Wedel H, Norhammar A. Intensified insulin-based glycaemic control after myocardial infarction: mortality during 20 year follow-up of the randomised Diabetes Mellitus Insulin Glucose Infusion in Acute Myocardial Infarction (DIGAMI 1) trial. Lancet Diabetes Endocrinol 2014;2:627-33.ArticlePubMed
- 12. European Association for the Study of the Liver; European Organisation for Research and Treatment of Cancer. EASLEORTC clinical practice guidelines: management of hepatocellular carcinoma. J Hepatol 2012;56:908-43.ArticlePubMed
- 13. Lencioni R, de Baere T, Soulen MC, Rilling WS, Geschwind JF. Lipiodol transarterial chemoembolization for hepatocellular carcinoma: a systematic review of efficacy and safety data. Hepatology 2016;64:106-16.ArticlePubMed
- 14. Tolman KG, Fonseca V, Dalpiaz A, Tan MH. Spectrum of liver disease in type 2 diabetes and management of patients with diabetes and liver disease. Diabetes Care 2007;30:734-43.ArticlePubMedPDF
- 15. Zein NN, Abdulkarim AS, Wiesner RH, Egan KS, Persing DH. Prevalence of diabetes mellitus in patients with end-stage liver cirrhosis due to hepatitis C, alcohol, or cholestatic disease. J Hepatol 2000;32:209-17.ArticlePubMed
- 16. Mehta RL, Kellum JA, Shah SV, Molitoris BA, Ronco C, Warnock DG, et al. Acute Kidney Injury Network: report of an initiative to improve outcomes in acute kidney injury. Crit Care 2007;11:R31.ArticlePubMedPMC
- 17. Kotagal M, Symons RG, Hirsch IB, Umpierrez GE, Dellinger EP, Farrokhi ET, et al. Perioperative hyperglycemia and risk of adverse events among patients with and without diabetes. Ann Surg 2015;261:97-103.ArticlePubMedPMC
- 18. Gandhi GY, Murad MH, Flynn DN, Erwin PJ, Cavalcante AB, Bay Nielsen H, et al. Effect of perioperative insulin infusion on surgical morbidity and mortality: systematic review and meta-analysis of randomized trials. Mayo Clin Proc 2008;83:418-30.ArticlePubMed
- 19. Pietrosi G, Miraglia R, Luca A, Vizzini GB, Fili’ D, Riccardo V, et al. Arterial chemoembolization/embolization and early complications after hepatocellular carcinoma treatment: a safe standardized protocol in selected patients with child class A and B cirrhosis. J Vasc Interv Radiol 2009;20:896-902.ArticlePubMed
- 20. Chung JW, Park JH, Han JK, Choi BI, Han MC, Lee HS, et al. Hepatic tumors: predisposing factors for complications of transcatheter oily chemoembolization. Radiology 1996;198:33-40.ArticlePubMed
- 21. Silver SA, Shah PM, Chertow GM, Harel S, Wald R, Harel Z. Risk prediction models for contrast induced nephropathy: systematic review. BMJ 2015;351:h4395.ArticlePubMedPMC
- 22. Heyman SN, Rosenberger C, Rosen S, Khamaisi M. Why is diabetes mellitus a risk factor for contrast-induced nephropathy? Biomed Res Int 2013;2013:123589.ArticlePubMedPMCPDF
- 23. Carey IM, Critchley JA, DeWilde S, Harris T, Hosking FJ, Cook DG. Risk of infection in type 1 and type 2 diabetes compared with the general population: a matched cohort study. Diabetes Care 2018;41:513-21.ArticlePubMedPDF
- 24. Critchley JA, Carey IM, Harris T, DeWilde S, Hosking FJ, Cook DG. Glycemic control and risk of infections among people with type 1 or type 2 diabetes in a large primary care cohort study. Diabetes Care 2018;41:2127-35.ArticlePubMedPDF
- 25. Peleg AY, Weerarathna T, McCarthy JS, Davis TM. Common infections in diabetes: pathogenesis, management and relationship to glycaemic control. Diabetes Metab Res Rev 2007;23:3-13.ArticlePubMed
- 26. Schuetz P, Castro P, Shapiro NI. Diabetes and sepsis: preclinical findings and clinical relevance. Diabetes Care 2011;34:771-8.ArticlePubMedPMCPDF
- 27. Alexiewicz JM, Kumar D, Smogorzewski M, Klin M, Massry SG. Polymorphonuclear leukocytes in non-insulin-dependent diabetes mellitus: abnormalities in metabolism and function. Ann Intern Med 1995;123:919-24.ArticlePubMed
- 28. Rubinstein R, Genaro AM, Motta A, Cremaschi G, Wald MR. Impaired immune responses in streptozotocin-induced type I diabetes in mice: involvement of high glucose. Clin Exp Immunol 2008;154:235-46.ArticlePubMedPMCPDF
- 29. Nadelson J, Satapathy SK, Nair S. Glycated hemoglobin levels in patients with decompensated cirrhosis. Int J Endocrinol 2016;2016:8390210.ArticlePubMedPMCPDF
- 30. Sehrawat T, Jindal A, Kohli P, Thour A, Kaur J, Sachdev A, et al. Utility and limitations of glycated hemoglobin (HbA1c) in patients with liver cirrhosis as compared with oral glucose tolerance test for diagnosis of diabetes. Diabetes Ther 2018;9:243-51.ArticlePubMedPMCPDF
- 31. Umpierrez GE, Isaacs SD, Bazargan N, You X, Thaler LM, Kitabchi AE. Hyperglycemia: an independent marker of inhospital mortality in patients with undiagnosed diabetes. J Clin Endocrinol Metab 2002;87:978-82.ArticlePubMed
 PubReader
 ePub Link
 Cite
Cite