- Current
- Browse
- Collections
-
For contributors
- For Authors
- Instructions to authors
- Article processing charge
- e-submission
- For Reviewers
- Instructions for reviewers
- How to become a reviewer
- Best reviewers
- For Readers
- Readership
- Subscription
- Permission guidelines
- About
- Editorial policy
Articles
- Page Path
- HOME > Diabetes Metab J > Volume 44(4); 2020 > Article
-
Original ArticleComplications Therapeutic Effects of Fibroblast Growth Factor-21 on Diabetic Nephropathy and the Possible Mechanism in Type 1 Diabetes Mellitus Mice
-
Wenya Weng1
 , Tingwen Ge2, Yi Wang3, Lulu He4, Tinghao Liu4, Wanning Wang2, Zongyu Zheng2, Lechu Yu1, Chi Zhang1, Xuemian Lu1
 -
Diabetes & Metabolism Journal 2020;44(4):566-580.
DOI: https://doi.org/10.4093/dmj.2019.0089
Published online: May 15, 2020
1Ruian Center of the Chinese-American Institute for Diabetic Complications, the Third Affiliated Hospital of Wenzhou Medical University, Wenzhou, China.
2Cancer Center, the First Hospital of Jilin University, Changchun, China.
3Biological Engineering Department, School of Life Science, Anhui Medical University, Hefei, China.
4The Chinese-American Research Institute for Diabetic Complications, Wenzhou Medical University, Wenzhou, China.
- Corresponding author: Xuemian Lu. Ruian Center of Chinese-American Research Institute for Diabetic Complications, Wenzhou Medical University, Wenzhou, Zhejiang 325200, China. lu89118@medmail.com.cn
- Corresponding author: Chi Zhang. Ruian Center of the Chinese-American Institute for Diabetic Complications, the Third Affiliated Hospital of Wenzhou Medical University, Wenzhou, Zhejiang 325200, China. zhangchi515@126.com
- *Wenya Weng and Tingwen Ge contributed equally to this study as first authors.
Copyright © 2020 Korean Diabetes Association
This is an Open Access article distributed under the terms of the Creative Commons Attribution Non-Commercial License (http://creativecommons.org/licenses/by-nc/4.0/) which permits unrestricted non-commercial use, distribution, and reproduction in any medium, provided the original work is properly cited.
ABSTRACT
-
Background
- Fibroblast growth factor 21 (FGF21) has been only reported to prevent type 1 diabetic nephropathy (DN) in the streptozotocin-induced type 1 diabetes mellitus (T1DM) mouse model. However, the FVB (Cg)-Tg (Cryaa-Tag, Ins2-CALM1) 26OVE/PneJ (OVE26) transgenic mouse is a widely recommended mouse model to recapture the most important features of T1DM nephropathy that often occurs in diabetic patients. In addition, most previous studies focused on exploring the preventive effect of FGF21 on the development of DN. However, in clinic, development of therapeutic strategy has much more realistic value compared with preventive strategy since the onset time of DN is difficult to be accurately predicted. Therefore, in the present study OVE26 mice were used to investigate the potential therapeutic effects of FGF21 on DN.
-
Methods
- Four-month-old female OVE26 mice were intraperitoneally treated with recombinant FGF21 at a dose of 100 µg/kg/day for 3 months. The diabetic and non-diabetic control mice were treated with phosphate-buffered saline at the same volume. Renal functions, pathological changes, inflammation, apoptosis, oxidative stress and fibrosis were examined in mice of all groups.
-
Results
- The results showed that severe renal dysfunction, morphological changes, inflammation, apoptosis, and fibrosis were observed in OVE26 mice. However, all the renal abnormalities above in OVE26 mice were significantly attenuated by 3-month FGF21 treatment associated with improvement of renal adenosine 5′-monophosphate (AMP)-activated protein kinase (AMPK) activity and sirtuin 1 (SIRT1) expression.
-
Conclusion
- Therefore, this study demonstrated that FGF21 might exert therapeutic effects on DN through AMPK-SIRT1 pathway.
- According to the epidemiology of kidney disease in the United States, diabetic nephropathy (DN) is one of the most serious complications of diabetes throughout the world, with 40% of the end-stage renal diseases (ESRD) caused by it [1]. The main pathological features of DN are glomerular hypertrophy, accumulation of extracellular matrix, mesangial broadening and basement membrane thickening. The changes of glomerular filtration barrier and proteinuria lead to glomerular sclerosis and renal interstitial fibrosis, resulting in end-stage renal disease [2].
- The currently used anti-antidiabetic drugs usually cause severe side effects such as edema and hypoglycemia [3]. However, fibroblast growth factor (FGF) 21, a member of the FGF family, possesses a potentially metabolic therapeutic outlook in the clinic because of its astounding non-proliferative, non-edema- and non-hypoglycemia-causing safety natures [3]. Studies showed that type 2 diabetes mellitus (T2DM) with renal abnormalities always displayed higher serum FGF21 levels [45]. In addition, Wei et al. [6] demonstrated that elevated endogenous FGF21 in kidney could prevent the development of DN induced by T2DM. And accumulated studies elucidated that administration of exogenous FGF21 played a significant role in preventing T2DM-induced renal abnormalities as characterized by attenuating renal inflammation, apoptosis, oxidative stress, fibrosis, and insulin resistance [78]. Up to date, all the renal protective effect induced by FGF21 belongs to preventive effect. However, in the clinic, it is difficult to identify the onset time of DN since most patients do not display abnormal clinical symptoms during this period [9]. Therefore, there is a realistic clinical value to develop therapeutic strategy of FGF21 against DN compare to preventive strategy.
- Adenosine 5′-monophosphate (AMP)-activated protein kinase (AMPK) is highly expressed in the kidney which plays an important role in regulating glucose and lipid metabolism [1011]. Strong evidence demonstrated that the progression of DN is associated with impaired renal AMPK activation (phosphorylation) [1213]. Additionally, activation of AMPK reduces the production and accumulation of collagen and fibronectin in the kidney of DN mice [12]. Sirtuin 1 (SIRT1) is an NAD+-dependent lysine deacetylase which is involved in a wide range of physiological functions, including control of gene expression, metabolism and aging [1415]. Reduced SIRT1 expression was observed in both renal proximal tubules (PTs) and podocytes in diabetic mice, which finally contributed to albuminuria [13]. Moreover, Papadimitriou et al. [16] demonstrated that maintenance of SIRT1 expression and activity is beneficial for the kidney under DN condition. As we know, both AMPK and SIRT1 are the classic downstream kinase of FGF21. Strong evidence demonstrated that FGF21 suppressed diabetes-induced tissue damages in several tissues by activation AMPK-mediated pathway [1718]. In addition, SIRT1 is required for FGF21-induced protection on heart and testis under diabetic condition [1819].
- Although approximately only 10% diabetic patients belongs to type 1 diabetes mellitus (T1DM), the incidence of DN is higher than T2DM patients, approximately one-third of them will develop DN over the course of their lifetime [20]. Although our previous study confirmed that administration of exogenous FGF21 attenuated the renal damage in T1DM mice [21], the study was considered as preventive study since mice received FGF21 treatment once T1DM was diagnosed.
- In the present study we mainly focus on identifying the hypothesis that FGF21 induces therapeutic effect on DN and the underling mechanisms. In order to verify the hypothesis, FVB (Cg)-Tg (Cryaa-Tag, Ins2-CALM1) 26OVE/PneJ (OVE26) mice which spontaneously induced T1DM were applied in the present study. OVE26 is a commonly recommended mouse model for DN study since it can ideally mimic DN in human [22]. Four-month-old female OVE26 were treated with FGF21 (100 µg/kg/day) for 3 months.
- Renal functions, pathological changes, inflammation, oxidative stress, apoptosis, and fibrosis were explored to evaluate the therapeutic effect of FGF21 on DN. Additionally the impact of FGF21 on renal AMPK and SIRT1 pathway was also identified to dissect the mechanism of FGF21-induced renal protection against DN.
INTRODUCTION
- Animals
- The Friend Virus B NIH Jackson (FVB/NJ) background of transgenic T1DM mouse model FVB (Cg)-Tg (Cryaa-Tag, Ins2-CALM1) 26OVE/PneJ (OVE26) has been used in our previous study [23]. OVE26 mice usually experience serious hyperglycemia before 3 weeks of age and severe albuminuria by four-month old. Since Xu et al. [24] have found that OVE26 female mice exhibit more severe albuminuria than male mice, 4-month-old female diabetic OVE26 mice that generated severe albuminuria were separated into two groups at random: one group was set as the untreated diabetic group (diabetes mellitus [DM], n=10) and the other group was defined as FGF21-treated diabetic group (DM/FGF21, n=6). Four-month-old female non-diabetic FVB/NJ mice were set as the control (FVB/NJ, n=9). For DM/FGF21 mice, recombinant human FGF21 (Wenzhou Medical University, Zhejiang, China) was applied intraperitoneally at a dose of 100 µg/kg/day for 3 months started at 4 months of age. Non-FGF21-treated mice received the equivalent volume of phosphate-buffered saline (PBS). All of the animals were taken care of under specialized pathogen-free cages in which they can easily obtain food and water through a 12-12 hour day-night cycle, in coordination with the approved protocols and guidelines of the care and use of laboratory animals and Wenzhou Medical University Animal Policy and Welfare Committee (IRB number: SYXK2015-0009, Zhejiang, China). At the final checkpoint (7 months old) (Fig. 1A) after the measurement of body weight, euthanasia was performed followed by the acquisition of blood samples and kidney tissue. Tibia length and kidney weight of mice in all groups were measured. Finally, kidneys were stored in liquid nitrogen for future analysis of protein and RNA, as well as for pathological tests.
- Histopathological examination and immunohistochemistry
- Kidney tissue was fixed in 10% phosphate-buffered formalin for 24 hours. Then, after dehydrated in graded alcohol and solutions, the tissue was embedded in paraffin and cut into 5-um thick sections for pathological and immune-histochemical staining. Hematoxylin and eosin (H&E) staining was used for general morphological detection, while periodic acid-Schiff (PAS) staining and picrosirius red staining were used for glomerulosclerosis and renal collagen accumulation. For immunohistochemistry, slides were heated for antigen retrieval followed by treatment with different primary antibodies, respectively, including Wilms tumor (WT1, 1:1,000) purchased from Santa Cruz Biotechnology; CD68 (1:200, Abcam, Cambridge, UK), CD3 (1:200, Abcam) overnight at 4℃. After washing for four times with PBS, the slides were incubated with biotin-labeled secondary antibodies (1:500, Abcam) for 2 hours at room temperature. Finally, after 5 washes of PBS, DAB (3, 3-diaminobenzidine, Vector Laboratories, Burlingame, CA, USA) was applied for color development. All of the images were analyzed with Image Pro Plus 6.0 software (Media Cybernetics, Rockville, MD, USA).
- TUNEL assay
- The sections were treated with 3% hydrogen peroxide for 30 minutes at room temperature followed by proteinase K for 40 minutes at 37℃. After that the slices were incubated with reaction reagent containing TdT and digoxigenin-conjugated dUTP for 60 minutes at 37℃. Meanwhile, reaction reagent without TdT was applied to a negative control. DAB was then applied to display the color of the stained index.
- Detection of plasma FGF21
- Blood samples were collected in a lithium heparin tube (BD) immediately after euthanasia and centrifuged at 3,000 rpm for 15 minutes at 4℃ to isolate plasma. The plasma FGF21 level was measured using the human FGF21 Quantikine Elisa kit (R&D Systems, Minneapolis, MN, USA) according to the manufacturer's instructions and protocols.
- Evaluation of renal function
- Blood samples were collected in a lithium heparin tube (BD) immediately after euthanasia and centrifuged at 3,000 rpm for 15 minutes at 4℃ to isolate plasma to measure the plasma creatinine. After treatment with FGF21 for 1 and 3 months, the mice were individually placed into a metabolic cage to collect 24-hour urine samples for examining renal function parameters including the urine albumin and urine creatinine.
- 24-Hour urine albumin: Urine albumin was detected according to the manufacturers' instructions and protocols (Bethyl Laboratories, Montgomery, TX, USA).
- Urine creatinine: Urine creatinine was examined using QuantiChrom Creatinine Assay Kit (DICT-500) from Bioassay systems (Hayward, CA, USA).
- Plasma creatinine: Plasma creatinine was examined according to the manufacturers' instructions and protocols of Serum Creatinine Detection Kit (Arbor Assays, Ann Arbor, MI, USA).
- Glomerular filtration rate (GFR) was calculated according to the following formula:
- Lipid peroxidation
- Measurement of renal Malondialdehyde (MDA): The concentration of MDA was detected by thiobarbituric acid (TBA) acid assay as an index of lipid peroxidation, as previously described [25].
- Western blot assay
- Kidney cortex tissues were crushed in lysis buffer with a homogenizer and centrifuged at 12,000 g at 4℃ for 10 minutes (Beckman GS-6R; Beckman Coulter, Brea, CA, USA). Protein concentration was measured by the Bradford assay. After being diluted in loading buffer and denatured at 95℃ for 5 minutes, the samples were separated in 10% SDS-polyacrylamide gelelectrophoresis (10% SDS-PAGE) followed by being transferred into nitrocellulose membranes for separation. After blocking with 5% dried non-fat milk solution for 1 hour at room temperature, the membrane was incubated with these primary antibodies, including: connective tissue growth factor (CTGF, 37 kDa), tumor necrosis factor α (TNF-α, 25 kDa), sirtuin 1 (SIRT1, 121 kDa), heme oxygenase-1 (HO-1, 28 kDa), NAD(P)H dehydrogenase [quinone]-1 (NQO-1, 29 kDa), superoxide dismutase 2 (SOD2, 22 kDa), and β-actin (45 kDa) purchased from Santa Cruz Biotechnology; alpha smooth muscle actin (α-SMA, 42 kDa), BCL-2-associated X protein (Bax, 20 kDa), Bcl-2 (26 kDa), catalase (CAT, 60 kDa), p38MAP kinase (MAPK, 40 kDa), phospho-p38MAP kinase (p-38MAPK, 40 kDa), phospho-ERK1/2 (44 kDa), ERK1/2 (44 kDa), phospho-AMPK (62 kDa) and AMPK (62 kDa) purchased from Cell Signaling Technology; CD68 (110 kDa), CD3 (19 kDa), intercellular adhesion molecule-1 (ICAM, 90 kDa), and fibronectin (263 kDa) purchased from Abcam; 3-nitrotyrosine (3-NT) from EMD Millipore (Burlington, MA, USA); and 4 hydroxynonenal (4-HNE) purchased from Alpha Diagnostic Intl Inc. (San Antonio, TX, USA). Membranes were incubated with appropriate secondary antibodies for 1 hour at room temperature following three washes with Tris-buffered saline (pH 7.2) containing 0.05% Tween 20. Antigen-antibody complexes were visualized with ECL substrate (Bio-Rad Laboratories, Hercules, CA, USA).
- Real-time qPCR
- RNA and cDNA were extracted according to the manufacturer's protocol from Trizol reagent (Invitrogen, Carlsbad, CA USA) and RNA PCR kit (Promega, Madison, WI, USA), respectively. Real-time qPCR (quantitative PCR, qPCR) was carried out according to the protocol of TaqMan Universal PCR Master Mix (ThermoFisher Scientific, Waltham, MA, USA) as previously described [26]. TaqMan primers for SIRT1 and β-actin control primer were purchased from Applied Biosystems (Carlsbad, CA, USA).
- Statistical analysis
- Data from repeated experiments are presented as mean±SD. PAS staining and picrosirius red staining were identified by Image Pro Plus 6.0 software and Western blot data were analyzed by Image Quant 5.2 software (GE Healthcare Biosciences). Comparisons were performed by analysis of variance (ANOVA) for the different groups, followed by post hoc pair wise repetitive comparisons using LSD test with SPSS data analysis (IBM SPSS Statistics version 19.0; IBM Co., Armonk, NY, USA). Statistical significance was considered as P<0.05.
METHODS
- The impact of FGF21 on body weight, blood glucose and renal function in DN mice
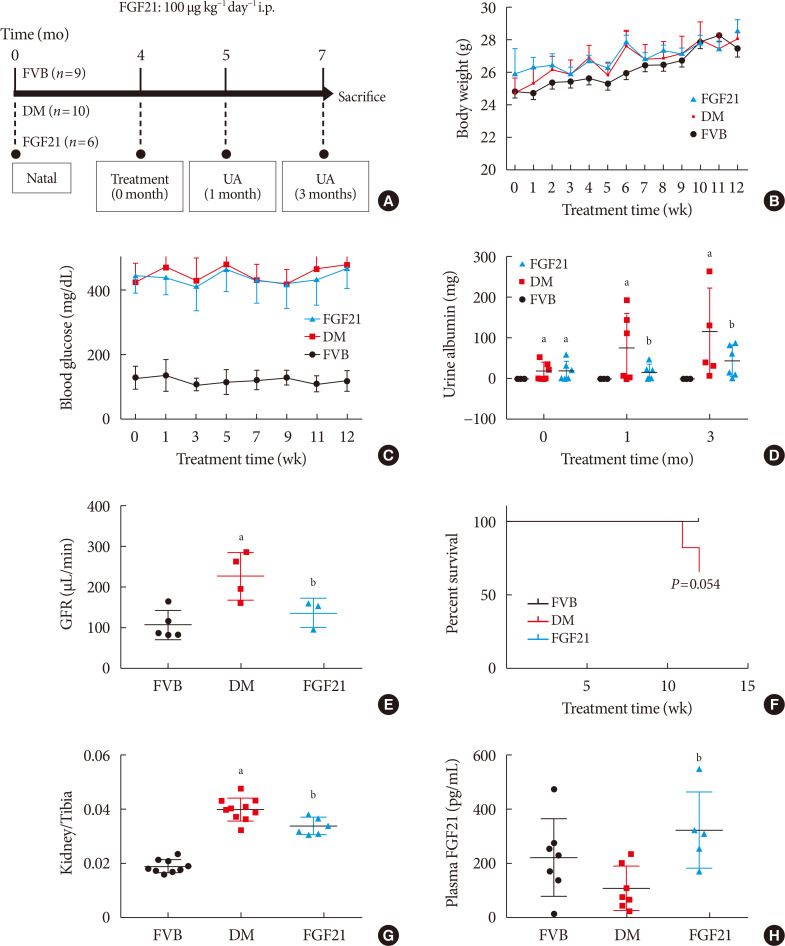
- Elevation of body weight of mice during the FGF21-treated period of all of the groups was comparable (Fig. 1B). Hyperglycemia was stably observed not only in PBS-treated OVE26 mice (DM group), but also in FGF21-treated OVE26 mice (FGF21/DM group), indicating that FGF21 at the dose of 100 ug/kg/day had no glucose-lowering effect (Fig. 1C). As the key index reflecting renal function, the 24-hour urinary albumin assay suggested that DN was diagnosed in 4-month-old OVE26 mice based on the significant increase in urinary albumin compared to the FVB group (Fig. 1D). And urinary albumin was further enhanced in both 1- and 3-month PBS-treated OVE26 mice. However, treatment with exogenous FGF21 for both 1 and 3 months notably reduced 24-hour urinary albumin (Fig. 1D). The result of GFR demonstrated that GFR of OVE26 mice was significantly increased compared with FVB mice at the age of 7 months while FGF21 improved the GFR after 3 months treatment (Fig. 1E), suggesting that FGF21 induced a beneficial effect on improving renal function in OVE26 mice. The survival curve showed that the FGF21 improved the viability of OVE26 mice (Fig. 1F). Similarly, the ratio of renal weight to tibia length was strongly increased in DM group, which was slightly, but significantly decreased by supplement of exogenous FGF21 (Fig. 1G). Additionally, ELISA results showed that plasma rhFGF21 was remarkably higher in FGF21/DM group than that in DM group (Fig. 1H), indicating that exogenous FGF21 was indeed injected into the mice.
- FGF21 treatment attenuated diabetes-induced renal pathological changes in OVE26 mice
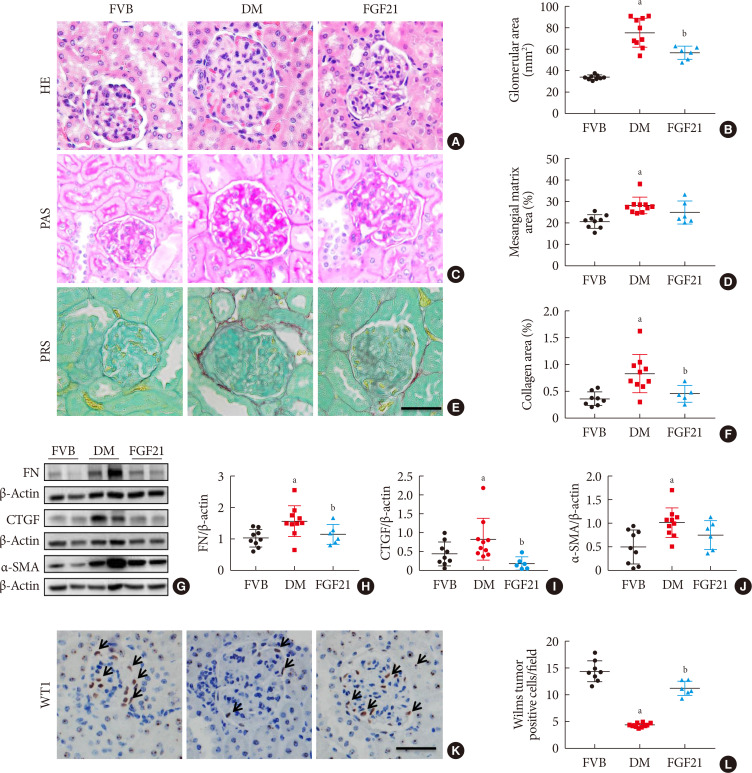
- To identify the impact of FGF21 on renal pathological changes, H&E staining (Fig. 2A and B), PAS staining (Fig. 2C and D), and picrosirius red staining (Fig. 2E and F) were performed in this study. H&E staining and PAS staining showed that renal structure abnormalities of OVE26 mice were more severe than those of FVB mice with the characters of glomerular hypertrophy, thickened glomerular basement membranes as well as mesangial matrix expansion and mesangial cells proliferation (Fig. 2A–D), which were attributed to glomerular sclerosis. However, all these abnormalities were attenuated after 3-month FGF21 treatment (Fig. 2A–D). Picrosirius red staining was applied to examine the accumulation of collagen, which is a marker of interstitial fibrosis. As shown in Fig. 2E and F, picrosirius red positive staining area in the renal tissue of 3-month PBS treatment OVE26 mice is larger than that in FVB mice, indicating that significant renal fibrosis existed in 3-month PBS treatment OVE26 mice. In contrast, 3-month-treatment of FGF21 notably induced an anti-fibrotic effect characterized by reducing the positive area of picrosirius red staining (Fig. 2E and F). The anti-fibrotic effect of FGF21 in the diabetic kidney was further confirmed by the reduced content of fibrotic markers including fibronectin (FN) (Fig. 2G and H), CTGF (Fig. 2G and I), and α-SMA (Fig. 2G and J) compared with PBS-treated OVE26 mice. Increasing evidence demonstrated that glomerulopathy was mainly attributed to podocyte. Additional immunohistochemistry staining showed that the expression of WT1, a specific marker of podocyte, was significantly reduced in 3-month PBS treatment OVE26 mice, which was dramatically reversed by FGF21 supplement (Fig. 2K and L), implying that podocyte is a protective target of FGF21 under DN condition.
- The impact of FGF21 on renal inflammation, apoptosis and oxidative stress in the diabetic kidney of OVE26 mice
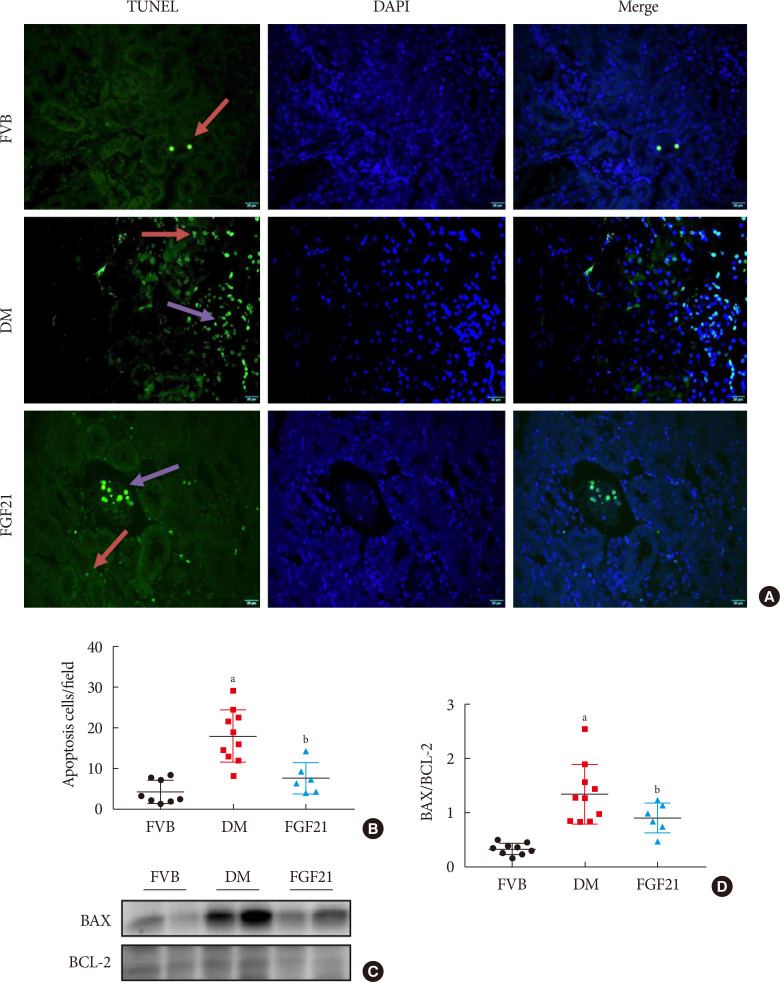
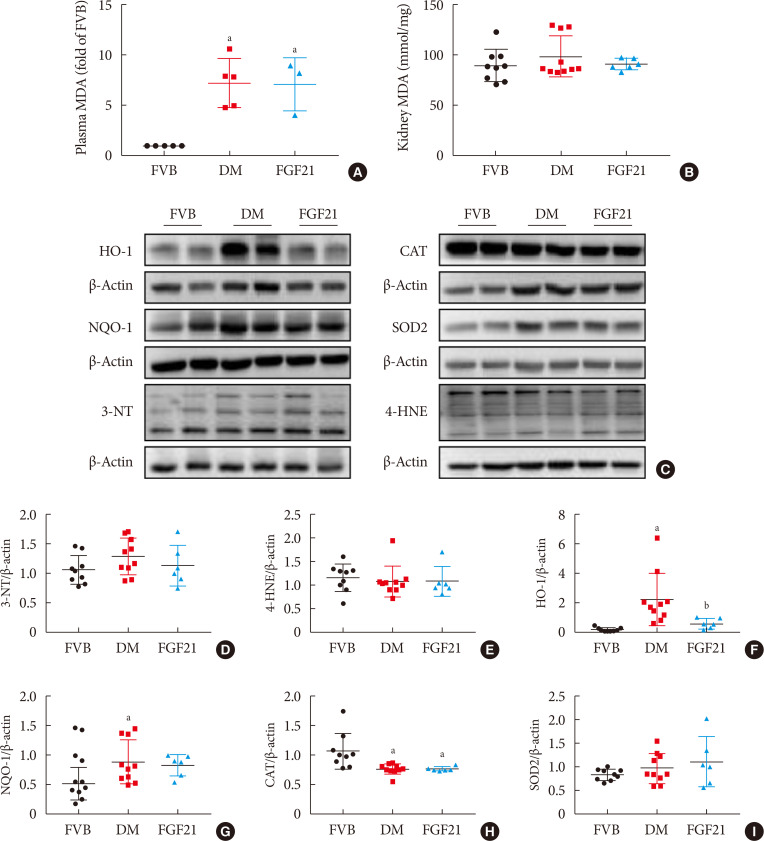
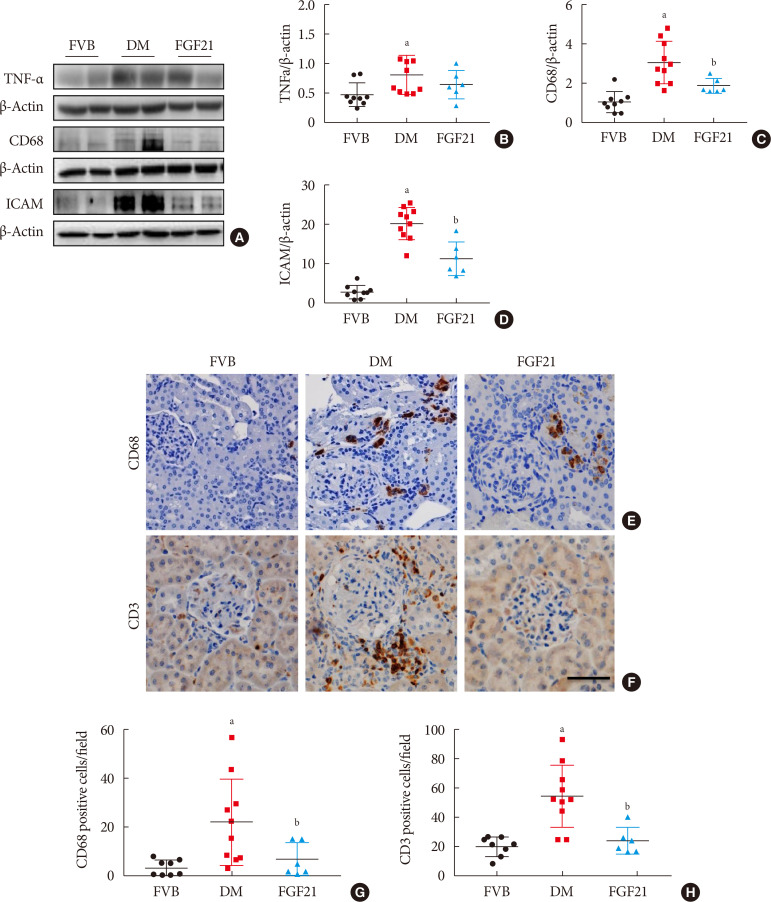
- Inflammation, apoptosis, and oxidative stress are the main pathogeneses of diabetes-induced renal damage, which were examined in the present study. The results showed the expression of multiple pro-inflammatory factors including TNF-α (Fig. 3A and B), CD68 (Fig. 3A and C) and ICAM (Fig. 3A and D) significantly increased in the kidney of 3-month PBS treatment OVE26 mice indicating severe renal inflammation situation existed. Renal inflammation was further confirmed by increased content of CD68 (Fig. 3E and G) and CD3 (Fig. 3F and H) examined via immunohistochemistry staining. However, all the abnormally elevated inflammatory markers above in the diabetic kidney were attenuated by 3-month FGF21 treatment (Fig. 3), indicating that FGF21-induced renal therapeutic effect was associated with the attenuation of renal inflammation. Terminal deoxynucleotidyl transferase-mediated dUTP nick end labeling (TUNEL) staining showed the number of apoptotic cells was significantly increased in 3-month PBS treatment OVE26 mice (Fig. 4A and B), which was notably suppressed by 3-month FGF21 treatment (Fig. 4A and B). Moreover, FGF21-induced anti-apoptotic effect was further confirmed by the ratio decrease of BAX to BCL-2 (Fig. 4C and D). Unexpectedly, although oxidative stress is regarded as one of the important inducers and markers of DN, in the present study elevated oxidative stress was only observed in plasma. Result of plasma MDA (Fig. 5A) showed that plasma MDA was significantly increased in 3-month PBS-treated OVE26 mice. Unfortunately, FGF21 failed to restore it. However, elevated oxidative stress was not observed in the kidney of 3-month PBS-treated OVE26 mice due to the unchanged expression of classic oxidative markers, including kidney MDA (Fig. 5B), 3-NT (Fig. 5C and D), 4-HNE (Fig. 5C and E). The expression of HO-1 (Fig. 5C and F) and NQO-1 (Fig. 5C and G) was remarkably increased while CAT expression (Fig. 5C and H) was reduced in the kidney of 3-month PBS treatment OVE26 mice. Moreover, diabetes did not affect renal SOD2 expression (Fig. 5C and I). Among them, we only found that renal HO-1 expression had fallen back to the control level after 3 months of treatment with FGF21 (Fig. 5C and F).
- FGF21-induced renal therapeutic effect against DN might be through activation of the AMPK-SIRT1 pathway
- In Fig. 6, we demonstrated that diabetes down-regulated but FGF21 maintained ERK1/2, P38, AMPK phosphorylation in OVE26 mice (Fig. 6A–D). Additionally, we found both reduced mRNA level of SIRT1 (Fig. 6E) and SIRT1 expression (Fig. 6A and F) in the kidney of 3-month PBS treatment OVE26 mice were reversed by treatment of FGF21 for 3 months, indicating AMPK and SIRT1 might be involved in FGF21-induced renal therapeutic effect against DN. We also examined the phosphorylation of signal transducer and activator of transcription 3 (STAT3) which is considered to be the downstream of p-AMPK [2728]. The results showed that the elevation of p-STAT3 in the kidney of 3-month PBS treatment OVE26 mice was reversed by treatment of FGF21 for 3 months (Fig. 6A and G).
RESULTS
- DN is characterized by glomerular hypertrophy, accumulation of extracellular matrix, mesangial broadening and basement membrane thickening. The changes of glomerular filtration barrier and proteinuria lead to glomerular sclerosis and renal interstitial fibrosis, resulting in end-stage renal disease [229]. In comparison with the traditional anti-diabetic drugs in clinics, studies show that FGF21 is considered to be a safer drug because of its non-proliferative, non-edema- and non-hypoglycemia-causing natures [330]. Emerging evidence shows that FGF21 induces preventive effect on DN [731]. However, in the clinic, it is difficult to identify the onset time of DN since most patients have no clinical symptoms at the early stage of DN [9]. Therefore, how to design a preventive strategy using FGF21 is still unclear. Compared to preventive strategy, designing therapeutic strategy of FGF21 against DN is possible, realistic and meaningful. Based on that, 4-month-old OVE26 mice, which normally spontaneously induce T1DN, were applied in the study since the OVE26 mouse is considered as the most suitable model to mimic human T1DM-induced DN, especially the late-stage DN in clinic with the characteristic of persistent proteinuria, mesangial matrix expansion, and interstitial fibrosis [2232]. Our previous work demonstrated that FVB mice treated with FGF21 showed no side effect in kidney [21]. Therefore, there are only three groups applied in this study. As expected, the results showed that obvious DN symptoms was observed in 3-month PBS treatment OVE26 mice characterized by albuminuria, glomerular hypertrophy, thickened basement membrane, mesangial matrix expansion, and mesangial cells proliferation, as well as an increase in renal inflammation, apoptosis, and fibrosis. However, the above symptoms of DN in OVE26 mice were significantly attenuated by FGF21 treatment for 3 months at the dose of 100 µg/kg/day, indicating, for the first time, that FGF21 induces a therapeutic effect on DN in OVE26 mice. We chose the dose of 100 µg/kg/day because our previous studies demonstrated that recombinant FGF21 synthesized by ourselves exerted preventive effects on diabetic mice [1721]. Therefore, we continue to use this dose to explore whether FGF21 plays a therapeutic role on DN in OVE26 T1DM mice.
- Although the plasma MDA was significantly elevated in DM mice, FGF21 failed to reduce it. Plasma MDA may be directly affected by hyperglycemia and lipotoxicity; but FGF21 is not an antioxidant so that it is unable to directly affect its changes. In addition, plasma MDA may include the portions released from all organs; but FGF21 may not actually distribute in all organs so that overall FGF21 fails to improve the plasma oxidative stress situation, but the overall outcome is to protect the kidney. Furthermore, there was no apparent oxidative stress damage in the kidney of 7-month-old OVE26 mice. The possible explanations include the following points. (1) Under the circumstance of DN, long-term adaptive response was induced in the kidney with the evidence of upregulated antioxidants, including HO-1, and NQO-1 to scavenge the excessive free radicals. However, in the present study another important antioxidant, CAT, was decreased in the 3-month PBS treatment diabetic kidney, implying that under DN condition, different antioxidant was mediated by different signaling which has different response to DN. (2) Besides the antioxidant property, in recent years, HO-1 was confirmed to possesses a pathogenic property of aggravating chronic inflammation [3334]. Strong evidence demonstrated that moderate expression levels of HO-1 induced beneficial effects in cell survival, while excessive expression levels of it triggered negative effects [35]. In our study, renal HO-1 expression was extremely induced in the kidneys of 3-month PBS treatment OVE26 mice, implying that severe inflammation might exist in the diabetic kidney.
- Based on the identified therapeutic effect of FGF21 on DN, we next dissected the underlying mechanism. As we know, AMPK is a crucial factor associated with the regulation of glucose and lipid metabolism [1011]. Strong evidence demonstrated that hyperglycemia negatively regulated the activity of AMPK which could suppress the onset and progress of DN characterized by decreasing the expression of collagen and fibronectin in DN [36]. Additionally, growing evidence indicates that AMPK-mediated signaling pathway is always involved in FGF21-induced beneficial effects in several tissues under diabetic condition [171837]. Our previous study indicated that administration of exogenous FGF21 induced anti-apoptotic effect via increasing ERK1/2, p38MAPK, AMPK phosphorylation in diabetic hearts [17].
- SIRT1 is involved in multiple activities, such as various cellular processes including apoptotic, inflammatory changes, and energy efficiency [1415]. Moreover, reduced SIRT1 expression was observed in both renal PT and podocytes in diabetic mice, which finally contributed to albuminuria [1338]. Another study demonstrated that aging was accompanied by the reduction of SIRT1 expression in podocytes, which resulted in podocytes loss, albuminuria, and glomerular abnormalities [39]. Growing evidence demonstrated that FGF21 exerted positive functions on various damages through activation of SIRT1-mediated pathway [4041]. Furthermore, FGF21 was reported to be involved cardiomyopathy via SIRT1 in T1DM mice according to our previous work [19].
- Accumulated evidence has demonstrated that AMPK and SIRT1 are always involved in the same signaling pathway mediating FGF21's biofunction [4243]. It is reported that FGF21 has a protective effect on diabetes-induced damages via AMPK-SIRT1 in different tissues [1837]. Another study showed that FGF21 activated the phosphorylation of AMPK, through which SIRT1 became elevated and subsequently induced various metabolic pathways in diabetic adipocytes [37]. Nerstedt et al. [27] demonstrated that AMPK inhibited inflammatory response by suppressing phosphorylation of signal transducer and activator of transcription 3 (STAT3). In the present study, renal AMPK activity and SIRT1 expression were significantly decreased in DN mice which were notably reversed by FGF21 treatment while the elevation of p-STAT3 in DN mice was reversed by exogenous FGF21, implying that AMPK-SIRT1 might be required for FGF21 to induced renal protection such as anti-inflammation against DN.
- Although FGF21 has been reported to exert protective effects on experimental models [721], it is reported that elevated serum FGF21 is associated with human T2DM, adverse lipid profiles, obesity, metabolic syndrome, impaired glucose tolerance, and hypertension [44]. The possible explanations may be attributed to the followings. (1) Elevating studies demonstrate that these individuals may have FGF21 resistance, similar to the phenomenon of insulin resistance in these clinical conditions [4445]. (2) Serum FGF21 may exhibit compensatory elevation under damage state in clinic. However, experimental models are usually applied with FGF21 immediately when they develop renal damage, resulting in positive effect of FGF21 on the diseases.
- Here, we assumed that the therapeutic impact of FGF21 on T1DN was mediated by its regulation of the AMPK-SIRT1 pathway. Therefore, FGF21 has potential as a therapeutic drug for diabetic individuals who have developed DN.
DISCUSSION
-
Acknowledgements
- This study was supported by grants from the National Natural Science Foundation of China (81471045, to Xuemian Lu; 81670767 to Chi Zhang; 81700732 to Lechu Yu); the Medical and Healthy Technological Grant of Zhejiang Province (2015KYB236 to Chi Zhang).
ACKNOWLEDGMENTS
-
CONFLICTS OF INTEREST: No potential conflict of interest relevant to this article was reported.
-
AUTHOR CONTRIBUTIONS:
NOTES
- 1. Saran R, Robinson B, Abbott KC, Agodoa LYC, Bhave N, Bragg-Gresham J, Balkrishnan R, Dietrich X, Eckard A, Eggers PW, Gaipov A, Gillen D, Gipson D, Hailpern SM, Hall YN, Han Y, He K, Herman W, Heung M, Hirth RA, Hutton D, Jacobsen SJ, Jin Y, Kalantar-Zadeh K, Kapke A, Kovesdy CP, Lavallee D, Leslie J, McCullough K, Modi Z, Molnar MZ, Montez-Rath M, Moradi H, Morgenstern H, Mukhopadhyay P, Nallamothu B, Nguyen DV, Norris KC, O'Hare AM, Obi Y, Park C, Pearson J, Pisoni R, Potukuchi PK, Rao P, Repeck K, Rhee CM, Schrager J, Schaubel DE, Selewski DT, Shaw SF, Shi JM, Shieu M, Sim JJ, Soohoo M, Steffick D, Streja E, Sumida K, Tamura MK, Tilea A, Tong L, Wang D, Wang M, Woodside KJ, Xin X, Yin M, You AS, Zhou H, Shahinian V. US renal data system 2017 annual data report: epidemiology of kidney disease in the United States. Am J Kidney Dis 2018;71(3 Suppl 1):A7ArticlePubMedPMC
- 2. Klausen K, Borch-Johnsen K, Feldt-Rasmussen B, Jensen G, Clausen P, Scharling H, Appleyard M, Jensen JS. Very low levels of microalbuminuria are associated with increased risk of coronary heart disease and death independently of renal function, hypertension, and diabetes. Circulation 2004;110:32-35. ArticlePubMed
- 3. Kharitonenkov A, Shiyanova TL, Koester A, Ford AM, Micanovic R, Galbreath EJ, Sandusky GE, Hammond LJ, Moyers JS, Owens RA, Gromada J, Brozinick JT, Hawkins ED, Wroblewski VJ, Li DS, Mehrbod F, Jaskunas SR, Shanafelt AB. FGF-21 as a novel metabolic regulator. J Clin Invest 2005;115:1627-1635. ArticlePubMedPMC
- 4. El-Saeed AM, El-Mohasseb GF. Circulating fibroblast growth factors 21 and 23 as biomarkers of progression in diabetic nephropathy in type 2 diabetes with normoalbuminuria. Egypt J Immunol 2017;24:93-99. PubMed
- 5. Esteghamati A, Khandan A, Momeni A, Behdadnia A, Ghajar A, Nikdad MS, Noshad S, Nakhjavani M, Afarideh M. Circulating levels of fibroblast growth factor 21 in early-stage diabetic kidney disease. Ir J Med Sci 2017;186:785-794. ArticlePubMedPDF
- 6. Wei W, An XR, Jin SJ, Li XX, Xu M. Inhibition of insulin resistance by PGE1 via autophagy-dependent FGF21 pathway in diabetic nephropathy. Sci Rep 2018;8:9. ArticlePubMedPMCPDF
- 7. Kim HW, Lee JE, Cha JJ, Hyun YY, Kim JE, Lee MH, Song HK, Nam DH, Han JY, Han SY, Han KH, Kang YS, Cha DR. Fibroblast growth factor 21 improves insulin resistance and ameliorates renal injury in db/db mice. Endocrinology 2013;154:3366-3376. ArticlePubMedPDF
- 8. Shao M, Yu L, Zhang F, Lu X, Li X, Cheng P, Lin X, He L, Jin S, Tan Y, Yang H, Zhang C, Cai L. Additive protection by LDR and FGF21 treatment against diabetic nephropathy in type 2 diabetes model. Am J Physiol Endocrinol Metab 2015;309:E45-E54. ArticlePubMedPMC
- 9. Perkins BA, Ficociello LH, Roshan B, Warram JH, Krolewski AS. In patients with type 1 diabetes and new-onset microalbuminuria the development of advanced chronic kidney disease may not require progression to proteinuria. Kidney Int 2010;77:57-64. ArticlePubMedPMC
- 10. Kim WH, Lee JW, Suh YH, Lee HJ, Lee SH, Oh YK, Gao B, Jung MH. AICAR potentiates ROS production induced by chronic high glucose: roles of AMPK in pancreatic beta-cell apoptosis. Cell Signal 2007;19:791-805. PubMed
- 11. Yamauchi T, Kamon J, Minokoshi Y, Ito Y, Waki H, Uchida S, Yamashita S, Noda M, Kita S, Ueki K, Eto K, Akanuma Y, Froguel P, Foufelle F, Ferre P, Carling D, Kimura S, Nagai R, Kahn BB, Kadowaki T. Adiponectin stimulates glucose utilization and fatty-acid oxidation by activating AMP-activated protein kinase. Nat Med 2002;8:1288-1295. ArticlePubMedPDF
- 12. Papadimitriou A, Peixoto EB, Silva KC, Lopes de Faria JM, Lopes de Faria JB. Increase in AMPK brought about by cocoa is renoprotective in experimental diabetes mellitus by reducing NOX4/TGFβ-1 signaling. J Nutr Biochem 2014;25:773-784. ArticlePubMed
- 13. Hasegawa K, Wakino S, Simic P, Sakamaki Y, Minakuchi H, Fujimura K, Hosoya K, Komatsu M, Kaneko Y, Kanda T, Kubota E, Tokuyama H, Hayashi K, Guarente L, Itoh H. Renal tubular Sirt1 attenuates diabetic albuminuria by epigenetically suppressing claudin-1 overexpression in podocytes. Nat Med 2013;19:1496-1504. ArticlePubMedPMCPDF
- 14. Preyat N, Leo O. Sirtuin deacylases: a molecular link between metabolism and immunity. J Leukoc Biol 2013;93:669-680. ArticlePubMedPDF
- 15. Satoh A, Brace CS, Ben-Josef G, West T, Wozniak DF, Holtzman DM, Herzog ED, Imai S. SIRT1 promotes the central adaptive response to diet restriction through activation of the dorsomedial and lateral nuclei of the hypothalamus. J Neurosci 2010;30:10220-10232. ArticlePubMedPMC
- 16. Papadimitriou A, Silva KC, Peixoto EB, Borges CM, Lopes de Faria JM, Lopes de Faria JB. Theobromine increases NAD+/Sirt-1 activity and protects the kidney under diabetic conditions. Am J Physiol Renal Physiol 2015;308:F209-F225. ArticlePubMed
- 17. Zhang C, Huang Z, Gu J, Yan X, Lu X, Zhou S, Wang S, Shao M, Zhang F, Cheng P, Feng W, Tan Y, Li X. Fibroblast growth factor 21 protects the heart from apoptosis in a diabetic mouse model via extracellular signal-regulated kinase 1/2-dependent signalling pathway. Diabetologia 2015;58:1937-1948. ArticlePubMedPDF
- 18. Jiang X, Chen J, Zhang C, Zhang Z, Tan Y, Feng W, Skibba M, Xin Y, Cai L. The protective effect of FGF21 on diabetes-induced male germ cell apoptosis is associated with up-regulated testicular AKT and AMPK/Sirt1/PGC-1α signaling. Endocrinology 2015;156:1156-1170. ArticlePubMedPMCPDF
- 19. Zhang J, Cheng Y, Gu J, Wang S, Zhou S, Wang Y, Tan Y, Feng W, Fu Y, Mellen N, Cheng R, Ma J, Zhang C, Li Z, Cai L. Fenofibrate increases cardiac autophagy via FGF21/SIRT1 and prevents fibrosis and inflammation in the hearts of type 1 diabetic mice. Clin Sci (Lond) 2016;130:625-641. ArticlePubMedPDF
- 20. Koye DN, Magliano DJ, Nelson RG, Pavkov ME. The global epidemiology of diabetes and kidney disease. Adv Chronic Kidney Dis 2018;25:121-132. ArticlePubMed
- 21. Zhang C, Shao M, Yang H, Chen L, Yu L, Cong W, Tian H, Zhang F, Cheng P, Jin L, Tan Y, Li X, Cai L, Lu X. Attenuation of hyperlipidemia- and diabetes-induced early-stage apoptosis and late-stage renal dysfunction via administration of fibroblast growth factor-21 is associated with suppression of renal inflammation. PLoS One 2013;8:e82275. ArticlePubMedPMC
- 22. Zheng S, Noonan WT, Metreveli NS, Coventry S, Kralik PM, Carlson EC, Epstein PN. Development of late-stage diabetic nephropathy in OVE26 diabetic mice. Diabetes 2004;53:3248-3257. ArticlePubMedPDF
- 23. Xu Z, Tong Q, Zhang Z, Wang S, Zheng Y, Liu Q, Qian LB, Chen SY, Sun J, Cai L. Inhibition of HDAC3 prevents diabetic cardiomyopathy in OVE26 mice via epigenetic regulation of DUSP5-ERK1/2 pathway. Clin Sci (Lond) 2017;131:1841-1857. ArticlePubMedPMCPDF
- 24. Xu J, Huang Y, Li F, Zheng S, Epstein PN. FVB mouse genotype confers susceptibility to OVE26 diabetic albuminuria. Am J Physiol Renal Physiol 2010;299:F487-F494. ArticlePubMedPMC
- 25. Cai L, Wang J, Li Y, Sun X, Wang L, Zhou Z, Kang YJ. Inhibition of superoxide generation and associated nitrosative damage is involved in metallothionein prevention of diabetic cardiomyopathy. Diabetes 2005;54:1829-1837. ArticlePubMedPDF
- 26. Cui W, Li B, Bai Y, Miao X, Chen Q, Sun W, Tan Y, Luo P, Zhang C, Zheng S, Epstein PN, Miao L, Cai L. Potential role for Nrf2 activation in the therapeutic effect of MG132 on diabetic nephropathy in OVE26 diabetic mice. Am J Physiol Endocrinol Metab 2013;304:E87-E99. ArticlePubMed
- 27. Nerstedt A, Johansson A, Andersson CX, Cansby E, Smith U, Mahlapuu M. AMP-activated protein kinase inhibits IL-6-stimulated inflammatory response in human liver cells by suppressing phosphorylation of signal transducer and activator of transcription 3 (STAT3). Diabetologia 2010;53:2406-2416. ArticlePubMedPDF
- 28. Li H, Lee J, He C, Zou MH, Xie Z. Suppression of the mTORC1/STAT3/Notch1 pathway by activated AMPK prevents hepatic insulin resistance induced by excess amino acids. Am J Physiol Endocrinol Metab 2014;306:E197-E209. ArticlePubMed
- 29. Chobanian AV, Bakris GL, Black HR, Cushman WC, Green LA, Izzo JL Jr, Jones DW, Materson BJ, Oparil S, Wright JT Jr, Roccella EJ. Joint National Committee on Prevention, Detection, Evaluation, and Treatment of High Blood Pressure, National Heart, Lung, and Blood Institute; National High Blood Pressure Education Program Coordinating Committee. Seventh report of the joint national committee on prevention, detection, evaluation, and treatment of high blood pressure. Hypertension 2003;42:1206-1252. ArticlePubMed
- 30. Coskun T, Bina HA, Schneider MA, Dunbar JD, Hu CC, Chen Y, Moller DE, Kharitonenkov A. Fibroblast growth factor 21 corrects obesity in mice. Endocrinology 2008;149:6018-6027. ArticlePubMedPDF
- 31. Mao S, Ren X, Zhang J. The emerging role of fibroblast growth factor 21 in diabetic nephropathy. J Recept Signal Transduct Res 2016;36:586-592. ArticlePubMed
- 32. Epstein PN, Overbeek PA, Means AR. Calmodulin-induced early-onset diabetes in transgenic mice. Cell 1989;58:1067-1073. ArticlePubMed
- 33. Yoon SJ, Kim SJ, Lee SM. Overexpression of HO-1 contributes to sepsis-induced immunosuppression by modulating the Th1/Th2 balance and regulatory T-cell function. J Infect Dis 2017;215:1608-1618. ArticlePubMedPDF
- 34. Scharn CR, Collins AC, Nair VR, Stamm CE, Marciano DK, Graviss EA, Shiloh MU. Heme oxygenase-1 regulates inflammation and mycobacterial survival in human macrophages during mycobacterium tuberculosis infection. J Immunol 2016;196:4641-4649. ArticlePubMedPDF
- 35. Suttner DM, Dennery PA. Reversal of HO-1 related cytoprotection with increased expression is due to reactive iron. FASEB J 1999;13:1800-1809. ArticlePubMedPDF
- 36. Luo X, Deng L, Lamsal LP, Xu W, Xiang C, Cheng L. AMP-activated protein kinase alleviates extracellular matrix accumulation in high glucose-induced renal fibroblasts through mTOR signaling pathway. Cell Physiol Biochem 2015;35:191-200. ArticlePubMedPDF
- 37. Chau MD, Gao J, Yang Q, Wu Z, Gromada J. Fibroblast growth factor 21 regulates energy metabolism by activating the AMPK-SIRT1-PGC-1alpha pathway. Proc Natl Acad Sci U S A 2010;107:12553-12558. PubMedPMC
- 38. Chuang PY, Dai Y, Liu R, He H, Kretzler M, Jim B, Cohen CD, He JC. Alteration of forkhead box O (foxo4) acetylation mediates apoptosis of podocytes in diabetes mellitus. PLoS One 2011;6:e23566. ArticlePubMedPMC
- 39. Chuang PY, Cai W, Li X, Fang L, Xu J, Yacoub R, He JC, Lee K. Reduction in podocyte SIRT1 accelerates kidney injury in aging mice. Am J Physiol Renal Physiol 2017;313:F621-F628. ArticlePubMedPMC
- 40. Yan J, Wang J, Huang H, Huang Y, Mi T, Zhang C, Zhang L. Fibroblast growth factor 21 delayed endothelial replicative senescence and protected cells from H(2)O(2)-induced premature senescence through SIRT1. Am J Transl Res 2017;9:4492-4501. PubMedPMC
- 41. Makela J, Tselykh TV, Maiorana F, Eriksson O, Do HT, Mudo G, Korhonen LT, Belluardo N, Lindholm D. Fibroblast growth factor-21 enhances mitochondrial functions and increases the activity of PGC-1α in human dopaminergic neurons via Sirtuin-1. Springerplus 2014;3:2. ArticlePubMedPMCPDF
- 42. Wu H, Liu Y, Chen X, Zhu D, Ma J, Yan Y, Si M, Li X, Sun C, Yang B, He Q, Chen K. Neohesperidin exerts lipid-regulating effects in vitro and in vivo via fibroblast growth factor 21 and AMP-activated protein kinase/sirtuin type 1/peroxisome proliferator-activated receptor gamma coactivator 1α signaling axis. Pharmacology 2017;100:115-126. ArticlePubMedPDF
- 43. Liu X, Wang Y, Hou L, Xiong Y, Zhao S. Fibroblast growth factor 21 (FGF21) promotes formation of aerobic myofibers via the FGF21-SIRT1-AMPK-PGC1α pathway. J Cell Physiol 2017;232:1893-1906. ArticlePubMedPDF
- 44. Chow WS, Xu A, Woo YC, Tso AW, Cheung SC, Fong CH, Tse HF, Chau MT, Cheung BM, Lam KS. Serum fibroblast growth factor-21 levels are associated with carotid atherosclerosis independent of established cardiovascular risk factors. Arterioscler Thromb Vasc Biol 2013;33:2454-2459. ArticlePubMed
- 45. Fisher FM, Chui PC, Antonellis PJ, Bina HA, Kharitonenkov A, Flier JS, Maratos-Flier E. Obesity is a fibroblast growth factor 21 (FGF21)-resistant state. Diabetes 2010;59:2781-2789. ArticlePubMedPMCPDF
REFERENCES
Impact of fibroblast growth factor 21 (FGF21) on diabetes-induced general changes and on renal function. Four-month-old female transgenic type 1 diabetes mellitus (DM) (FVB [Cg]-Tg [Cryaa-Tag, Ins2-CALM1] 26OVE/PneJ [OVE26]) mice and Friend Virus B NIH Jackson (FVB/NJ) control mice were given FGF21 (100 µg/kg) or an equal volume of phosphate-buffered saline (PBS) daily for 3 months (A). Weekly body weight before sacrifice (B), weekly blood glucose before sacrifice (C), urinary albumin (D), glomerular filtration rate (GFR) (E), survival rate (F), kidney weight to tibia length ratio (G), and plasma FGF21 (H) were examined. Data are presented as mean±standard deviation (Friend virus B NIH Jackson [FVB], n=9; diabetes mellitus [DM], n=10; FGF21-treated diabetic mice [FGF21], n=6). i.p., intraperitoneally; UA, urine albumin. aP≤0.05 for each DM vs. FVB/NJ groups, bP≤0.05 for DM/FGF21 vs. DM groups.
Impact of fibroblast growth factor 21 (FGF21) on diabetes-induced pathological changes. Kidney pathology was examined with hematoxylin & eosin staining (H&E) (A, B), periodic acid-Schiff (PAS) staining (C, D), and picrosirius red staining (PRS) (E, F) (×400). Renal expression of fibronectin (FN) (G, H), connective tissue growth factor (CTGF) (G, I), and α-smooth muscle actin (α-SMA) (G, J) were examined by Western blotting assay. Expression of Wilms' tumor 1 gene (WT1) was tested by immunohistochemical staining (K , L) (×400). Black arrows: Wilms tumor positive cells. For PRS, semi-quantitative analysis was conducted by computer imaging analysis. Data are presented as mean±standard deviation (Friend virus B NIH Jackson [FVB], n=9; diabetes mellitus [DM], n=10; FGF21-treated diabetic mice [FGF21], n=6). aP≤0.05 for each DM vs. FVB groups, bP≤0.05 for DM/FGF21 vs. DM groups.
Impact of fibroblast growth factor 21 (FGF21) on diabetes-induced renal inflammation. Renal expression of tumor necrosis factor α (TNF-α) (A, B), CD68 (A, C), and intercellular adhesion molecule-1 (ICAM) (A, D) was tested by Western blotting assay (A). Renal expression of CD68 and CD3 was examined by immunohistochemical staining (E–H) (×400). Data are presented as mean±standard deviation (Friend virus B NIH Jackson [FVB], n=9; diabetes mellitus [DM], n=10; FGF21-treated diabetic mice [FGF21], n=6). aP≤0.05 for each DM vs. FVB groups, bP≤0.05 for DM/FGF21 vs. DM groups.
Impact of fibroblast growth factor 21 (FGF21) on diabetes-induced renal apoptosis. Terminal deoxynucleotidyl transferase-mediated dUTP nick end labeling (TUNEL) staining (green), nuclei staining with 4′,6-diamidino-2-phenylindole (DAPI) (blue), and merge (A, B) (×400). Red arrows: apoptosis in tubule; purple arrows: apoptosis in glomeruli. BCL-2-associated X protein (BAX) and BCL-2 were examined by Western blotting assay (C, D). Data are presented as mean±standard deviation (Friend virus B NIH Jackson [FVB], n=9; diabetes mellitus [DM], n=10; FGF21-treated diabetic mice [FGF21], n=6). aP≤0.05 for each DM vs. FVB groups, bP≤0.05 for DM/FGF21 vs. DM groups.

Impact of fibroblast growth factor 21 (FGF21) on diabetes-induced renal oxidative stress. The lipid peroxide concentrations of plasma (A) and kidney (B) were measured by detecting thiobarbituric acid (TBA) reactivity reflected by the amount of malondialdehyde (MDA) formed during acid hydrolysis of the lipid peroxide compound. Renal expression of 3-nitrotyrosine (3-NT) (D), 4 hydroxynonenal (4-HNE) (E), heme oxygenase-1 (HO-1) (F), NAD(P)H dehydrogenase [quinone]-1 (NQO-1) (G), catalse (CAT) (H) and superoxide dismutase 2 (SOD2) (I) were tested by Western blotting assay (C). Data are presented as mean±standard deviation (Friend virus B NIH Jackson [FVB], n=9; diabetes mellitus [DM], n=10; FGF21-treated diabetic mice [FGF21], n=6). OVE, FVB (Cg)-Tg (Cryaa-Tag, Ins2-CALM1) 26OVE/PneJ (OVE26). aP≤0.05 for each DM vs. FVB groups, bP≤0.05 for DM/FGF21 vs. DM groups.

Fibroblast growth factor 21 (FGF21) protects diabetic nephropathy through the AMP-activated protein kinase (AMPK)-sirtuin 1 (SIRT1) pathway. Renal expression of ERK1/2 (B), AMPK (C), P38 (D), SIRT1 (F) and signal transducer and activator of transcription 3 (STAT3) (G) was examined by Western blotting assay (A), and renal SIRT1 mRNA expression was examined by reverse transcription polymerase chain reaction (E). Data are presented as mean±standard deviation (Friend virus B NIH Jackson [FVB], n=9; diabetes mellitus [DM], n=10; FGF21-treated diabetic mice [FGF21], n=6). p-, phosphor; T-, total. aP≤0.05 for each DM vs. FVB groups, bP≤0.05 for DM/FGF21 vs. DM groups.
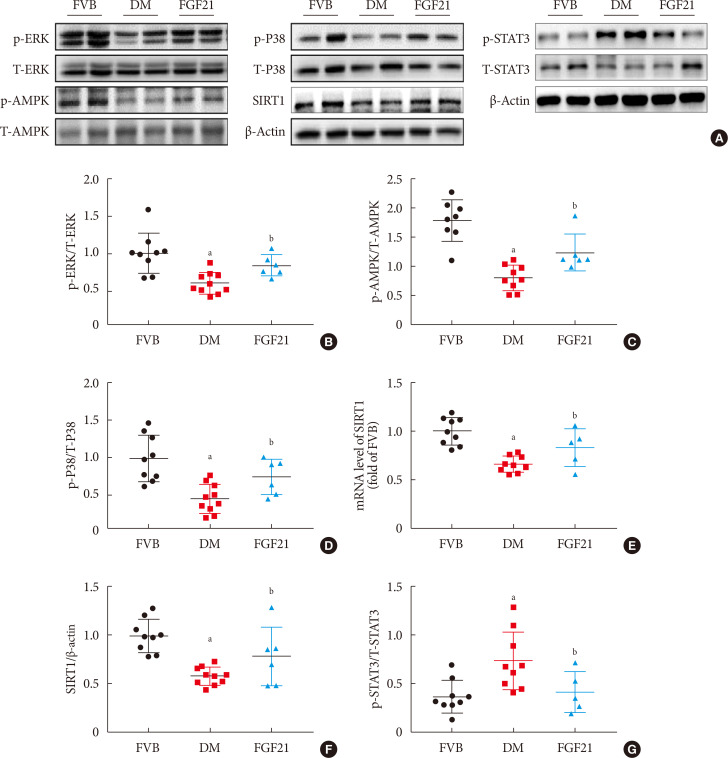
Figure & Data
References
Citations
- Fibroblast growth factor 21 alleviates unilateral ureteral obstruction-induced renal fibrosis by inhibiting Wnt/β-catenin signaling pathway
Wenhui Zhong, Yuheng Jiang, Huizhen Wang, Xiang Luo, Tao Zeng, Huimi Huang, Ling Xiao, Nan Jia, Aiqing Li
Biochimica et Biophysica Acta (BBA) - Molecular Cell Research.2024; 1871(2): 119620. CrossRef - Urinary Excretion of Biomolecules Related to Cell Cycle, Proliferation, and Autophagy in Subjects with Type 2 Diabetes and Chronic Kidney Disease
Anton I. Korbut, Vyacheslav V. Romanov, Vadim V. Klimontov
Biomedicines.2024; 12(3): 487. CrossRef - New developments in the biology of fibroblast growth factors
David M. Ornitz, Nobuyuki Itoh
WIREs Mechanisms of Disease.2022;[Epub] CrossRef - SIRT1–SIRT7 in Diabetic Kidney Disease: Biological Functions and Molecular Mechanisms
Wenxiu Qi, Cheng Hu, Daqing Zhao, Xiangyan Li
Frontiers in Endocrinology.2022;[Epub] CrossRef - Research Progress of Fibroblast Growth Factor 21 in Fibrotic Diseases
Min-Qi Jia, Cha-Xiang Guan, Jia-Hao Tao, Yong Zhou, Liang-Jun Yan
Oxidative Medicine and Cellular Longevity.2022; 2022: 1. CrossRef - Metabolic-associated fatty liver disease increases the risk of end-stage renal disease in patients with biopsy-confirmed diabetic nephropathy: a propensity-matched cohort study
Yutong Zou, Lijun Zhao, Junlin Zhang, Yiting Wang, Yucheng Wu, Honghong Ren, Tingli Wang, Yuancheng Zhao, Huan Xu, Lin Li, Nanwei Tong, Fang Liu
Acta Diabetologica.2022; 60(2): 225. CrossRef - FGF21 and Chronic Kidney Disease
João Victor Salgado, Miguel Angelo Goes, Natalino Salgado Filho
Metabolism.2021; 118: 154738. CrossRef - The Multiple Roles of Fibroblast Growth Factor in Diabetic Nephropathy
Junyu Deng, Ye Liu, Yiqiu Liu, Wei Li, Xuqiang Nie
Journal of Inflammation Research.2021; Volume 14: 5273. CrossRef - Therapeutic effect and mechanism of combined use of FGF21 and insulin on diabetic nephropathy
Fanrui Meng, Yukai Cao, Mir Hassan Khoso, Kai Kang, Guiping Ren, Wei Xiao, Deshan Li
Archives of Biochemistry and Biophysics.2021; 713: 109063. CrossRef - FGF19 and FGF21 for the Treatment of NASH—Two Sides of the Same Coin? Differential and Overlapping Effects of FGF19 and FGF21 From Mice to Human
Emma Henriksson, Birgitte Andersen
Frontiers in Endocrinology.2020;[Epub] CrossRef - FGF21: An Emerging Therapeutic Target for Non-Alcoholic Steatohepatitis and Related Metabolic Diseases
Erik J. Tillman, Tim Rolph
Frontiers in Endocrinology.2020;[Epub] CrossRef
 PubReader
 ePub Link
 Cite
Cite