The Effect of Glucose Fluctuation on Apoptosis and Function of INS-1 Pancreatic Beta Cells
Article information
Abstract
Background
Blood glucose level continuously fluctuates within a certain range in the human body. In diabetes patients, the extent of such fluctuation is large, despite the strict control of blood glucose. Blood glucose fluctuation has been shown to mediate more adverse effects on vascular endothelial cells and diabetes complications than chronic hyperglycemia, which has been explained as due to oxidative stress. As few previous studies have reported the effects of chronic and intermittent hyperglycemia on the apoptosis and function of pancreatic beta cells, this study reported herein was performed to investigate such effects on these cells.
Methods
For chronic hyperglycemia, INS-1 cells were cultured for 5 days with changes of RPMI 1640 medium containing 33 mM glucose every 12 hours. For intermittent hyperglycemia, the medium containing 11 mM glucose was exchanged with the medium containing 33 mM glucose every 12 hours. Apoptosis was assessed by TUNEL assay Hoechst staining and cleaved caspase 3. Insulin secretory capacity was assessed, and the expression of Mn-SOD and Bcl-2 was measured by Western blotting.
Results
In comparison to the control group, INS-1 cells exposed to chronic hyperglycemia and intermittent hyperglycemia showed an increase in apoptosis. The apoptosis of INS-1 cells exposed to intermittent hyperglycemia increased significantly more than the apoptosis of INS-1 cells exposed to chronic hyperglycemia. In comparison to the control group, the insulin secretory capacity in the two hyperglycemic states was decreased, and more with intermittent hyperglycemia than with chronic hyperglycemia. The expression of Mn-SOD and Bcl-2 increased more with chronic hyperglycemia than with intermittent hyperglycemia.
Conclusion
Intermittent hyperglycemia induced a higher degree of apoptosis and decreased the insulin secretory capacity more in pancreatic beta cells than chronic hyperglycemia. This activity may be mediated by the anti-oxidative enzyme Mn-SOD and the anti-apoptotic signal Bcl-2.
INTRODUCTION
Hyperglycemia is closely related to the development of macro- and microvascular complications of diabetes, and can be prevented by the strict control of blood glucose, as has been proven from large-scale studies, such as the Diabetes Control and Complication Trial (DCCT) or the United Kingdom Prospective Diabetes Study (UKPDS). In such epidemiological studies, hemoglobin A1C (HbA1c) has been used as the standard of glucose control, because it is considered to be relatively objective and standardized [1,2]. However, in several studies, it has been reported that diabetes complications increased more in proportion to post-meal glucose or the peak glucose levels, rather than the average blood glucose, and these facts were more evident in cardiovascular diseases that account for the largest proportion of mortality in diabetes patients [3-7]. Therefore, there is a new emphasis on efforts to control all three aspects of blood glucose (HbA1c, fasting blood glucose, and post-meal blood glucose), as well as to reduce glucose excursion.
Even in normal individuals, blood glucose levels fluctuate continuously within a certain range. The extent of fluctuation is larger in diabetes patients, and there is a large gap between the pre-meal and post-meal blood glucose levels. The DCCT study group reported that the development of microvascular complications differed markedly according to the level of HbA1c, as well as the extent of blood glucose excursion [8], and similar results were reported in prospective studies published thereafter [9,10]. In in vitro studies, it has been shown that intermittent hyperglycemia has a more adverse effect on the survival and physiological markers of vascular endothelial cells, as compared with chronic hyperglycemia [11,12]. In another study, it was reported that the amount of reactive oxygen species (ROS) is higher in the intermittent hyperglycemic condition, as compared with that in the chronic hyperglycemic condition [13,14]. In a study performed in diabetes patients, free radial production was not associated with HbA1c levels or average blood glucose, but rather, with glucose fluctuation assessed by the mean amplitude of glycemic excursion (MAGE) [13].
Hyperglycemia induces the apoptosis of pancreatic beta cells [15], and a recent study reported that the beta cell function in the post-meal condition is closely related to markers reflecting the extent of blood glucose fluctuation [16]. Therefore, this experiment was performed to examine the effect of blood glucose fluctuation on pancreatic beta cell function under the conditions of chronic and intermittent hyperglycemia.
METHODS
Cell culture
INS-1 cells (Rat insulinoma cell line, passages 30-40) were cultured in RPMI 1640 medium containing 11 mM glucose, 10 mM HEPES, pH 7.4, 50 µM 2-mercaptoethanol, and 10% fetal calf serum, at 37℃, under 95% air and 5% CO2.
Hyperglycemic stress environment
For chronic hyperglycemic status, RPMI 1640 medium containing 33 mM glucose was changed every 12 hours for 5 days of culture. For the intermittent hyperglycemic condition, the media containing either 11 mM glucose or 33 mM glucose was changed alternatively every 12 hours.
Western blotting
After 5 days of hyperglycemic stress, INS-1 cells were washed once with PBS, and protein was extracted using lysis buffer (Sigma, St. Louis, MO, USA) containing protease inhibitor (Roche, Indianapolis, IN, USA). The supernatant was obtained by centrifugation at 4℃, 12,000 rpm, for 10 minutes. Protein was quantitated by the BCA kit (Pierce, Rockford, IL, USA) and Western blotting was performed with a 10% or 12% poly-SDS page gel and 30 µg of protein per well. Equal protein loading was confirmed by measuring actin expression. The gel was transferred to the PVDF membrane, blocked with 5% Skim milk/0.1% TTBS (Tris-base 2.42 g, NaCl 8 g, Tween 20 1 mL), and reacted with the primary antibodies (1 : 1000) for Mn-SOD (Upstate, Billerica, MA, USA), Bcl-2, caspase 3, cleaved caspase 3, and beta-actin (Cell Signaling, Beverly, MA, USA) at 4℃ overnight. The secondary antibodies, rabbit and mouse polyclonal antibodies (Alkaline-phsophatase conjugated, 1 : 3000) (Bio-Rad, Hercules, CA, USA), were reacted at room temperature for 1 hour stained using the a AP-conjugated substrate kit (Bio-Rad).
Terminal deoxynucleotidyl transferase dUTP nick end labeling (TUNEL)
After culturing on coverslides, INS-1 cells were incubated under hyperglycemic condition for 5 days and washed with PBS. Then, we added 100 µL fixation/permeabilization solution (BD Bioscience, San Jose, CA, USA) to the slides, incubated them at room temperature for 20 minutes, and then washed them with PBS. Subsequently, 50 µL TUNEL mixture (Roche) was added, with the light blocked, and reacted at 37℃ for 1 hour. The cells were then analyzed by fluorescent in situ hybridization (FISH).
Hoechst 33347 staining
After culturing on coverslides, INS-1 cells were incubated under a hyperglycemic condition for 5 days and washed with PBS. We then added 100 µL fixation/ permeabilization solution to the slides, incubated the slides at room temperature for 20 minutes, and then washed them with PBS. Subsequently, 100 µL Hoechst 33342 (Sigma) (1 µg/mL) was added, with the light blocked, and reacted at 3℃ for 30 minutes. The cells were then analyzed by FISH.
Measurement of insulin secretory capacity
To examine the level of insulin secretion in response to hyperglycemia, the supernatant was removed, and the cells were starved in medium containing 5 mM glucose and 2% fetal calf serum for 5 hours and then incubated with the Krebs-Ringer buffer (119 mM NaCl, 4.75 mM KCl, 2.54 mM CaCl2, 1.2 mM MgSO4, 1.2 mM KH2PO4, 5 mM NaHCO3, 20 mM HEPES, pH 7.4) containing either 5 mM or 25 mM glucose for 1 hour. The culture medium was added to the Rat/Mouse Insulin ELISA kit (LINCO Research, St. Louis, MO, USA). The color change was observed, and the optical density at 450 nm was measured.
Statistical analysis
Experimental results were statistically analyzed using the SPSS version 15.0 (SPSS Inc., Chicago, IL, USA). All values are presented as the mean ± standard deviation, and analyzed with the Student's t-test and ANOVA test. A P < 0.05 was considered to be statistically significant.
RESULTS
The effect of chronic and intermittent hyperglycemia on the apoptosis of INS-1 cells
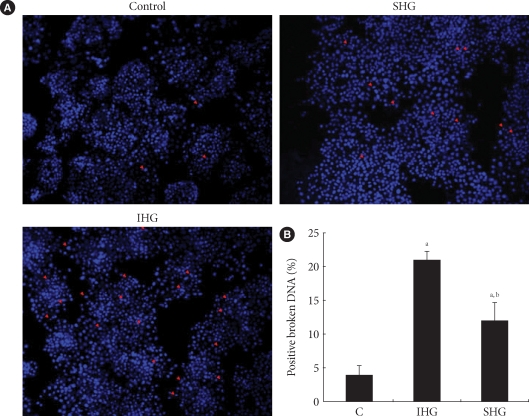
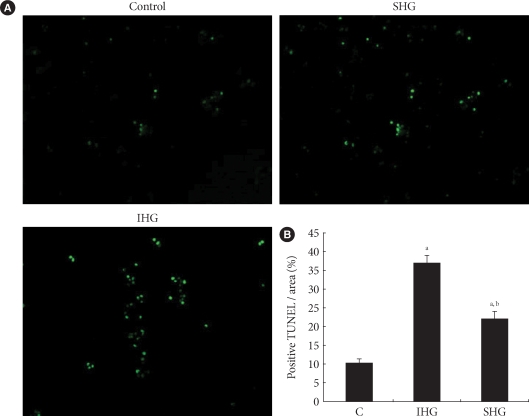
In both chronic and intermittent glycemic conditions, the amount of the cleaved caspase 3 increased by approximately 30% and 47%, respectively, as compared with the control group. In the intermettent hyperglycemic condition, the expression of caspase 3 was lower, and the amount of the cleaved caspase 3 was higher, as compared with the chronic hyperglycemic condition (Fig. 1). Upon Hoechst staining, more DNA fragmentation was observed in both hyperglycemic conditions, as compared with the control group, and positive staining was significantly higher with intermittent hyperglycemia than with chronic hyperglycemia (Fig. 2). In the TUNEL assay, the percentage of positively stained cells was 10% in the control group, 40% in the intermittent hyperglycemic group, and 20% in the chronic hyperglycemic group. Apoptosis was significantly higher with intermittent hyperglycemia than with chromic hyperglycemia (Fig. 3).

Expression of caspase 3 and cleaved caspase 3 in INS-1 cell. (A) Caspase 3 and cleaved caspase 3 were measured by Western blot analysis. (B, C) Densitometric analyses of Western blot are reported as means ± SD of the three different experiments. C, control; IHG, intermittent high glucose; SHG, sustained high glucose. aP < 0.05 vs. control, bP < 0.05 vs. IHG.

Hoechst 33347 staining. (A) After INS-1 cell were incubated under control, IHG and SHG, they were stained with Hoechst 33347 to detect apoptosis morphologically. The red arrows represent cells with DNA condensation. (B) The numbers of cells with broken DNA per 300 cells in three different fields in each condition of one experiment were counted and repeated in three different experiments. The mean percentages of positive staining under control, IHG and SHG were presented by histogram. C, control; IHG, intermittent high glucose; SHG, sustained high glucose. aP < 0.05 vs. control, bP < 0.05 vs. IHG.

Terminal deoxynucleotidyl transferase dUTP nick end labeling (TUNEL). (A) TUNEL stainings under control, IHG and SHG were analyzed by fluorescent in situ hybridization (FISH). (B) The percentage of TUNEL positive apoptotic cells / area was presented in histogram. C, control; IHG, intermittent high glucose; SHG, sustained high glucose. aP < 0.05 vs. control, bP < 0.05 vs. IHG.
Insulin secretory capacity in chronic and intermittent hyperglycemic condition
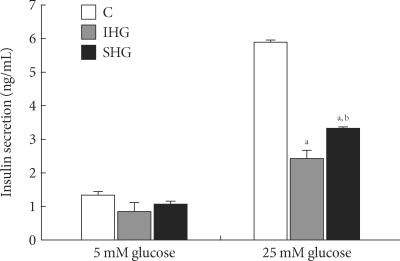
At the 5-mM glucose level, the amount of insulin secretion was not significantly different between the control and hyperglycemia groups. However, when stimulated with 25 mM glucose, the amount of insulin secretion was decreased by 60% and 43% in both the chronic and intermittent hyperglycemia groups, respectively, and was significantly lower in the intermittent hyperglycemia group, as compared with the chronic hyperglycemia group (Fig. 4).

Insulin secretion from INS-1 cells in response to glucose (5 and 25 mM) after incubated for 5 days in control, IHG and SHG. Data are means ± SD of three separate experiments. C, control; IHG, intermittent high glucose; SHG, sustained high glucose. aP < 0.05 vs. control of 25 mM glucose, bP < 0.05 vs. IHG of 25 mM glucose.
Difference in the expression of Mn-SOD and bcl-2
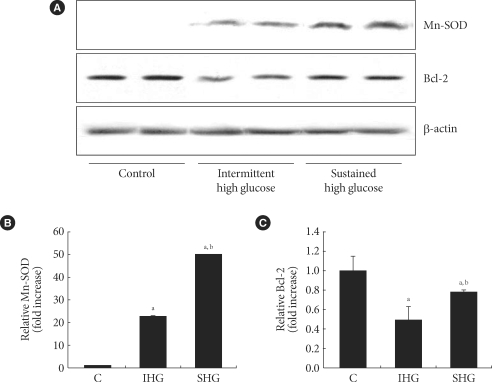
The expression of Mn-SOD, an anti-oxidative enzyme, was higher under chronic hyperglycemic conditions and under intermittent hyperglycemic conditions by 64% and 29%, respectively, as compared with the control group, in which no oxidative stress was present. The expression of MnSOD was significantly higher in the intermittent hyperglycemic group than in the chronic hyperglycemic group. In comparison with the control group, both the chronic and intermittent hyperglycemic groups showed a decrease in the expression of Bcl-2, an antiapototic signal. The level of Bcl-2 expression was significantly higher in the chronic hyperglycemic group than in the intermittent hyperglycemic group (Fig. 5).

The changes of the expression of MnSOD and Bcl-2 in response to control, IHG and SHG. (A) Expression of Mn-SOD and Bcl-2 were evaluated by Western blot analysis. A representative experiment of three is shown. (B, C) Densitometric analyses of western blot are reported as means ± SD of the three different experiments. C, control; IHG, intermittent high glucose; SHG, sustained high glucose. aP < 0.05 vs. control, bP < 0.05 vs. IHG.
DISCUSSION
The effect of blood glucose fluctuation on diabetes complications or beta cell function has not been established. Although the influence of glucose control, as assessed primarily by HbA1c levels, on the development of diabetes complications has been proven in numerous large-scale epidemiological studies, there are few well-designed studies that demonstrate a direct effect of post-meal hyperglycemia or blood glucose fluctuations on diabetes complications. However, similar results have been observed in retrospective analyses from the DCCT study, which reported that HbA1c, as well as blood glucose fluctuation, seem to be associated with the microvascular complications of diabetes [8]. In a study performed on vascular endothelial cells associated with diabetes cardiovascular complications, it was reported that vascular endothelial cell function deteriorated more with oscillating glucose concentrations [12]. Nonetheless, few studies have reported on the effect of blood glucose fluctuations on beta cell function or survival, which is important in the pathophysiology of diabetes.
One of the reasons for the deleterious effects of glucose fluctuations on vascular complications is the relatively increased oxidative stress associated with hyperglycemic status, as compared with normoglycemic status. In a study performed in non-obese non-diabetic subjects, when blood glucose fluctuations were induced by a hyperglycemic clamp, the activity of prostacyclin synthase, an endothelial cell enzyme known to suppress atherosclerosis, was noticeably decreased, suggesting an adverse effect from the free radicals generated in response to blood glucose fluctuations on vascular endothelial cells [8]. It is well known that hyperglycemia increases oxidative stress in diabetes patients, and, compared with non-diabetic individuals, free radical production has been reported to be nearly 2-fold higher in diabetes patients [17]. In another study performed in diabetes patients, it was reported that the concentration of 8-iso PGF2α was 4-fold higher in the group with the largest blood glucose fluctuations, as compared with the group with the lowest blood glucose fluctuations [13]. In a study measuring the level of oxidative stress in diabetes patients, although the level of oxidative stress showed no significant association with the average 24-hour urine glucose, fasting glucose level or HbA1c level, was significantly correlated with the markers of glucose fluctuation, suggesting that oxidative stress increases more when the extent of glucose fluctuation is substantial [13].
Few studies have reported on the effect of oxidative stress within beta cells in the intermittent hyperglycemic state, on subsequent beta cell apoptosis and alteration of other intracellular signaling. In a study in which islet and INS-1 cells were exposed to 11 mM and 25 mM glucose alternately for 72 hours, the concentration of 8-OhdG increased substantially more with intermittent hyperglycemia than with chronic hyperglycemia [14]. Similar to results from our study, both the islet and INS-1 cells showed a greater reduction in expression of insulin mRNA, insulin content, and GSIS with intermittent hyperglycemia than with chronic hyperglycemia. Although the fact that hyperglycemia induces an increase in the apoptosis of islet cells has been confirmed [15], there have been few studies comparing the effects of intermittent and chronic hyperglycemia on beta cell apoptosis. In a previous study, when cell viability was examined by MTT assay, more decreased cell viability was shown with intermittent hyperglycemic than with chronic hyperglycemia, although the difference was not statistically significant [14]. The strength of our study is that we used three different assays (TUNEL, Hoechst, and cleaved caspase 3) to confirm the increase in apoptosis in INS-1 cells under intermittent hyperglycemic conditions, as compared to chronic hyperglycemic conditions.
It is difficult to adequately explain why intermittent hyperglycemia is more deleterious to the cell with more increased oxidative stress than that with chronic hyperglycemic status. One possible explanation is that, when cells are continuously exposed to hyperglycemia, certain compensation or feedback reactions are induced to compensate for the stimulation. However, in the intermittent hyperglycemic state, it is speculated that such an adaptative reaction is reduced or does not function very well [11]. As one of such compensatory reactions, levels of ER stress markers in chronic hyperglycemia were reported to be lower than those in intermittent hyperglycemia [14]. The expression of anti-oxidative enzymes in pancreatic beta cells is known to be lower than in other cells in our body; hence, pancreatic beta cells are more vulnerable to oxidative stress [18]. In a recent study, it is reported that the Bcl-2 family is required for apoptosis in pancreatic beta cells, and mutations in this anti-apoptosis signal cause increased sensitivity to various stimulations, allowing apoptosis to readily occur in response to a weak stimulation [19]. In addition, regulation of the expression of the Bcl-2 family can reverse cell injury caused by oxidative stress [20]. In our study, the expression of the anti-oxidant enzyme Mn-SOD and the expression of the anti-apoptosis signal Bcl-2 increased more with chronic hyperglycemia than with intermittent hyperglycemia. These results could be a partial explanation for decrease in beta cell apoptosis with chronic hyperglycemia, as compared with intermittent hyperglycemia.
There are some limitations to our study. First, we did not directly measure the concentration of ROS or oxidants, nor did we compare their levels under chronic and intermittent hyperglycemic status. However, such results have been reported in previous studies, and our study was conducted based on those study results. Secondly, our study results were not performed in vivo or in primary islet culture experiments. Therefore, to apply our study results in clinical practice, more extensive studies are necessary.
In conclusion, we observed that, even under identical degrees of hyperglycemia, the apoptosis of INS-1 cells is higher, and GSIS is lower, with intermittent hyperglycemic conditions, as compared with chronic hyperglycemic conditions. Higher expression of Mn-SOD and Bcl-2 in chronic hyperglycemia, as compared with intermittent hyperglycemia, could be a partial explanation for the mechanism underlying our observations.