Long Non-Coding RNA TUG1 Attenuates Insulin Resistance in Mice with Gestational Diabetes Mellitus via Regulation of the MicroRNA-328-3p/SREBP-2/ERK Axis
Article information

Abstract
Background
Long non-coding RNAs (lncRNAs) have been illustrated to contribute to the development of gestational diabetes mellitus (GDM). In the present study, we aimed to elucidate how lncRNA taurine upregulated gene 1 (TUG1) influences insulin resistance (IR) in a high-fat diet (HFD)-induced mouse model of GDM.
Methods
We initially developed a mouse model of HFD-induced GDM, from which islet tissues were collected for RNA and protein extraction. Interactions among lncRNA TUG1/microRNA (miR)-328-3p/sterol regulatory element binding protein 2 (SREBP-2) were assessed by dual-luciferase reporter assay. Fasting blood glucose (FBG), fasting insulin (FINS), homeostasis model assessment of insulin resistance (HOMA-IR), HOMA pancreatic β-cell function (HOMA-β), insulin sensitivity index for oral glucose tolerance tests (ISOGTT) and insulinogenic index (IGI) levels in mouse serum were measured through conducting gain- and loss-of-function experiments.
Results
Abundant expression of miR-328 and deficient expression of lncRNA TUG1 and SREBP-2 were characterized in the islet tissues of mice with HFD-induced GDM. LncRNA TUG1 competitively bound to miR-328-3p, which specifically targeted SREBP-2. Either depletion of miR-328-3p or restoration of lncRNA TUG1 and SREBP-2 reduced the FBG, FINS, HOMA-β, and HOMA-IR levels while increasing ISOGTT and IGI levels, promoting the expression of the extracellular signal-regulated kinase (ERK) signaling pathway-related genes, and inhibiting apoptosis of islet cells in GDM mice. Upregulation miR-328-3p reversed the alleviative effects of SREBP-2 and lncRNA TUG1 on IR.
Conclusion
Our study provides evidence that the lncRNA TUG1 may prevent IR following GDM through competitively binding to miR-328-3p and promoting the SREBP-2-mediated ERK signaling pathway inactivation.
INTRODUCTION
Gestational diabetes mellitus (GDM), a subtype of diabetes that usually emerges during pregnancy, is typically characterized by increased insulin resistance (IR) along with impaired glucose tolerance [1]. Although fewer than 10% of pregnant women experience GDM, usually accompanied with mild symptoms, it can still influence the pregnancy and brings a risk for high birth weight [2,3]. Dietary modification and pharmacological therapies, including metformin and insulin, can relieve some adverse outcomes of GDM [4] in the 30% to 40% of women requiring pharmacotherapy [5]. GDM is caused by a progressive dysfunction whereby the mother’s islet β-cells fail to meet the increased insulin demand of gestation due to increased IR [6,7]. IR is defined as a decline of the effectiveness of insulin and subsequent reduction of insulin’s stimulation of several metabolic pathways (glucose transport, glycogen synthesis, and anti-lipolysis), all of which are frequently linked to type 2 diabetes mellitus (T2DM) and a risk for abnormal blood coagulation [8]. Although certain genetic and environmental factors that contribute to the complex etiology of GDM have been thoroughly investigated in several mechanistic and epidemiological studies, the specific mechanism leading to abnormal insulin secretion and IR in GDM still remains unclear [9]. It is, therefore, imperative to elucidate the molecular mechanisms pertaining to GDM development and to identify more promising markers or targets for advancing the prevention, diagnosis and treatment of GDM.
Long non-coding RNAs (lncRNAs), a type of noncoding RNA consisting of more than 200 nucleotides, hold strong promise as biomarkers and therapeutic targets for various human diseases, given their genome-wide expression in various tissues and their tissue specific expression characteristics [10]. LncRNA taurine upregulated gene 1 (TUG1) demonstrates the ability to enhance high glucose-impaired endothelial progenitor cell function via regulation of the miR-29c-3p/platelet-derived growth factor-BB (PDGF-BB)/Wnt signaling during diabetes [11]. In addition, the functions of lncRNA TUG1 in pulmonary arterial hypertension are associated with miR-328 [12]. Recent work has demonstrated the involvement of miRNAs (also known as miRs) in the pathogenesis and development of GDM [13] through their roles in pancreatic β-cell survival and immune system homeostasis mediated by the regulation of transcription and translation [14]. miR-328 has been substantiated to regulate erectile dysfunction (ED) in rats with streptozotocin (STZ)-induced diabetes [15]. Moreover, miR328-3p has been identified to serve as an endogenous reference gene for the normalization of miRNA expression data from patients with diabetic retinopathy [16]. The starBase database predicted the presence of putative miR-328-3p binding sites in the 3’-untranslated region (3’-UTR) of sterol regulatory element binding protein 2 (SREBP-2). SREBP-2, belonging to the family of SREBPs, plays a vital role in modulating cellular metabolism such as fatty acid synthesis and cholesterol homeostasis [17]. Furthermore, SREBP-2 acts as a potential candidate for mediating the health of progeny of diabetic mothers, and its decreased expression correlates with maternal preexisting GDM [18]. The mature form of SREBP-2 has been reported to be a substrate of extracellular signal-regulated kinase (ERK); the ERK signaling pathway activation induced by hormones such as insulin may correspond to a novel regulatory principle of SREBP-2 [19]. An increased phosphorylation level of ERK 1/2 has been found in the placenta of women with GDM [20], and conversely, the prevention of ERK activation can improve insulin sensitivity and reduce the degree of inflammation induced by sterile or bacterial inflammation occurring in association with GDM [21]. Given this background, the current study set out to investigate the effect of lncRNA TUG1 on the development of GDM and subsequently to elucidate the mechanisms associated with miR-328-3p, SREBP-2, and the ERK signaling pathway in GDM, with the overall objective of identifying novel GDM targets or biomarkers.
METHODS
Ethics statement
This study was approved by the Institutional Animal Care and Use Committee of Guangzhou Medical University (Approval No. 2019-446), and was carried out in strict compliance with the recommendations in the Guide for the Care and Use of Laboratory Animals published by the U.S. National Institutes of Health. Great efforts were made to minimize the number of animals applied in the experimentation and to maximally attenuate their discomfort.
Microarray-based gene expression profiling
The GDM-related gene expression datasets GSE98043 (human miRNAs, containing two GDM patient plasma samples and two healthy pregnant woman plasma samples) and GSE41095 (mouse genes, containing three GDM embryo samples and three healthy embryo samples) were retrieved from the Gene Expression Omnibus (GEO) database. Differential analysis was then carried out using R language “limma” package, and a heat map was drawn using the “pheatmap” package. Kyoto Encyclopedia of Genes and Genomes (KEGG) enrichment analysis was conducted on the highly expressed and conserved miRNA target genes using the mirPATH tool in the DNA Intelligent Analysis (DIANA) database (https://dianalab.e-ce. uth.gr/html/mirpathv3/index.php?r=mirpath) in order to determine the main functions of the differential miRNAs. The upstream lncRNAs of miR-328-3p in human and mice were predicted employing the starBase database, and the predicted binding between miRNAs and lncRNAs in human and mice was obtained. The subcellular location of lncRNAs was predicted using the lncLocator website (http://www.csbio.sjtu.edu.cn/bioinf/lncLocator/). Target genes of differentially expressed miRNAs obtained from the GSE98043 dataset were predicted with the utility of the TargetScan, miRDB, starBase, DIANA, and RNA22 databases. Next, the predicted targets were intersected with the differentially expressed genes (DEGs) from the GSE41095 dataset, and then visualized using UpSetR package (https://CRAN.R-project.org/package=UpSetR) to screen the DEGs targeted by candidate miRNAs in multiple databases (≥3). In the DisGeNET database, the GDM-related known disease genes were searched, and their interactions with the obtained GDM-related DEGs were analyzed using the String database, followed by KEGG enrichment analysis. An interaction network was constructed by the Cytoscape 3.6.0 software (https://cytoscape.org/).
Establishment of GDM mouse models
A total of 120 female and 60 male C57BL/6J mice (aged 8 weeks old, purchased from Shanghai SLAC Laboratory Animal Co. Ltd., Shanghai, China) were used in this study. All mice were initially fed with a normal diet, and acclimated in the specific pathogen-free conditions with the temperature of 25°C±1°C and relative humidity of 40% to 70% under a 12-hour day/night cycle. The mice had free access to food and water. The female mice were assigned at randomization into two groups: control (n=20) and GDM (n=100). The female mice in the GDM group were fed with high-fat diet (HFD) (45% fat, 20% protein, and 35% carbohydrate) for 1 week, and the remaining female mice were fed with low-fat diet (15.8% fat, 20.3% protein, and 63.9% carbohydrate) for 1 week as control. Next, the female in the GDM and control groups and male mice were mated in the same cages at a gender ratio of 2:1. If the vaginal plug appeared the next morning, the mice were deemed to be pregnant for 0.5 days. The mice in the GDM group continued to be fed with HFD until embryonic day 18 [22,23]. For the GDM mice, on the 7.5-day of pregnancy, the blood glucose level in mouse tail vein blood was measured with the assistance of an Accu-Chek Performa glucose meter (Roche Diagnostics GmbH, Mannheim, Germany). If the glucose level exceeded 16.7 mM (300 mg/dL) for consecutive 3 days, GDM was regarded to be successfully induced.
The mice were injected with corresponding nanoparticles (NPs), and further fed with HFD until 18 days of gestation. On this day, the mice were euthanized and islet tissues were then removed for subsequent examinations. The schematic diagram concerning the timeline of the experiments is shown in Supplementary Fig. 1. Specifically, the selected successfully modeled GDM mice received tail vein injections of NPs expressing negative control (NC) inhibitor, miR-328-3p inhibitor, NC mimic+overexpression (oe)-NC, NC mimic+oe-SREBP-2, miR-328-3p mimic+oe-NC, miR-328-3p mimic+oe-SREBP-2, vector, and lncRNA TUG1 (n=9 for mice following each treatment). The miR-328-3p mimic, miR-328-3p inhibitor, oeSREBP-2, and NC plasmids were procured from GenePharma (Shanghai, China). The LV4 vector employed for overexpression were provided by GenePharma. Anti-miRNA oligos, control vector and constructed overexpression vector were prepared into NPs by NP encapsulation technology for in vivo injection. The interference sequence was designed by GenePharma. The injection volume of NPs was 200 µL/mouse (containing 2 µL of oligonucleotides [AMO], 50 µmol/L). Each mouse was given at 100 µL/mouse by tail vein (GenePharma) [22,23].
Oral glucose tolerance test
Oral glucose tolerance test (OGTT) was performed post 12-hour fasting. The pregnant mice received intragastric administration of 2 g/kg glucose. The blood glucose meter and test strips were utilized to measure blood glucose levels at 0, 30, 60, and 120 minutes following glucose load and the OGTT curve was drawn. The blood glucose area under the curve (GAUC) was quantified conforming to the formula: GAUC=1/4×blood glucose level at 0 min+1/2×blood glucose level at 30 min+4/3×blood glucose level at 60 min+blood glucose level at 120 minutes.
Fasting blood glucose measurement
The blood samples were extracted from mice at days 0, 10, and 18 of gestation and from non-pregnant control mice on the same days. After 12-hour fasting, mice were anaesthetized with 3% pentobarbital sodium (P3761, Sigma, St. Louis, MO, USA), and eyeball blood was obtained and allowed to maintain at ambient temperature for 2 hours. The serum separated through centrifugation was collected into the 1 mL Eppendorf (EP) tube, and preserved at –80°C. The glucose oxidase (GOD) test was employed for the fasting blood glucose (FBG) measurement using a GOD kit provided by BioSino Bio-Technology & Science Inc. (Beijing, China) with the assistance of an automatic biochemical analyzer (7171A) from Hitachi (Tokyo, Japan).
Fasting insulin measurement
At day 18 of gestation, maternal fasting insulin (FINS) was measured using double antibody sandwich light initiated chemiluminescence assay with the kit provided by Siemens Medical Solutions Diagnostics (Erlangen, Germany). This assay applied monoclonal mouse anti-insulin antibody labeled with the luminescent substrate acridinium ester, and mouse anti-insulin antibody covalently coupled to paramagnetic particles. The relative light units correlated with the insulin concentration in serum. According to the standard curve, the level of serum insulin was calculated within the range of 0.5 to 300 (mU/L).
Homeostasis model assessment of insulin resistance
At gestational days 0, 10, and 18, and before HFD feeding, blood samples were collected from the eyeball of mice, and FBG was measured using a blood glucose meter. Then, the chemiluminescence assay was applied to measure FINS as described above. Homeostasis model assessment of insulin resistance (HOMA-IR) was calculated as per the formula: HOMA-IR=FBG×FINS/ 22.5. A larger HOMA-IR index suggested lower sensitivity of peripheral tissues to insulin, thus indicating higher IR. Insulin sensitivity index for oral glucose tolerance tests (ISOGTT) was calculated as 10,000 divided by the square root of (fasting plasma glucose×fasting immunoreactive insulin×[mean glucose× mean insulin]). The larger the ISOGTT value, the weaker the IR. Insulinogenic index (IGI) was calculated using the formula: IGI=(insulin concentration at 30 min–FINS)/(blood glucose concentration at 30 min–FBG), HOMA pancreatic β-cell function (HOMA-β)=(FINS × 20)/(FBG–3.5).
Preparation of NPs
The Janus base nanotubes (JBNTs) were synthesized and dissolved in water to a 1 mg/mL solution. For cell culture experiments, NPs were generated with 2 μL anti-miRNA AMO (50 μmol/L) mixed with 30 mL nanotube (1 μg/mL). After 2,5-minute of sonication at 22 Watts/cm2 (Q700 Sonicator, Qsonica, Newtown, CT, USA), the assembled NPs were incubated together with the cells with addition of 1 mL medium for 48 hours in the absence of any transfection reagents. For animal experiments, 7 μL AMO (50 μmol/L) was mixed with 105 mL JBNT (1 μg/mL) to produce each dose of NPs, followed by 2.5-minute of sonication. 45.5 μL poly(ethylene glycol) 400 (Sigma) and 25.2 μL glucose solution (55% wt./vol, Sigma) were loaded to the NP solution (182.7 μL in total). Each control dose consisted of the same components with AMO placed by control anti-miRNA (50 μmol/L). A toxicity study was conducted with NPs which showed no damage to apoptosis in vitro or organ toxicity in vivo at the indicated concentrations and doses.
Hematoxylin-eosin staining
The islet tissues of mice were fixed in 10% formaldehyde solution, embedded in paraffin, and prepared into paraffin sections. The sections were air-dried at ambient temperature, rinsed with phosphate buffered saline (PBS) for 3 seconds, colored in hematoxylin for 60 seconds, and immersed in 1% hydrochloric acid-ethanol for 3 seconds. Following PBS washing for 3 seconds, the sections were counterstained with eosin for 3 minutes, followed by dehydration with gradient alcohol, clearing with xylene, and mounting with neutral resin. Lastly, the histopathological changes of islet tissues were visualized under an optical microscope (BX63, Olympus, Jinan Laibao Medical Instrument Co. Ltd., Jinan, China).
Immunohistochemistry
The islet tissues were rinsed and fixed in 4% paraformaldehyde solution for 48 hours. The islet tissues were then dehydrated by gradient alcohol, cleared by xylene, embedded in paraffin, and finally sliced into 5-µm-thick sections. The sections were then dried at 60°w, dewaxed by xylene, dehydrated by gradient alcohol, and immersed in 3% H2O2 to quench endogenous peroxidase. Subsequently, the sections were blocked in 1% bovine serum albumin for 15 minutes, and incubated with primary rabbit antibodies to phosphorylated (p)-ERK1/2 (ab184699, 1:100, Abcam, Cambridge, UK) and SREBP-2 (28212-1-AP, 1:200, Proteintech, Wuhan, China) overnight at 4°C. After rewarming for 30 minutes, another incubation was implemented with addition of secondary antibody goat anti-rabbit immunoglobulin G (IgG) H&L horseradish peroxidase (HRP) (ab6721, 1:200, Abcam) at ambient temperature for 1 hour. After PBS washing, the sections were developed with diaminobenzidine tetrahydrochloride, and stained with hematoxylin. The sections were then observed under a microscope (CX33, Olympus) after dehydration and sealing.
Dual-luciferase reporter assay
SREBP-2-3’UTR gene fragments were cloned into the pmirGLO vector (E1330, Promega, Madison, WI, USA), designated as pSREBP-2-wild type (WT). After site-directed mutagenesis at the binding site between miR-328-3p and SREBP-2, pSREBP2-mutant (MUT) vectors were constructed. The pRL-TK vector (E2241, Promega) carrying renilla luciferase was adopted as an internal control. miR-328-3p mimic or NC mimic was co-manipulated with the constructed pSREBP-2-WT and pSREBP-2-MUT vectors, respectively, into islet cells. The luciferase activity was detected as per the method described in the Promega kit.
Terminal deoxynucleotidyl transferase-mediated dUTP-biotin nick-end labeling assay
Paraffin islet tissues were prepared and cell apoptosis in which was assayed in accordance with the instructions of terminal deoxynucleotidyl transferase-mediated dUTP-biotin nick-end labeling (TUNEL) kit (KeyGEN Biotech Corp. Ltd., Nanjing, China). Thereafter, optical microscopic images were captured. The cells with brown-stained nuclei were regarded as the apoptotic cells. A sum of 5 high-power visual fields with most abundant positive cells were selected from three random sections of each mouse. The apoptotic cells and total cells were counted, with the apoptotic index (AI) calculated using the formula: AI=the number of apoptotic cells/the number of total cells×100%.
Cell culture and transfection
Mouse insulinoma BETA-TC-6 cell line purchased from Tongpai Bio Technology Co. Ltd. (Shanghai, China) was cultured in Dulbecco’s modified Eagle’s medium/Ham’s F-12 medium (DMEM/F12) (GNM-12500-S, Jingke Chemical Technology Company, Shanghai, China) that contained 20% fetal bovine serum (FBS) in a 5% CO2 incubator at 37°t. Next, the cells were seeded into 6-well plates with 2×10⁵ cells/well and then introduced with plasmids of oe-NC+NC mimic, lncRNA TUG1 overexpression (oe-lncRNA TUG1)+NC mimic, oe-NC+miR-328-3p mimic, and oe-lncRNA TUG1+miR-328-3p mimic according to the instructions of the Lipofectamine RNAiMax reagent kit (Life Technologies, Grand Island, NY, USA). After 48 hours, the cells were collected for subsequent experiments.
Enzyme-linked immunosorbent assay
Cells were seeded into 96-well plates for 24 hours and then treated with 3.3 mM basal glucose or 16.7 mM high glucose for 1 hour. The total insulin content was measured in the cells upon ultrasonic treatment in acidic ethanol (2% H2SO4), after which the cells were subjected to three freeze-thaw cycles, and centrifugation at 10,000 g for 5 minutes. Next, the insulin level was measured in the supernatant using the enzyme-linked immunosorbent assay (ELISA) Kit (CUSABIO Biotech Co. Ltd., Wuhan, China).
Cell counting kit-8 assay
Cell counting kit-8 (CCK-8) kit (K1018, ApexBio, Houston, TX, USA) was used in this experiment. In brief, cells in each group were seeded into 96-well plates at a density of 1×10³ cells/well and cultured with 100 μL medium replenished with 10% FBS for 1 to 5 days. Each well was then added with 10 μL of CCK-8 solution and incubated for 1 hour. Subsequently, the optical density (OD) values at 450 nm were determined by a microplate reader.
Flow cytometry
The apoptosis rate of cells in each group was assayed employing the Annexin V/propidium iodide (PI) apoptosis detection kit (BD Biosciences, Franklin Lakes, NJ, USA). Cells were resuspended in binding buffer and incubated with 5 μL of fluorescein isothiocyanate in the dark at room temperature for 15 minutes. Before putting on the machine, the cells were added with 5 μL of PI staining solution and then with 200 μL of binding buffer. Finally, the fluorescence-activated cell sorting scan flow cytometry system (BD Pharmingen, San Diego, CA, USA) was utilized for analysis.
Argonaute 2-RNA binding protein immunoprecipitation assay
RNA binding protein immunoprecipitation (RIP) assay was carried out using the RIP Kit (Millipore, Billerica, MA, USA). In short, the cells were lysed in complete RNA lysis buffer, and added with RIP buffer containing magnetic beads coupled with NC IgG or argonaute 2 (Ago2) antibody (mouse, Millipore) for overnight incubation. The next day, the cells were treated with protease K for 30 minutes and the RNA was extracted and adopted for subsequent reverse transcription-quantitative polymerase chain reaction (RT-qPCR) detection.
RNA pull-down assay
In order to detect the lncRNA pulled down by miRNA, the islet cells overexpressing lncRNA TUG1 were lysed and incubated with the miR-328-3p biotin-coupled probe pre-bound to magnetic beads. The RNeasy Mini Kit (Qiagen Company, Hilden, Germany) was applied for the target RNA extraction for 2 hours. The pull-down products were extracted and the expression of lncRNA TUG1 was detected by RT-qPCR.
RNA isolation and quantitation
Total RNA was extracted using TRIzol kit (Invitrogen, Carlsbad, CA, USA) and then reverse transcribed into complementary DNA (cDNA) according to the instructions of TaqMan MicroRNA Assay Kit (4427975, Applied Biosystems, Carlsbad, CA, USA). For miRNA detection, PolyA tailing reverse transcription Kit (B532451, Sangon Biotech Co. Ltd., Shanghai, China) was used for reverse transcription, with PolyA-containing cDNA obtained. Real-time qPCR was then performed with 25 μL reaction systems as follows: 5 μL reverse transcription products; 13 μL 2×QuantiTect SYBR Green RT-PCR Master Mix, 0.5 μL PCR upstream primers (10 μmol/μL), 0.5 μL PCR downstream primer (10 μmol/μL), and 6 μL free-DNAase water. U6 served as the internal reference of miR-328-3p and β-actin as that of and SREBP-2, respectively (Supplementary Table 1). The expression of target genes was finally calculated using the 2−∆∆Ct method.
Preparation of nuclear extracts
Nuclear proteins were isolated using a nuclear protein extraction kit (Imgenex, San Diego, CA, USA) as per the manufacturer’s instructions. Briefly, small pieces of fresh pancreatic islet tissues were washed twice with 5 mL of ice-cold PBS/phenylmethylsulfonyl fluoride buffer, homogenized in 5 mL of 1×hypotonic buffer supplemented with 1 mM dithiothreitol and 1% detergent, and placed on ice for 30 minutes. After centrifugation at 8,000 g for 10 minutes at 4°C, the supernatant (cytoplasmic fraction) was removed, and the nuclear fraction was incubated with 500 μL of complete lysis buffer for 30 minutes at 4°C through shaking. The samples were centrifuged at 10,000 g for 10 minutes at 4°C. The supernatant containing nuclear proteins was harvested and transferred to pre-chilled tubes.
Western blot analysis
Total protein was extracted from cells using a protein extraction kit (BB-3121, Shanghai Best Biotechnology Co. Ltd., Shanghai, China), with the concentration determined using a bicinchoninic acid kit (20201ES76, Yeasen Biotechnology Co. Ltd., Shanghai, China). A 20 μg protein was separated by sodium dodecyl sulfate-polyacrylamide gel electrophoresis (SDS-PAGE) for 1 hour and then delivered onto a polyvinylidene fluoride membrane. The membrane was blocked with 5% skim milk and then incubated with the following anti-bodies (Abcam) overnight at 4°C, β-actin (ab8227, 1:1,000), SREBP-2 (ab228653, 1:500), ERK (ab32537, 1:1,000), Ras (ab52939, 1:5,000), and phosphorylated (p)-ERK (ab201015, 1:1,000). The membrane was re-probed with HRP-tagged goat antimouse IgG (ab6789, 1:1,000, Abcam) or goat anti-rabbit IgG (ab6721, 1:1,000, Abcam) for 1 hour. Subsequently, the immunocomplexes on the membrane were visualized using enhanced chemiluminescence (ECL) (ECL808-25, Biomiga Inc., San Diego, CA, USA), after which the band intensities were quantified using Image J software (https://imagej.nih.gov/ij/download.html). Relative expression of target protein referred to the ratio of gray values of target protein bands and that of internal reference β-actin band.
Statistical analysis
SPSS version 21.0 statistical software (IBM Corp., Armonk, NY, USA) was employed for statistical analysis. Measurement data were displayed as mean±standard deviation. Data with normal distribution and homogeneity of variance between two groups were compared with unpaired t-test, and data among multiple groups with one-way analysis of variance (ANOVA), followed by the Tukey’s post hoc test. Comparisons among data at different time points were conducted using repeated measures ANOVA, followed by Tukey’s post hoc test. A P<0.05 was deemed to be statistically significant.
Availability of data and material
The datasets generated/analyzed during the current study are available.
RESULTS
miR-328-3p was abundantly expressed in the islet tissues of GDM mice We initially constructed the GDM mouse model by HFD induction and measured the FBG level of mice at different periods. The results displayed elevated FBG level in GDM mice before HFD and at days 10 and 18 of gestation (P<0.05), but there was no alteration before HFD and at day 0 of gestation compared to control mice (Fig. 1A). Additionally, at day 18 of gestation, the levels of FINS and HOMA-IR were also increased in GDM mice (P<0.05) (Fig. 1B). Moreover, OGTT showed that at 0.5 hour after oral glucose loading, the blood glucose level was augmented and reached a peak, and then decreased at 1 and 2 hours in GDM mice (P<0.05) (Fig. 1C). The ISOGTT and IGI were found to be lower, while the level of HOMA-β was higher in GDM mice than in control mice, indicating increased IR in the GDM mice (Supplementary Table 2).
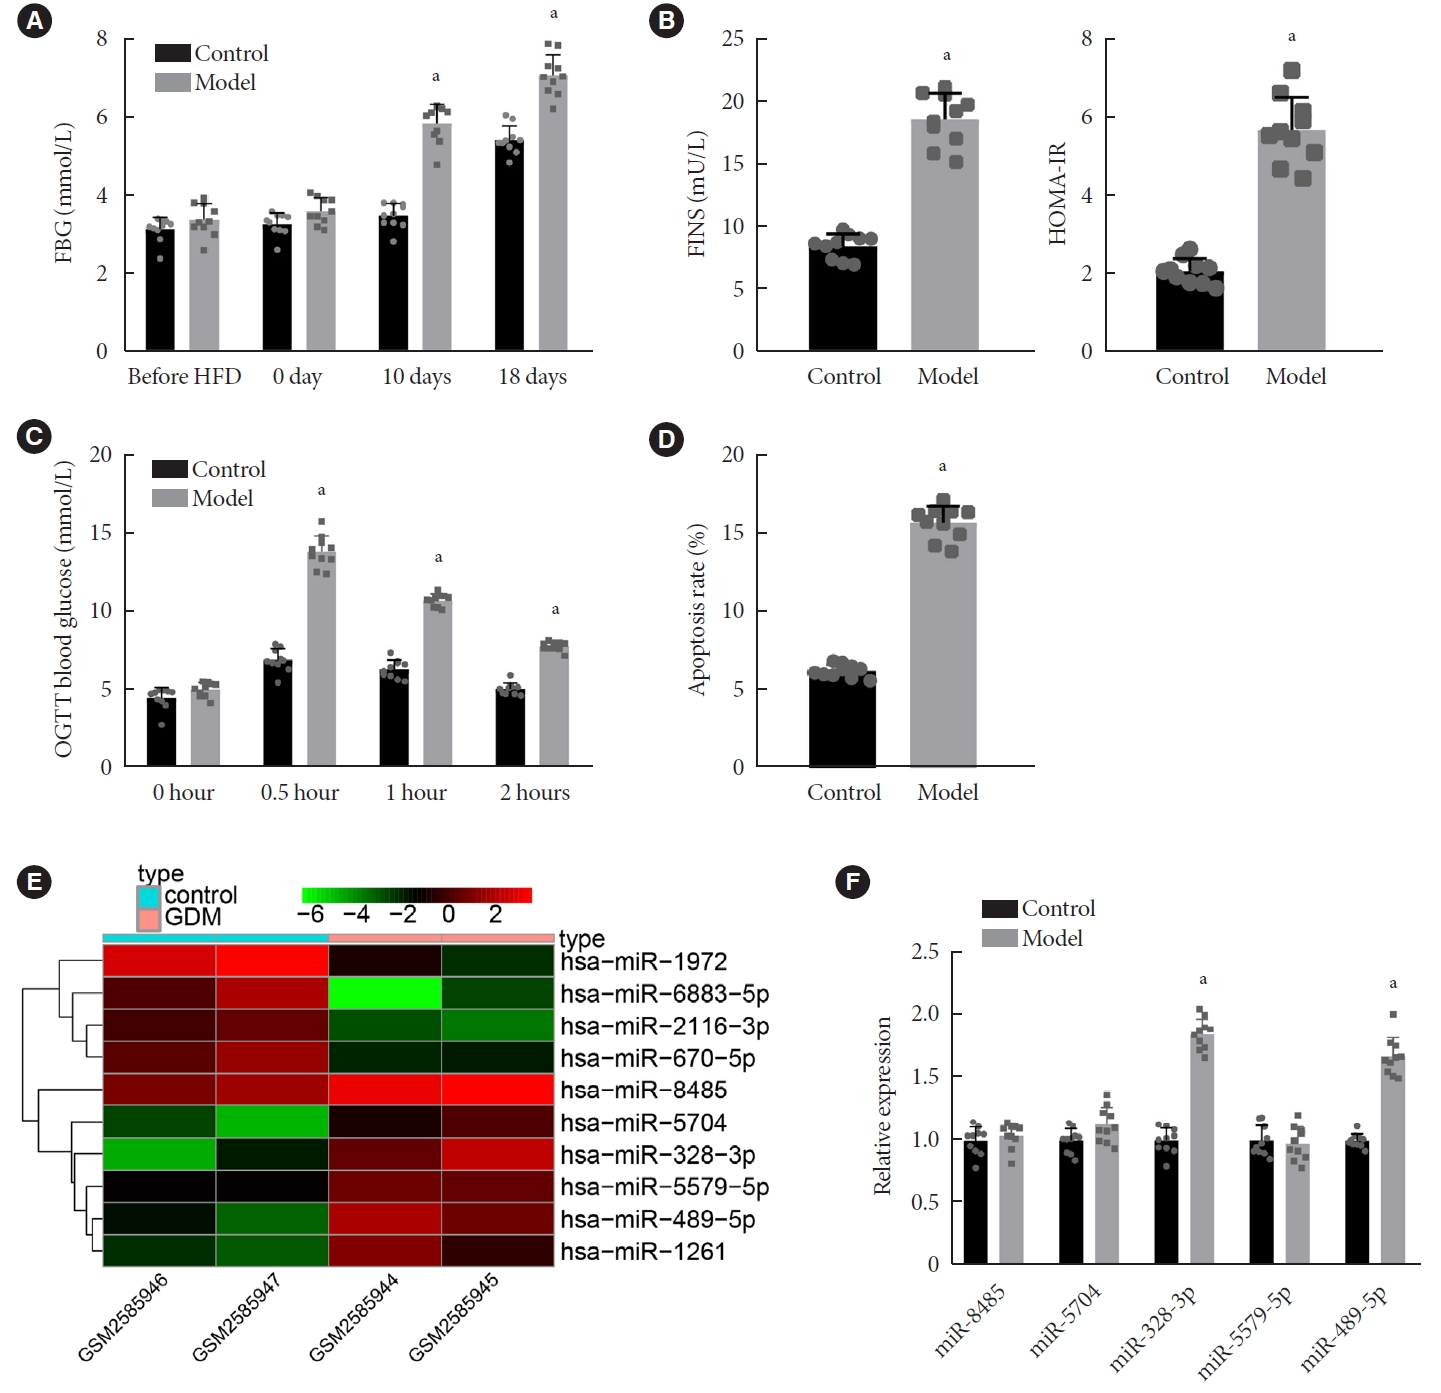
Characterization of the gestational diabetes mellitus (GDM) mouse model and miRNA expression profiles in GDM. (A) Fasting blood glucose (FBG) levels (mmol/L) at different periods of gestation in control and GDM mice. (B) Levels of fasting insulin (FINS) and homeostasis model assessment of insulin resistance (HOMA-IR) at day 18 of gestation in control and GDM mice. (C) Glucose area under the curve at different time points in control and GDM mice. (D) Cell apoptosis in the islet tissues of control and GDM mice determined by terminal deoxynucleotidyl transferase-mediated dUTP-biotin nick-end labeling (TUNEL) assay. (E) A heat map of the top 10 differentially expressed miRNAs screened from the GSE98043 dataset. The abscissa indicates the sample number and the ordinate indicates the differentially expressed miRNAs; the upper right histogram is the color gradation; each rectangle corresponds to the value of a miRNA expression in one sample. (F) Expression of miR-8485, miR-5704, miR-328-3p, miR-5579-5p, and miR-489-5p determined by reverse transcription-quantitative polymerase chain reaction in islet tissues of control and GDM mice. OGTT, oral glucose tolerance test. aP<0.05 vs. control mice (n=10 for mice upon each treatment).
Analysis on the islet tissues using the hematoxylin-eosin (HE) staining suggested regular-shaped islets, with an orderly arrangement of cells with uniform size, abundant cytoplasm, round nucleus, and clear chromatin in the islet tissues of control mice. However, the islet tissues of GDM mice exhibited irregular-shaped islets with atrophy of varying degrees, a disorderly arrangement of cells, fewer cells, vacuolar degeneration in some cells along with nuclear pyknosis and cleavage, and infiltration of inflammatory lymphocytes and monocytes (Supplementary Fig. 2A). Additionally, the apoptosis of cells was enhanced in the islet tissues of GDM mice (Fig. 1D). These results demonstrated the successful establishment of the GDM mouse model.
Differential analysis on the GSE98043 dataset revealed 10 differentially expressed miRNAs and a heat map illustrating these miRNAs is shown in Fig. 1E. Among the 10 miRNAs, miR-8485, miR-5704, miR-328-3p, miR-5579-5p, and miR-489-5p were upregulated. Using DIANA database miRPATH module, KEGG enrichment analysis showed that only miR-328-3p and miR-489-5p were retrieved in mice among the upregulated miRNAs, indicating miR-328-3p and miR-489-5p as conserved miRNAs in humans and mice. Only the downstream genes of miR-328-3p were significantly enriched in the glycosaminoglycan biosynthesis-heparan sulfate/heparin pathway (Supplementary Fig. 3). It has been shown that glycosaminoglycans and heparin are both related to GDM [24]. Further verification by RT-qPCR revealed that among the five miRs (miR-8485, miR-5704, miR-328-3p, miR-5579-5p, and miR-489-5p), the expression of miR-328-3p and miR-489-5p was increased in islet tissues of GDM mice compared with that in control mice, for which miR-328-3p exhibited a more pronounced increase (Fig. 1F). Therefore, we speculated that miR-328-3p might play an important role in GDM.
Inhibition of miR-328-3p ameliorates IR in GDM mice
To analyze the role of miR-328-3p in GDM mice, we constructed a GDM mouse model and injected anti-miRNA AMO directed against miR-328-3p utilizing a shRNA to mice to knockdown miR-328-3p expression. RT-qPCR showed a downward trend in miR-328-3p expression in mouse islet tissues after the NP-based delivery of miR-328-3p inhibitor (Supplementary Fig. 4A). In addition, the FBG level was found to be reduced in GDM mice injected with miR-328-3p inhibitor-encapsulated NPs before onset of HFD and at days 10 and 18 of gestation (Fig. 2A). At day 18 of gestation, the levels of FINS and HOMA-IR were decreased in GDM mice injected with NPs expressing miR-328-3p inhibitor (Fig. 2B). Moreover, OGTT showed that at 0.5 hour after oral glucose load, the blood glucose level had declined to its nadir in the GDM mice, and then increased at 1 to 2 hours after injection with NPs expressing miR-328-3p inhibitor (Fig. 2C). Furthermore, treatment with miR-328-3p inhibitor could enhance the ISOGTT and IGI, whereas decreasing HOMA-β levels (Supplementary Table 3), suggesting that inhibition of miR-328-3p could alleviate IR.
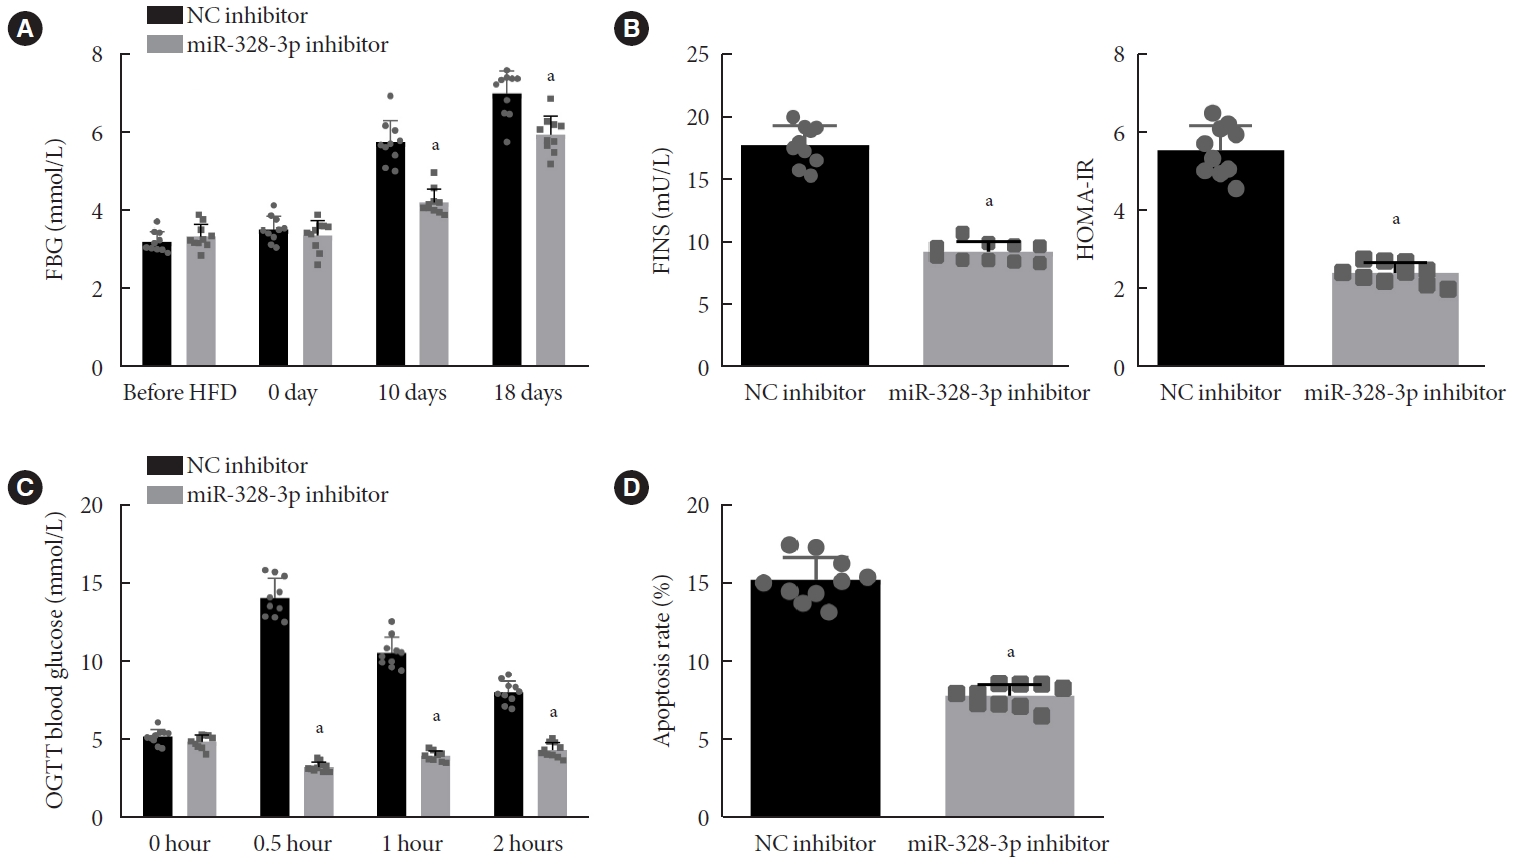
Inhibition of miR-328-3p attenuates insulin resistance in gestational diabetes mellitus (GDM) mice. (A) Fasting blood glucose (FBG) levels (mmol/L) at different time points of gestation in GDM mice injected with nanoparticles (NPs) expressing negative control (NC) inhibitor or miR-328-3p inhibitor. (B) Levels of fasting insulin (FINS) and homeostasis model assessment of insulin resistance (HOMA-IR) at day 18 of gestation in GDM mice injected with NPs expressing NC inhibitor or miR-328-3p inhibitor. (C) Glucose area under the curve at different time points of gestation in GDM mice injected with NPs expressing NC inhibitor or miR-328-3p inhibitor. (D) Apoptosis of cells in islet tissues of GDM mice injected with NPs expressing NC inhibitor or miR-328-3p inhibitor detected using terminal deoxynucleotidyl transferase-mediated dUTP-biotin nick-end labeling (TUNEL) staining. OGTT, oral glucose tolerance test. aP<0.05 vs. GDM mice injected with NPs expressing NC inhibitor (n=10 for mice following each treatment).
HE staining of the islet tissues indicated irregular-shaped islets with varying degrees of atrophy, a disorderly arrangement of cells, fewer cells, vacuolar degeneration in some cells with nuclear pyknosis and cleavage, and infiltration of inflammatory lymphocytes and monocytes in GDM mice injected with NPs expressing NC inhibitor. On the other hand, regular islet shape with the presence of slight hemorrhage, reduced number of cells, and little vacuolar degeneration were evident in the GDM mice injected with NPs expressing miR-328-3p inhibitor (Supplementary Fig. 2B). Additionally, TUNEL staining showed a reduction in the cell apoptosis in islet tissues of GDM mice injected with NPs expressing miR-328-3p inhibitor (Fig. 2D). Therefore, inhibition of miR-328-3p could improve IR in GDM mice.
miR-328-3p targets SREBP-2 and negatively regulates its expression
Next, we shifted our attention to determine the downstream mechanism by which miR-328-3p affects GDM. The miR-328-3p targets attained from TargetScan, miRDB, starBase, DIANA, and RNA22 databases were then intersected with the 51 DEGs obtained from the GSE41095 dataset (Fig. 3A). The obtained intersection genes were regarded as candidate target genes of miR-328-3p and used for subsequent analyses. To further clarify the key downstream target genes of miR-328-3p related to GDM, we included disease genes and miR-328-3p candidate target genes into the String database, and constructed a gene interaction network. WD and tetratricopeptide repeats 1 (WDTC1), SREBP-2, and ephrin-A2 (EFNA2) were found to be the miR-328-3p downstream genes with the highest correlation with other genes (Fig. 3B, Supplementary Table 4).
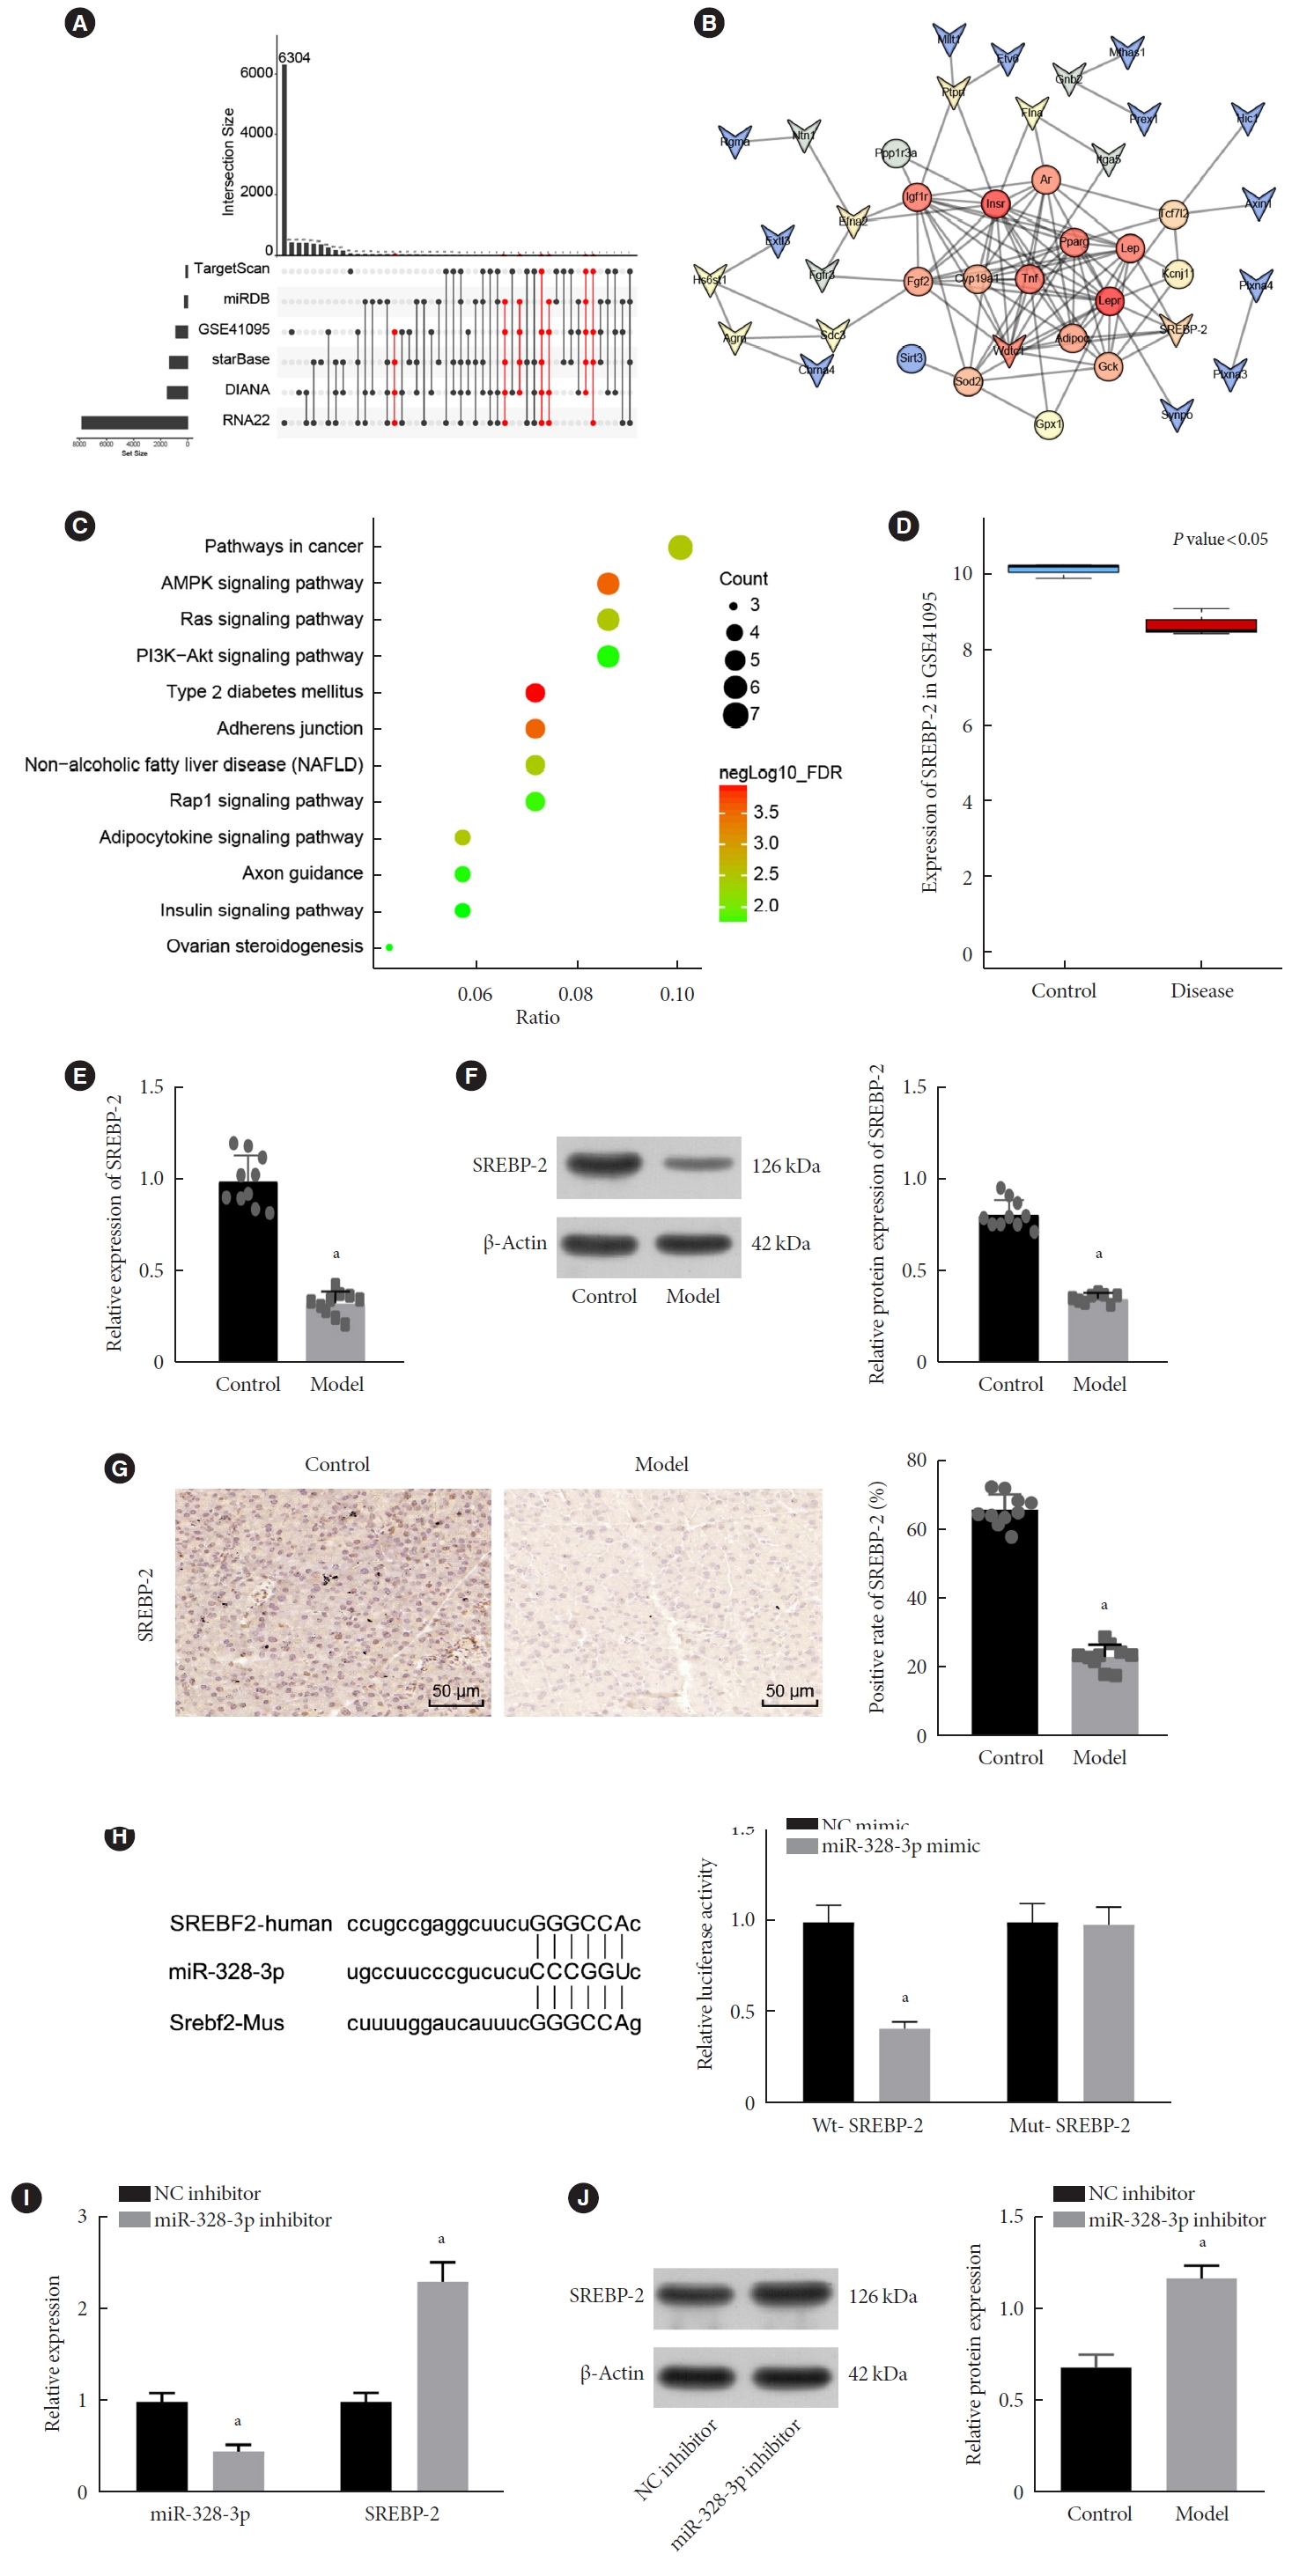
Sterol regulatory element binding protein 2 (SREBP-2) is a target gene of miR-328-3p. (A) Target genes of miR-328-3p predicted by the TargetScan, miRDB, starBase, DIANA, and RNA22 databases intersected with differentially expressed genes (DEGs) from the GSE41095 dataset. Red refers to the target genes of miR-328-3p simultaneously predicted by at least three databases and also differentially expressed in gestational diabetes mellitus (GDM) samples from the GSE41095 dataset. (B) An interaction network between candidate miR-328-3p target genes and GDM-related genes analyzed using the DisGeNET database; the circle indicates the disease gene, and the arrow indicates the DEG; genes with correlation coefficient of 0 are not shown in the figure. (C) Kyoto Encyclopedia of Genes and Genomes (KEGG) enrichment analysis of candidate miR-328-3p target genes and GDM-related genes obtained from the DisGeNET database. (D) Expression of SREBP-2 in normal and GDM samples in the GSE41095 dataset; red box refers to GDM samples, and blue box represents normal samples. (E) Expression of SREBP-2 determined by reverse transcription-quantitative polymerase chain reaction (RT-qPCR) in islet tissues of control and GDM mice. (F) Western blot analysis of SREBP-2 protein in islet tissues of control and GDM mice. (G) Immunohistochemistry staining of SREBP-2 protein in islet tissues of control and GDM mice. (H) Putative miR-328-3p binding sites in the 3’-untranslated region (3’-UTR) of SREBP-2 predicted by the starBase database (the left image) and miR-328-3p binding to SREBP-2 confirmed by dual-luciferase reporter assay in islet cells (the right image). (I) miR-328-3p expression and mRNA expression of SREBP-2 in islet tissues of GDM mice treated with nanoparticles (NPs) expressing negative control (NC) inhibitor or miR-328-3p inhibitor determined by RT-qPCR. (J) Western blot analysis of SREBP-2 protein in islet tissues of GDM mice treated with NPs expressing NC inhibitor or miR-328-3p inhibitor. aP<0.05 vs. GDM mice treated with NPs expressing NC mimic or NC inhibitor. Cell experiments were repeated three times.
Following KEGG pathway enrichment analysis, the disease genes and candidate target genes were found to be enriched in the T2DM and insulin signaling pathways (Fig. 3C). Among them, only SREBP-2 was found to be related to GDM [18]. In the GSE41095 dataset, SREBP-2 was identified to be downregulated in GDM samples (Fig. 3D). These findings led us to speculate that miR-328-3p may target SREBP-2 and is involved in the occurrence and development of GDM. Subsequent results of RT-qPCR, Western blot, and immunohistochemistry revealed a consistent reduction in the SREBP-2 expression in islet tissues of GDM mice (Fig. 3E-G).
Having obtained data that verified the dysregulation of miR-328 and SREBP-2 in GDM, we shifted our experimental focus to ascertain the relation between miR-328-3p and SREBP-2. The starBase database predicted the putative miR-328-3p binding sites in the 3’-UTR of SREBP-2 in human and mice (Fig. 3H). Dual-luciferase reporter assay further demonstrated that the luciferase activity of SREBP-2-WT was inhibited following transfection with miR-328-3p mimic, while no remarkable difference was found in that of SREBP-2-MUT (Fig. 3H). Furthermore, the RT-qPCR and Western blot data revealed reduced miR-328-3p expression and elevated expression of SREBP-2 in the islet tissues in response to NP-based delivery of miR-328-3p inhibitor (Fig. 3I and J). These findings demonstrated that miR-328-3p targeted SREBP-2 and negatively regulated its expression.
MiR-328-3p targets SREBP-2 to activate the ERK signaling pathway and induce IR in GDM mice
We then proceeded to examine whether miR-328-3p affects IR in GDM mice by targeting SREBP-2. miR-328-3p expression was upregulated in islet tissues of GDM mice treated with NPs expressing miR-328-3p mimic, whereas, SREBP-2 expression was downregulated. miR-328-3p expression showed no changes but SREBP-2 expression was elevated in the islet tissues of GDM mice treated with NPs expressing oe-SREBP-2 (Supplementary Fig. 4B and C). FBG level was elevated following overexpression of miR-328-3p, but was decreased upon SREBP-2 overexpression. In addition, concomitant overexpression of miR-328-3p and SREBP-2 led to an enhancement of the FBG level than individual SREBP-2 overexpression. The FBG level exhibited no evident alterations following each treatment before HFD and at day 0 of gestation (P>0.05) (Fig. 4A). At day 18 of gestation, levels of FINS and HOMA-IR were increased upon elevation of miR-328-3p, but were reduced in response to SREBP-2 gain-of-function. The FINS and HOMA-IR levels were augmented by miR-328-3p elevation in the presence of SREBP-2 (Fig. 4B). Moreover, at 0.5 hour after oral glucose load, blood glucose level was increased following overexpression of miR-328-3p and reached the zenith at X minutes, and then decreased at 1 to 2 hours, while opposite results were observed after SREBP-2 overexpression alone (P<0.05) (Fig. 4C). The ISOGTT and IGI were found to be decreased while HOMA-β was elevated in GDM mice following miR-328-3p overexpression, which was abrogated following SREBP-2 overexpression. Simultaneous overexpression of miR-328-3p and SREBP-2 led to lower ISOGTT and IGI and higher HOMA-β levels than SREBP-2 overexpression alone (Supplementary Table 5).

MiR-328-3p induces insulin resistance by disrupting the sterol regulatory element binding protein 2 (SREBP-2)-mediated extracellular signal-regulated kinase (ERK) signaling pathway inactivation in gestational diabetes mellitus (GDM) mice. GDM mice were injected with nanoparticles (NPs) expressing miR-328-3pmimic, overexpression (oe)-SREBP-2 or both. (A) Fasting blood glucose (FBG) levels (mmol/L) at different periods of gestation in GDM mice. (B) Levels of fasting insulin (FINS) and homeostasis model assessment of insulin resistance (HOMA-IR) at day 18 of gestation in GDM mice. (C) Glucose area under the curve at different gestational time points in GDM mice. (D) Apoptosis of cells in islet tissues of GDM mice detected using terminal deoxynucleotidyl transferase-mediated dUTP-biotin nick-end labeling (TUNEL) staining. (E) Western blot analysis of SREBP-2 and Ras proteins, and ERK phosphorylation level in islet tissues of GDM mice. (F) Immunohistochemistry analysis of SREBP-2- and p-ERK-positive cells in islet tissues of GDM mice. (G) The 3-hydroxy-3-methylglutaryl-CoA reductase (HMGCR) mRNA expression in pancreatic islet tissue of pregnant mice determined by reverse transcription-quantitative polymerase chain reaction. NC, negative control; OGTT, oral glucose tolerance test. aP<0.05 vs. GDM mice injected with NPs expressing NC inhibitor, bP<0.05 vs. GDM mice injected with NPs expressing NC mimic+oe-SREBP-2 (n=10 for mice following each treatment).
HE staining indicated irregular-shaped islets with atrophy of varying degrees, disorderly arrangement of cells, fewer cells, vacuolar degeneration in some cells with nuclear pyknosis and cleavage, and infiltration of inflammatory lymphocytes and monocytes in islet tissues of GDM mice treated with miR-328-3p mimic. However, islet tissues of GDM mice treated with oe-SREBP-2 showed regular-shaped islets with only slight hemorrhage, reduced number of islet cells, and vacuolar degeneration (Supplementary Fig. 2C). Furthermore, TUNEL staining showed augmented apoptosis of cells in islet tissues of GDM mice upon miR-328-3p re-expression, while the apoptosis was decreased when SREBP-2 expression was elevated. Additionally, cell apoptosis was much higher in response to dual overexpression of miR-328-3p and SREBP-2 than that upon SREBP-2 overexpression alone (Fig. 4D).
A previous study has demonstrated that miR-328-3p could activate the ERK signaling pathway and moreover that SREBP-2 knockdown induced a similar trend [25]. Thus, we speculated that miR-328-3p might inhibit SREBP-2 to activate the ERK signaling pathway. In this study, Western blot analysis results displayed that the precursor and mature SREBP-2 protein levels and nuclear mature SREBP-2 protein level were reduced, while Ras protein expression as well as the ERK phosphorylation level was elevated following miR-328-3p gain-of-function; opposite effects were seen following SREBP-2 overexpression. Dual overexpression of miR-328-3p and SREBP-2 resulted in reduced the precursor and mature SREBP-2 protein levels and nuclear mature SREBP-2 protein level, and elevated the Ras protein expression as well as the ERK phosphorylation level compared with SREBP-2 overexpression alone (Fig. 4E). Immunohistochemistry showed that the SREBP-2-positive cells were decreased and p-ERK-positive cells were increased in islet tissues of mice with enhanced miR-328-3p expression. Conversely, overexpression of SREBP-2 resulted in opposite results. Relative to individual elevation of SREBP-2, concomitant elevations of miR-328-3p and SREBP-2 resulted in fewer SREBP-2-positive cells and more abundant p-ERK-positive cells (Fig. 4F). As depicted in Fig. 4G, the 3-hydroxy-3-methylglutaryl-CoA reductase (HMGCR) mRNA expression was reduced upon miR-328-3p gain-of-function while increasing in upon manipulation with NC mimic+oe-SREBP-2; moreover, the expression of HMGCR decreased by miR-328-3p mimic in the presence of oe-SREBP-2. Overall, miR-328-3p could downregulate SREBP-2, and then activate the ERK signaling pathway, thereby inducing IR in GDM mice.
LncRNA TUG1 binds to miR-328-3p and upregulates SREBP-2 expression in pancreatic β-cells
In order to further dissect out the upstream regulatory mechanism of miR-328-3p, we adopted the starBase database to predict the upstream regulatory lncRNA of miR-328-3p in human and mice. Following analysis, lncRNA TUG1 was found at the intersection (Fig. 5A). LncRNA TUG1, a 7.1-kb lncRNA, is located on human chromosome 22q12 [26]. The genecards database showed that lncRNA TUG1 was abundant in various human tissues, and expressed both in the nucleus and in the cytoplasm. The lncLocator further predicted that lncRNA TUG1 was mainly located in the cytoplasm of humans and mice (Supplementary Table 6). LncRNA TUG1 has a highly conserved homologue in human, rat, bovine, and monkey genomes, but no homologue in mouse genomes [27]. Additionally, there were binding sites between miR-328-3p and lncRNA TUG1 in both human and mice, showing the consistent binding sites (Fig. 5B). Additionally, RT-qPCR confirmed a decline of lncRNA TUG1 expression in the islet tissues of GDM mice (Fig. 5C). Dual-luciferase reporter assay further indicated that the luciferase activity of lncRNA TUG1-WT was inhibited in miR-328-3p mimic-transfected islet cells, while no changes were identified in the lncRNA TUG1-MUT luciferase activity (Fig. 5D). These results established the interaction between miR-328-3p and lncRNA TUG1. Additionally, Ago2-RIP assay showed that the enrichment of lncRNA TUG1 and miR-328-3p in the complex pulled down by Ago2 antibody were increased (Fig. 5E). RNA pull-down assay results indicated that lncRNA TUG1 was enriched in the complex pulled down by biotin-labeled miR-328-3p with streptavidin magnetic beads (Fig. 5F).
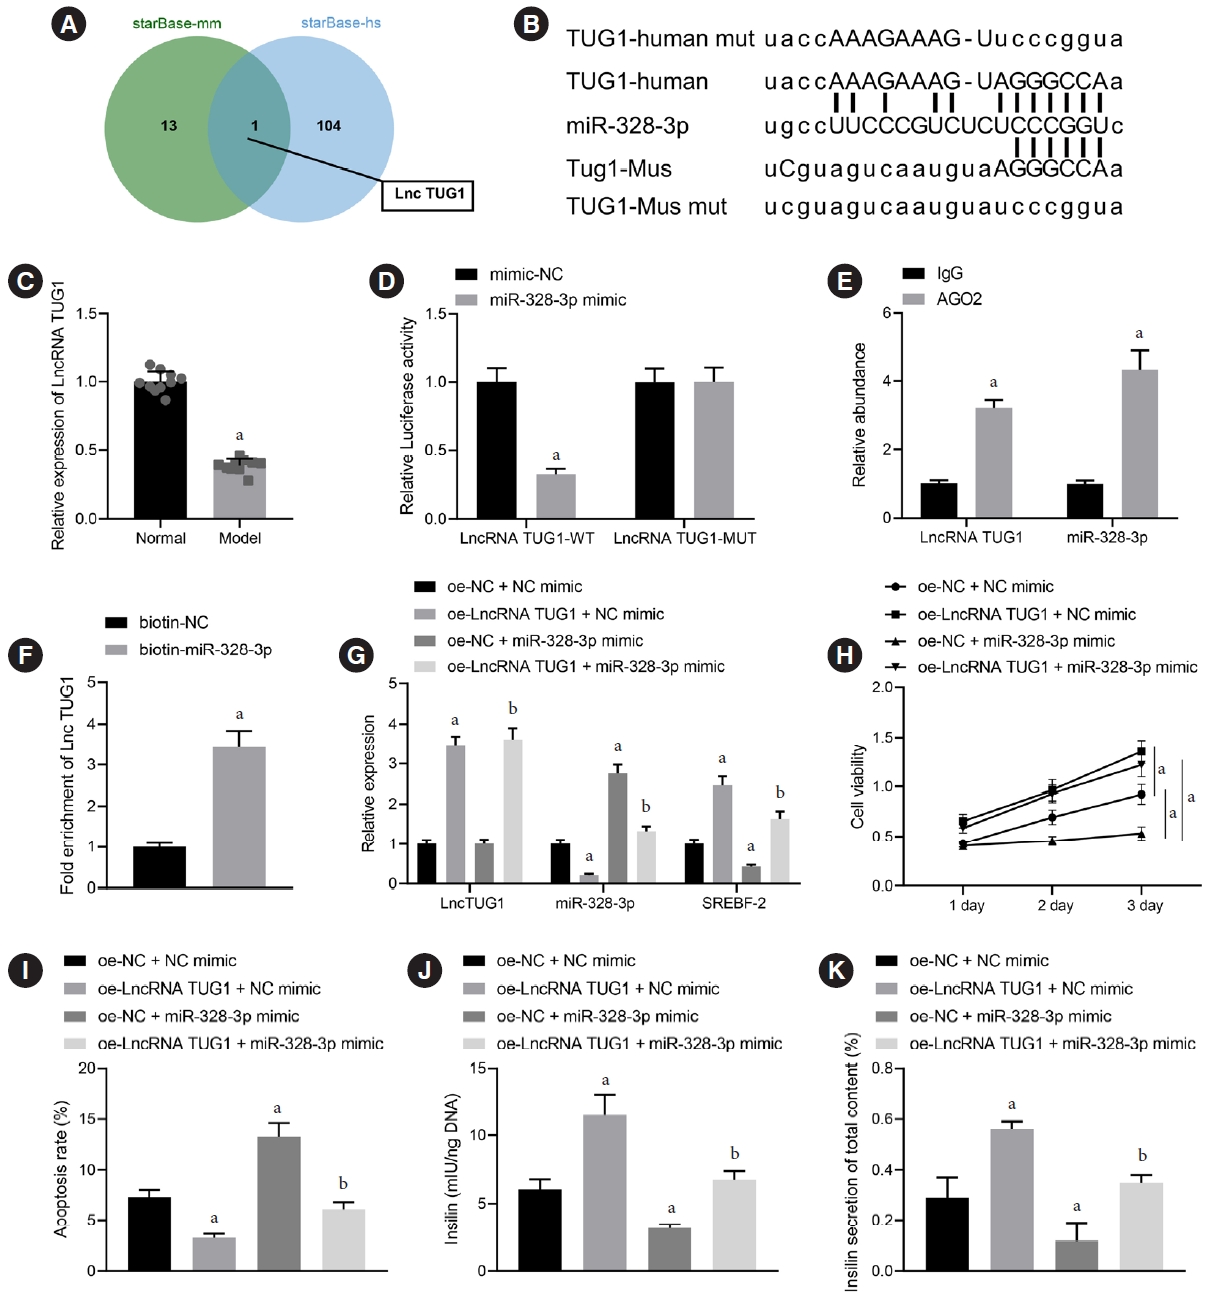
Long non-coding RNAs (lncRNA) taurine upregulated gene 1 (TUG1) binds to miR-328-3p to upregulate sterol regulatory element binding protein 2 (SREBP-2) expression and enhance pancreatic β-cell viability and insulin secretion. (A) Upstream regulatory lncRNAs of miR-328-3p in human and mice predicted by the starBase database; the two circles in the figure represent the prediction results in human and mice respectively, and the central part represents the intersection of the two sets of data. (B) Binding sites between miR-328-3p and lncRNA TUG1 both in human and mice. (C) LncRNA TUG1 expression in the islet tissues of control and gestational diabetes mellitus (GDM) mice determined by reverse transcription-quantitative polymerase chain reaction (RT-qPCR). (D) Binding between miR-328-3p and lncRNA TUG1 confirmed by dual-luciferase reporter assay in islet cells transfected with miR-328-3p mimic or negative control (NC) mimic. (E) Binding of miR-328-3p and lncRNA TUG1 to the argonaute 2 (Ago2) antibody determined by RNA binding protein immunoprecipitation (RIP) assay. (F) Binding between miR-328-3p and lncRNA TUG1 determined by RNA pull-down assay; BETA-TC-6 cells were transfected with miR-328-3p mimic, overexpression (oe)-lncRNA TUG1 or both. (G) Expression of lncRNA TUG1, miR-328-3p and SREBP-2 in BETA-TC-6 cells determined by RT-qPCR. (H) BETA-TC-6 cell viability measured by cell counting kit-8 (CCK-8) assay. (I) Flow cytometric examination of BETA-TC-6 cell apoptosis. (J) Total insulin content in BETA-TC-6 cells measured by enzyme-linked immunosorbent assay (ELISA). (K) Insulin secretion in BETA-TC-6 cells measured by ELISA. IgG, immunoglobulin G. aP<0.05 vs. islet cells transfected with NC mimic or BETA-TC-6 cells transfected with oe-NC+NC mimic, bP<0.05 vs. BETA-TC-6 cells transfected with oe-NC+miR-328-3p mimic (n=10 for mice following each treatment). Cell experiments were repeated three times.
After uncovering the interaction between miR-328-3p and lncRNA TUG1, we next aimed to investigate the impact of lncRNA TUG1 on islet cells via regulation of miR-328-3p. In BETA-TC-6 cells treated with oe-lncRNA TUG1, the expression of lncRNA TUG1 and SREBP-2 was upregulated while that of miR-328-3p was decreased. No changes were found in the lncRNA TUG1 expression, miR-328-3p expression was augmented and SREBP-2 expression was decreased upon miR328-3p mimic transfection. Additionally, combined transfection with oe-lncRNA TUG1 and miR-328-3p mimic resulted in elevated lncRNA TUG1 and SREBP-2 expression and downregulated miR-328-3p expression versus single miR-328-3p mimic transfection (Fig. 5G). CCK-8 detection results revealed the ability of lncRNA TUG1 overexpression to potentiate BETA-TC-6 cell viability, while miR-328-3p upregulation reduced cell viability. Simultaneous elevation of miR-328-3p reversed the lncRNA TUG1-induced suppressing effect on viability (Fig. 5H). Flow cytometry suggested that lncRNA TUG1 overexpression reduced cell apoptosis while miR-328-3p overexpression facilitated the apoptosis. Conversely, cell apoptosis was stimulated upon simultaneous elevation of miR328-3p in the presence lncRNA TUG1 (Fig. 5I). Furthermore, ELISA results showed increased total insulin content and insulin secretion in BETA-TC-6 cells overexpressing lncRNA TUG1, whereas these markers were reduced following miR-328-3p overexpression; the impact induced by lncRNA TUG1 was reversed following simultaneous enhancement of miR-328-3p (Fig. 5J and K). The aforementioned data support the notion that lncRNA TUG1 upregulated SREBP-2 by pairing to miR-328-3p, causing an increase of pancreatic β-cell viability and insulin secretion.
LncRNA TUG1 binds to miR-328-3p and facilitates SREBP-2-dependent ERK signaling pathway inactivation, thus suppressing the IR in GDM mice
At last, we attempted to characterize the effect of lncRNA TUG1 on the expression of IR in vivo. Initial RT-qPCR results illustrated an increase in the lncRNA TUG1 and SREBP-2 expression, while miR-328-3p expression was downregulated in the islet tissues of GDM mice treated with NPs expressing lncRNA TUG1 (Fig. 6A). Subsequently, FBG level was found to be diminished following lncRNA TUG1 overexpression at days 10 and 18 of gestation. The FBG level exhibited no evident alterations following lncRNA TUG1 overexpression before HFD and at day 0 of gestation (Fig. 6B). At day 18 of gestation, levels of FINS and HOMA-IR were decreased upon overexpression of lncRNA TUG1 (Fig. 6C). Moreover, OGTT showed that at 0.5 hour after oral glucose load, blood glucose level was decreased following overexpression of lncRNA TUG1 and reached a nadir, but presenting an increase at 1 to 2 hours (Fig. 6D). Overexpression of lncRNA TUG1 led to an increase of ISOGTT and IGI and a decline of HOMA-β (Supplementary Table 7), demonstrating that lncRNA TUG could increase the function of islets and relieve IR. Additionally, HE staining analysis results indicated a regular-shaped islet with slight hemorrhage, reduced number of islet cells, and vacuolar degeneration in islet tissues of GDM mice with lncRNA TUG1 overexpression (Supplementary Fig. 2D). Furthermore, TUNEL staining results showed decreased apoptosis of cells in islet tissues of GDM mice with lncRNA TUG1 overexpression (Fig. 6E). Western blot analysis results exhibited that lncRNA TUG1 overexpression could downregulate the Ras protein expression and the ERK phosphorylation level (Fig. 6F). Cumulatively, these results indicated lncRNA TUG1 could relieve IR in GDM mice by regulating the miR-328-3p/SREBP-2/ERK signaling axis.

Long non-coding RNAs (lncRNA) taurine upregulated gene 1 (TUG1) inhibits the insulin resistance in gestational diabetes mellitus (GDM) mice by regulating the miR-328-3p/sterol regulatory element binding protein 2 (SREBP-2)/extracellular signal-regulated kinase (ERK) signaling axis. (A) Expression of lncRNA TUG1, miR-328-3p and SREBP-2 in islet tissues of GDM mice overexpressing lncRNA TUG1 determined by reverse transcription-quantitative polymerase chain reaction. (B) Fasting blood glucose (FBG) levels (mM) at different periods of gestation in GDM mice overexpressing lncRNA TUG1. (C) Levels of fasting insulin (FINS) and homeostasis model assessment of insulin resistance (HOMA-IR) at day 18 of gestation in GDM mice overexpressing lncRNA TUG1. (D) Glucose area under the curve at different gestational days in GDM mice overexpressing lncRNA TUG1. (E) Apoptosis of cells in islet tissues of GDM mice overexpressing lncRNA TUG1 detected using terminal deoxynucleotidyl transferase-mediated dUTP-biotin nick-end labeling (TUNEL) staining. (F) Western blot analysis of Ras protein and ERK phosphorylation level in islet tissues of GDM mice overexpressing lncRNA TUG1. OGTT, oral glucose tolerance test. aP<0.05 vs. GDM mice injected with nanoparticles (NPs) expressing vector (n=10 for mice following each treatment).
DISCUSSION
Early stage GDM is associated with unsatisfactory pregnancy outcomes such as pre-eclampsia, premature delivery, cesarean delivery, high birth weight, and neonatal jaundice, which contribute to mortality rates for neonatal babies [28]. Therefore, developing novel targets for GDM is a matter of urgency. In the present study, we investigated the effect of lncRNA TUG1 on the IR in HFD-induced GDM mice. Our findings provided evidence that lncRNA TUG1 could competitively bind to miR-328-3p and subsequently induce upregulation of the miR-328-3p target SREBP-2 while suppressing the resultant ERK signaling pathway activation, ultimately attenuating the severity of IR in GDM mice.
Initially, our results offered evidence uncovering that miR-328-3p expression was elevated in HFD-induced GDM mice and that depletion of miR-328-3p could alleviate IR through suppression of FBG, FINS, HOMA-IR, and HOMA-β levels, accompanied with enhancement of ISOGTT and IGI levels. Impaired glucose tolerance and decreased the sensitivity of insulin in tissues are primary symptoms of diabetes mellitus [29]. Blood glucose metabolic indexes, including FBG, FINS, HOMA-IR, and HOMA-β in serum, are all closely associated with GDM [30], and are usually abnormal in GDM [31]. In addition, HOMA-β, ISOGTT, and IGI have been highlighted to be surrogate indexes associated with IR. In women with GDM, ISOGTT, and IGI present reduced scores, while increased ISOGTT and IGI levels are indicative of improved IR [32]. In comparison with children with normal weight, children with general overweight/obesity exhibit higher HOMA-β level, while its reduction contributes to enhanced insulin sensitivity [33]. Research has demonstrated that aberrant expression of miRNAs is related to IR and abnormal pregnancies, suggesting the potential of these miRNAs as pathological molecules in GDM, thus serving as noninvasive potential biomarkers for GDM [34]. miR-328 is upregulated in ED in STZ-induced diabetic rats, while the inhibition of miR-328 by antagomir or lncRNA myocardial infarction-associated transcript can improve ED [15,35]. Moreover, miR-328 has been identified as one of the miRNAs associated with cardio-metabolic risk [36], and can inhibit the expression of the insulin growth factor 1 receptor [37]. Considering the aforementioned results, we thus reasoned that miR-328-3p may be a key regulator of IR implicated in the development of GDM.
Using the dual-luciferase reporter assay, we confirmed that miR-328-3p specifically targeted SREBP-2 and negatively regulated its expression. Next, we found decreased expression of SREBP-2 in the mouse model of GDM. Moreover, restoration of SREBP-2 reduced FBG, FINS, and HOMA-IR levels in GDM mice, suggesting that SREBP-2 could ameliorate IR. Interestingly, several miRNAs such as miR-33a and miR-33b can modulate cholesterol and lipid homeostasis through collaboration with their host genes, namely SREBP transcription factors and SREBP genes [38,39]. SREBP-2 protein is associated with lipid metabolism, and also regulates abdominal fat deposition in pregnancy [40]. SREBP-2 overexpression has been shown to negate the increased body weight, high density lipoprotein cholesterol, and rescue the elevated levels of HOMA-IR and insulin elicited by high-fat, high-sucrose diets [41]. In the present study, our data suggested that enhanced miR-328-3p expression inhibited the alleviating effects of SREBP-2 on IR, suggesting that miR-328-3p induces IR through targeting SREBP-2.
Moreover, miR-328-3p was identified here to activate the ERK signaling pathway through targeting of SREBP-2. Similarly, a previously published report has demonstrated that silencing of SREBP-2 could activate the ERK signaling pathway in neurons [25]. At the same time, miR-328 has also been reported to promote the ERK signaling pathway activation in human umbilical vein endothelial cells [42]. Thus, it seems to be an established result that miR-328-3p can inhibit SREBP-2 to activate perturbation of the ERK signaling pathway in multiple tissues. Inhibition of the ERK signaling pathway improved insulin sensitivity and subsequently elevated cell viability and decreased apoptosis both in neurons and islet cells, highlighting a new strategy for the treatment of IR [43]. It has been reported that the folded protein, oxysterol-binding protein (OSBP), sensitive to cholesterol levels, can regulate ERK, and ERK phosphorylation can be inactivated by the mitogen-activated protein kinase (MAPK)/dual specific phosphatase (DUSP) family [44]. In addition, SREBP2 knockdown produces cholesterol that disrupts the ERK-DUSP-OSBP complex, thereby increasing ERK phosphorylation [45]. Therefore, it is reasonable to summarize that miR-328-3p induces IR through activation of the ERK signaling pathway by targeting SREBP-2, yet the possible mechanism relating SREBP-2 to ERK remains further investigation.
Another key observation of the current study is that lncRNA TUG1 competitively bound to miR-328-3p and abolished its inhibitory role in the SREBP-2 expression in pancreatic β-cells. LncRNAs can function as miRNA sponges, and thus attenuate their suppressive effects on their target mRNAs [46]. A previous study demonstrated that lncRNA TUG1 could function as an endogenous sponge of miR-382 and thereby upregulate the miR-382 target enhancer of zeste homolog-2 (EZH2) in pancreatic cancer cells [47]. Much in line with the present results, lncRNA TUG1 was previously detected to be downregulated in diabetes mellitus rats and in mesangial cells induced by high glucose levels; in that context upregulation of TUFG1 inhibits proliferative and fibrotic potentials of mesangial cells by inhibiting the phosphatidylinositol 3-kinase/protein kinase B (PI3K/AKT) signaling pathway [48]. Furthermore, overexpression of lncRNA TUG1 can significantly attenuate fat accumulation, body weight, serum glucose levels, and insulin tolerance in diabetic mice [49]. An adverse correlation of lncRNA TUG1 with the ERK signaling pathway has been revealed in cervical cancer [50]. These findings collectively revealed the inhibiting role of lncRNA TUG1 in the IR and the subsequent GDM progression via regulation of the miR-328-3p/SREBP-2/ERK axis.
The current study revealed that lncRNA TUG1 could suppress IR in GDM through competitive binding of miR-328-3p and inactivation of the SREBP-2-dependent ERK signaling pathway (Supplementary Fig. 5), thus laying the basis for the development of novel therapeutic targets for GDM. However, this research remains in the preclinical stage, and the mechanism involving lipid regulation and the ERK signaling pathway mentioned above is insufficiently investigated, as is the mechanism of transduction block between insulin and its receptor. Looking forward, more detailed studies on the candidate genes implicated in the control of GDM development are needed, with the ultimate goal of preventing the adverse pregnant outcomes and morbidity of metabolic diseases associated with GDM. Additionally, this study focused solely on one factor or pathway in only one tissue, which may be insufficient to support general conclusions about the role of the lncRNA TUG1/ miR-328-3p/SREBP-2/ERK axis in GDM; future studies should broaden this investigation to consider other tissue types. The hepatic gene regulation by oligos or lentiviral vectors (by tail vein injection) may potentially modulate pancreatic islet gene signatures/signaling pathways for the restoration of physiological homeostasis, and further investigations are thus required.
SUPPLEMENTARY MATERIALS
Supplementary materials related to this article can be found online at https://doi.org/10.4093/dmj.2021.0216.
Primer sequences for reverse transcription quantitative polymerase chain reaction
ISOGTT, IGI, and HOMA-β levels in the control and GDM mice
ISOGTT, IGI, and HOMA-β levels in the GDM mice following different treatments
Interaction nodes in the gene interaction network
ISOGTT, IGI, and HOMA-β levels in the GDM mice following different treatments (n=10)
Localization of lncRNA TUG1 in human and mouse cells
ISOGTT, IGI, and HOMA-β levels in the GDM mice following different treatments
A schematic diagram of the timeline of the experiments. LFD, low-fat diet; HFD, high-fat diet; FBG, fasting blood glucose; WB, Western blot; qPCR, quantitative polymerase chain reaction; HE, hematoxylin-eosin; IHC, immunohistochemistry; TUNEL, deoxynucleotidyl transferase-mediated dUTP-biotin nick-end labeling; FINS, fasting insulin; OGTT, oral glucose tolerance test; NP, nanoparticle.
Hematoxylin-eosin (HE) staining highlights pathological changes in the islet tissues of gestational diabetes mellitus (GDM) mice following different treatments. (A) Pathological changes of islet tissues in control and GDM mice observed using HE staining. (B) Pathological changes of islet tissues in GDM mice injected with nanoparticles (NPs) expressing negative control (NC) inhibitor or miR-328-3p inhibitor observed using HE staining. (C) Pathological changes of islet tissues in GDM mice injected with NPs expressing miR-328-3p mimic, overexpression (oe)-sterol regulatory element binding protein 2 (SREBP-2) or both observed using HE staining. (D) Pathological changes of islet tissues in GDM mice overexpressing long noncoding RNAs (lncRNA) taurine upregulated gene 1 (TUG1) observed using HE staining.
Kyoto Encyclopedia of Genes and Genomes (KEGG) enrichment analysis of highly expressed and conserved miRNA target genes using the mirPATH tool in the DIANA database.
Expression of miR-328-3p and sterol regulatory element binding protein 2 (SREBP-2) in mouse islet tissues. (A) miR-328-3p expression detected by reverse transcription-quantitative polymerase chain reaction (RT-qPCR) in mouse islet tissues in the gestational diabetes mellitus (GDM) mice treated with nanoparticles (NPs) expressing miR-328-3p inhibitor. (B) miR-328-3p and SREBP-2 expression detected by RT-qPCR in islet tissues of GDM mice treated with NPs expressing miR- 328-3p mimic. (C) miR-328-3p and SREBP-2 expression detected by RT-qPCR in islet tissues of GDM mice treated with NPs expressing overexpression (oe)-SREBP-2. NC, negative control. aP<0.05 vs. GDM mice injected with NPs expressing NC inhibitor, NC mimic, or oe-NC (n=10 for mice following each treatment).
Schematic diagram of the mechanism by which long non-coding RNAs (lncRNA) taurine upregulated gene 1 (TUG1) affects gestational diabetes mellitus (GDM). LncRNA TUG1 competitively binds to miR-328-3p, causing the upregulation of the miR-328-3p target sterol regulatory element binding protein 2 (SREBP-2), thus suppressing the activation of the extracellular signal-regulated kinase (ERK) signaling pathway. By this mechanism, lncRNA TUG1 reduces insulin resistance in GDM mice. AGO2, argonaute 2.
Notes
CONFLICTS OF INTEREST
No potential conflict of interest relevant to this article was reported.
AUTHOR CONTRIBUTIONS
Conception or design: X.T., Q.Q.
Acquisition, analysis, or interpretation of data: W.X., X.Z.
Drafting the work or revising: X.T., Q.Q.
Final approval of the manuscript: X.T., Q.Q. W.X., X.Z.
FUNDING
This work was supported by Scientific Research Project of Traditional Chinese Medicine Bureau of Guangdong Province (20201253).
Acknowledgements
None