Temporal Changes in Resting Heart Rate and Risk of Diabetes Mellitus
Article information

Abstract
Background
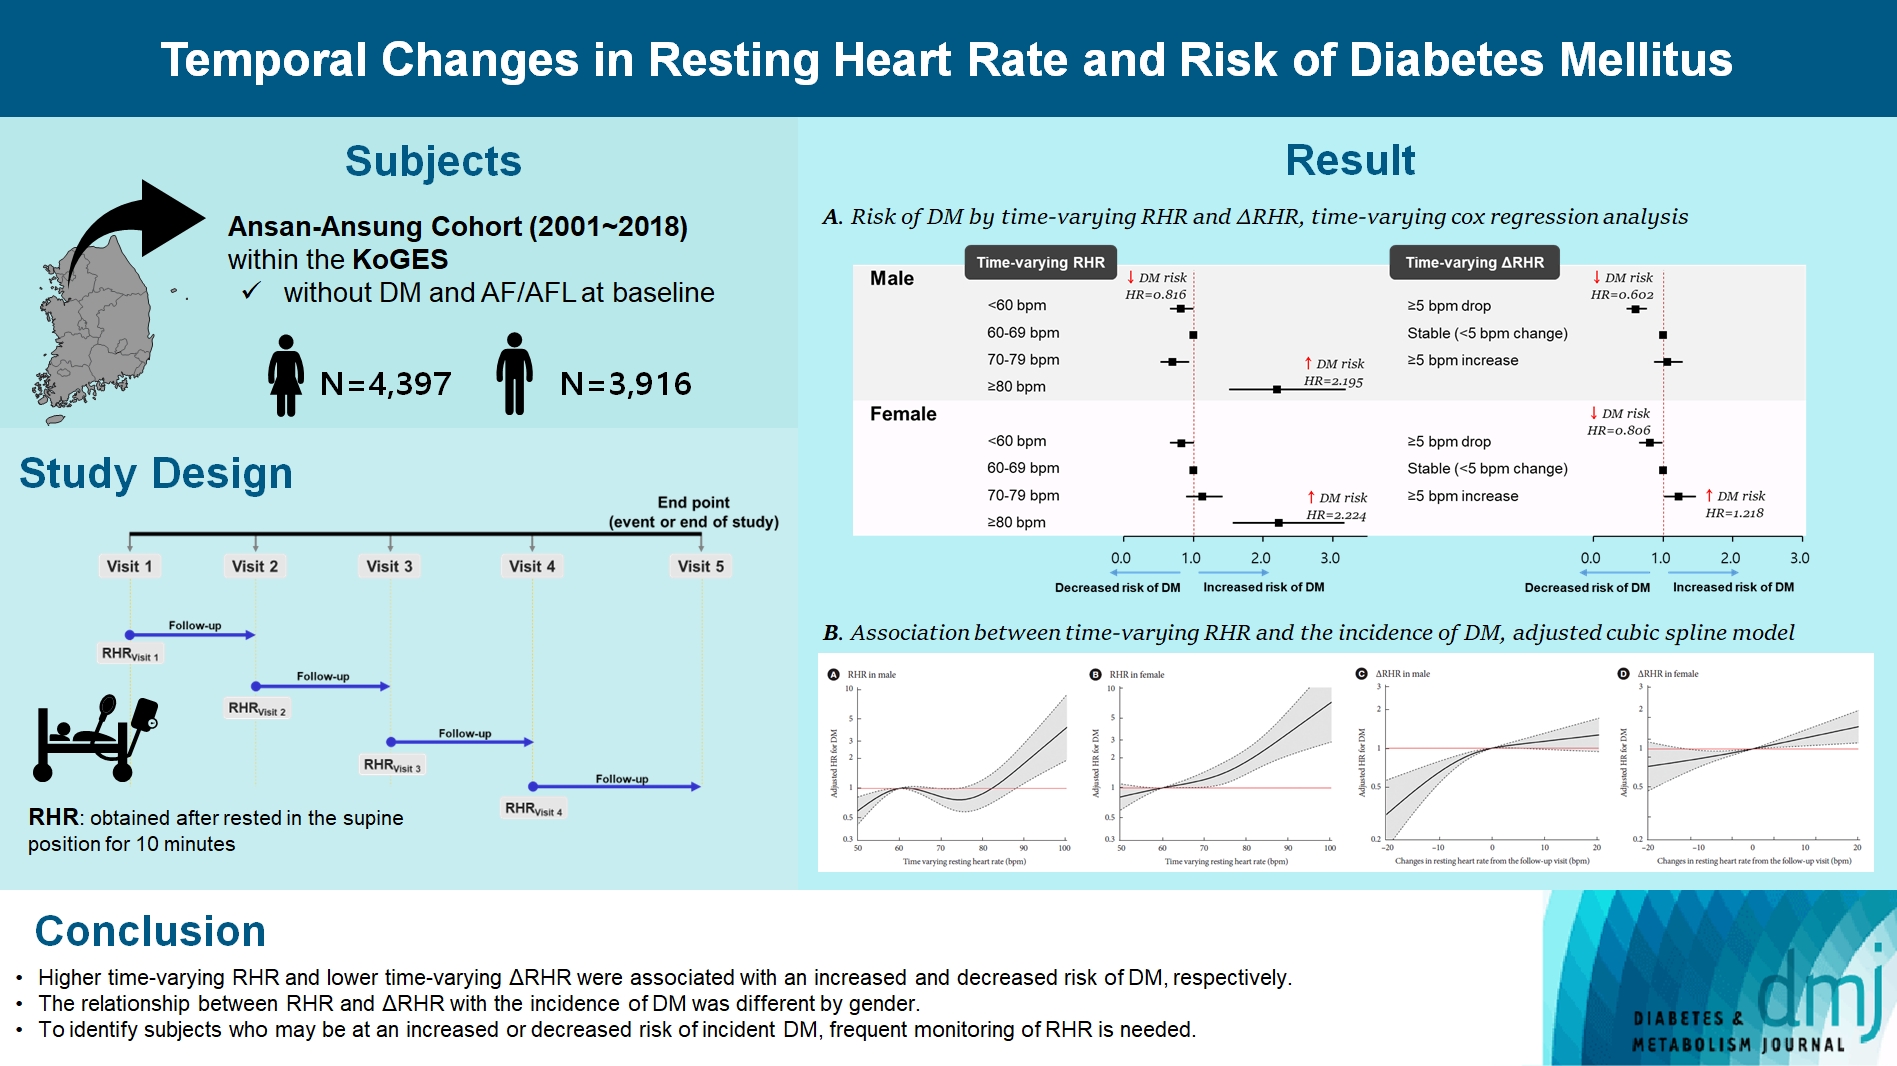
To investigate the association between the time-varying resting heart rate (RHR) and change in RHR (∆RHR) over time and the risk of diabetes mellitus (DM) by sex.
Methods
We assessed 8,313 participants without DM or atrial fibrillation/flutter from the Korean Genome and Epidemiology Study, a community-based prospective cohort study that was initiated in 2001 to 2002. The participants were followed up until December 31, 2018. Updating RHR with biennial in-study re-examinations, the time-varying ∆RHR was calculated by assessing the ∆RHR at the next follow-up visit.
Results
Over a median follow-up of 12.3 years, 1,345 participants (16.2%) had DM. As compared with RHR of 60 to 69 bpm, for RHR of ≥80 bpm, the incidence of DM was significantly increased for both male and female. A drop of ≥5 bpm in ∆RHR when compared with the stable ∆RHR group (–5< ∆RHR <5 bpm) was associated significantly with lower risk of DM in both male and female. However, an increase of ≥5 bpm in ∆RHR was significantly associated with higher risk of DM only in female, not in male (hazard ratio for male, 1.057 [95% confidence interval, 0.869 to 1.285]; and for female, 1.218 [95% confidence interval, 1.008 to 1.471]).
Conclusion
In this community-based longitudinal cohort study, a reduction in ∆RHR was associated with a decreased risk of DM, while an increase in ∆RHR was associated with an increased risk of DM only in female.
Highlights
• Time-varying RHR ≥80 bpm was found to be strongly related to the risk of incident DM.
• A decrease in RHR of ≥5 bpm was associated with a lower risk of developing DM.
• A decrease in RHR was significantly associated with a reduced risk of DM only in men.
• An increase in RHR was significantly associated with a increased risk of DM only in women.
• RHR may be a useful and easily measured biomarker for DM risk detection.
INTRODUCTION
Diabetes mellitus (DM) is a leading cause of disability and mortality [1,2]. It is a public health problem worldwide, with prevalence in adults aged 20 to 79 years expected to approach 9.3% (approximately 578 million) by 2030, and is projected to be the seventh leading cause of death by 2030 [3,4]. Thus, identification of groups at high risk for developing DM is urgently needed to better understand and prevent this public health epidemic.
Resting heart rate (RHR) is regulated by the autonomic nervous system (ANS) [5]. It is now possible to continuously and accurately self-measure RHR using a mobile phone or watch bracelet, such that monitoring RHR has become very popular in the general population [6]. Therefore, there is an opportunity for RHR to be used for chronic disease prevention in healthy adults if the clinical significance of RHR can be understood. Many previous studies have reported that a high RHR is associated with an increased risk of DM [7-9]. RHR may change over time due to environmental factors such as physical activity or clinical conditions; however, few studies have assessed serial measurements of RHR over time [10]. Furthermore, RHR is slightly higher in female than in male [11]. However, only a few previous studies have explored the correlation of RHR with DM by sex [12]. Thus, the association between RHR and DM is not fully understood in the general population.
Therefore, the objective of this analysis was to determine whether RHR and temporal changes in RHR (∆RHR) are useful risk markers for the development of DM in individuals who do not have DM. We also assessed by sex the association between DM and time-varying RHR and ∆RHR using repeated RHR measurements.
METHODS
Data source and study population
The Ansan-Ansung Cohort Study within the Korean Genome and Epidemiology Study (KoGES) is an ongoing prospective cohort started in 2001 to 2002. Participants are followed biennially through face-to-face visits, where information on sociodemographics, lifestyle factors, medical history, and anthropometric measures as well as blood and urine tests are collected by trained interviewers and staff using standard methods and protocols [13].
Initially, the cohort comprised 10,030 participants (5,010 from a farming community in the Ansung cohort and 5,020 from an industrial community in the Ansan cohort) aged 40 to 69 years old between 2001 and 2002. Biennial follow-up examinations were conducted in 2018. All the participants provided written informed consent. The study protocol was approved by the Institutional Review Board of Korea Centers for Disease Control and Prevention (approval No. 2021-04-02-2C-A). All research procedures were performed in accordance with relevant guidelines and regulations.
Participants were excluded if they had DM at baseline (n=826), atrial fibrillation or flutter at baseline (n=40), were lost to follow-up (n=840), or were missing heart rate information from the baseline examination (n=11). Finally, this study included 8,313 participants.
RHR and calculation of changes in RHR
At every visit, the RHR was obtained, after participants had rested in the supine position for 10 minutes, by well-trained specialists who measured the radial artery pulse over 1 minute using an automatic blood pressure monitor (FT-500, Jawon Medical Co. Ltd., Gyeongsan, Korea). As the RHR can vary over time, we created a time-varying RHR using each available study visit over the course of the study, so that all longitudinal study visit data were incorporated. That is, we used data from visits one to eight such that the RHR was updated up to seven times after the baseline for each participant. To assess ∆RHR, we calculated ∆RHR to the next follow-up visit by subtracting the time-varying RHR value at each biennial visit from the value at the next follow-up visit (Supplementary Fig. 1). Patients missing RHR information at each visit and those whose RHR measurements were from a visit when atrial fibrillation/flutter was electrocardiographically confirmed were not included in the analysis.
Outcome
The primary outcome was the incidence of DM, defined as a fasting serum glucose concentration of ≥126 mg/dL, post 2-hour glucose after a 75 g oral glucose tolerance test of ≥200 mg/dL, glycosylated hemoglobin ≥6.5%, current antidiabetic treatment, or DM-related death. Mortality data for the participants were obtained from the National Death Records. The participants were followed until the index date—the date of DM incidence, DM-related death, or the last interview before the end of the study period on December 31, 2018, whichever came first.
Statistical analysis
The characteristics of the study population were described as frequency (percentage) for categorical variables and mean±standard deviation (SD) for continuous variables. The incidence rate of DM was reported as the number of patients per 1,000 person-years.
To assess the association of longitudinal RHR and ∆RHR measures with incident DM, the time-varying Cox proportional hazards model, which is an extension of the widely used traditional Cox proportional hazards model, was used (Supplementary Tables 1 and 2, Supplementary Fig. 1). Although this method is usually used to focus on short-term effects, it provides better accuracy for assessing the relationship between RHR and DM than use of a single measurement that is fixed at the baseline [14,15]. Analyses of the association between time-varying RHR and time-varying ∆RHR with the risk of DM were adjusted for all variables in Table 1 and for time-varying ∆RHR and time-varying RHR, respectively. All variables in Table 1 could be treated as time-varying since they were assessed and obtained at every visit. The results are presented as hazard ratios (HRs) with 95% confidence intervals (CIs), using subjects with an RHR of 60 to <70 bpm as a reference. In addition, an adjusted model using a restricted cubic spline with five knots was constructed to display the association between the hazards of developing the outcome and the continuous covariates of the time-varying RHR using a reference value of 60 bpm, as previously reported [16-18]. For ∆RHR, 0 was used as the reference.

Characteristics of participants at visits 1–8
Mixed-effects regression models were used for RHR and ∆RHR trajectories in female and male, respectively, with time before incident DM or last examination used as the common timescale for all analyses. We used repeated RHR measures to fit the mixed-effects linear regression models, with each RHR measure as the outcome, participant identification as random intercepts, and time as a fixed effect expressed using restricted cubic splines with four knots to allow for nonlinear relationships. The mean values were estimated for each RHR measure over the time range of –15 to 0 years for female and male. Mixed-effects regression models were adjusted for the covariates listed in Table 1.
All statistical tests were 2-sided and P<0.05 was accepted as statistical significance. All analyses were performed using SAS version 9.4 (SAS Institute, Cary, NC, USA).
RESULTS
The characteristics of the study participants during visits 1–8 are presented in Table 1. The mean age of the cohort at baseline (visit 1) was 51.9 years, and 4,397 (52.9%) participants were female. During the follow-up period (mean, 12.3 years; range, 1.4 to 16.6 years), there was an increase in prevalence of hypertension (29.3% to 41.6%), cardiovascular disease (CVD; 2.7% to 5.0%), and chronic kidney disease (6.8% to 12.0%). Of the 8,313 subjects without DM, 1,345 (16.2%) developed DM. Their starting mean±SD value of RHR was 63.5±7.3 bpm compared to 62.8±7.4 bpm at the last visit.
Trajectory of RHR and ∆RHR according to the incidence of DM
According to the distribution of RHR from following visit, both male and female showed that RHR values were more frequently observed in individuals with incidence of DM (Supplementary Fig. 2A). The ∆RHR appeared to exhibit a similar distribution between male with and without incident DM, while in female, a slightly greater increase in RHR was observed in those with incident DM (Supplementary Fig. 2B). Fig. 1 shows the estimated trajectories of RHR and ∆RHR before the incidence of DM or last examination. The estimated mean RHR from 15 years before the incidence of DM was approximately 1 bpm higher in male and 1.5 bpm higher in female with incident DM compared to those without DM (Fig. 1A and B). However, the predicted mean ∆RHR in subjects with and without incident DM was similar both in male and female, respectively (Fig. 1C and D).

Trajectories of resting heart rate (RHR) before incident diabetes mellitus (DM) or last examination. Fitted lines denote mean RHR (incident DM vs. without incident DM), calculated from restricted cubic spline of mixed-effects linear regression models. Time 0=diagnosis or last examination. The dashed lines delimit the 95% confidence interval. (A) Time-varying RHR and DM in male. (B) Time-varying RHR and DM in female. (C) Time-varying change in RHR (∆RHR) and DM in male. (D) Time-varying ∆RHR and DM in female.
Association of time-varying RHR and ∆RHR with incidence of DM by sex
In fully adjusted time-varying Cox analysis (Table 2, Supplementary Tables 3 and 4), compared to participants with time-varying RHR 60 to 69 bpm, those with time-varying RHR ≥80 bpm had higher risk of DM both in male and female (HR in male and female, 2.195 [95% CI, 1.514 to 3.183] and 2.224 [95% CI, 1.562 to 3.165], respectively), and those with time-varying RHR <60 bpm had lower risk of DM in male, but not in female (HR in male and female, 0.816 [95% CI, 0.667 to 0.997] and 0.819 [95% CI, 0.665 to 1.010], respectively). In subgroup analysis, these patterns were significant in male without antihypertensive drug use and CVD, and in female with and without antihypertensive drug use, without CVD and who had body mass index (BMI) <23 kg/m2 (Fig. 2). Whereas, time-varying RHR <60 bpm also had significantly lower risk of DM in female without antihypertensive drug use and who had BMI ≥23 kg/m2.

Risk of diabetes mellitus by time-varying RHR and ΔRHR, time-varying Cox regression analysis

Subgroup analysis for the risk of diabetes mellitus according to the resting heart rate (RHR). Adjusted for sex, area, and time-updated age, body mass index (BMI), physical activity, smoking, drinking, systolic blood pressure, antihypertensive drug use, chronic kidney disease, cardiovascular disease (CVD), glycosylated hemoglobin, total cholesterol, and change in RHR. HR, hazard ratio; CI, confidence interval.
Compared with a stable change in RHR (∆RHR <5 bpm change), a decrease in RHR more than 5 bpm was associated with lower DM risk in both male and female, whereas an increase in RHR more than 5 bpm was associated with higher DM risk only in female (HR for ∆RHR ≥5 bpm drop in male and female, 0.602 [95% CI, 0.471 to 0.770] and 0.806 [95% CI, 0.651 to 0.998], respectively; HR for ∆RHR ≥5 bpm increase in female, 1.218 [95% CI, 1.008 to 1.471]). In subgroup analysis, a ∆RHR ≥5 bpm drop was associated with lower DM risk in male without antihypertensive drug use and CVD and who had BMI <23 kg/m2, and in female without CVD and who had BMI ≥23 kg/m2. A ∆RHR ≥5 bpm increase was associated with higher DM risk in female without antihypertensive drug use and CVD, and who had BMI ≥23 kg/m2 (Fig. 3).

Subgroup analysis for the risk of diabetes mellitus according to the change in resting heart rate (∆RHR). Adjusted for sex, area, and time-updated age, body mass index (BMI), physical activity, smoking, drinking, systolic blood pressure, antihypertensive drug use, chronic kidney disease, cardiovascular disease (CVD), glycosylated hemoglobin, total cholesterol, and RHR. HR, hazard ratio; CI, confidence interval.
When stratified by time-varying RHR (Supplementary Table 5), in male with time-varying RHR 70 to 79 bpm, a ∆RHR ≥5 bpm drop was significantly associated with lower risk of DM (HR, 0.569; 95% CI, 0.347 to 0.933) compared to male with a stable ∆RHR. In female with time-varying RHR <60 bpm, a ∆RHR ≥5 increase was significantly associated with higher risk of DM (HR, 1.296; 95% CI, 1.005 to 1.672) compared to those with a stable ∆RHR. A ∆RHR ≥5 drop and increase were also significantly associated with lower (HR, 0.681; 95% CI, 0.499 to 0.928) and higher (HR, 1.324; 95% CI, 1.049 to 1.670) risk of DM in female with time-varying RHR 60 to 69 bpm, respectively.
The restricted cubic spline model showed a relationship between the time-varying RHR/∆RHR and incident DM (Fig. 4). We found that a time-varying RHR of <60 bpm was associated with a lower risk of incident DM than a time-varying RHR of 60 bpm in male, not in female (Fig. 4A and B). Time-varying RHR values above 89 and 70 bpm relative to 60 bpm were associated with an increased risk of incident DM in male and female, respectively. An increase in RHR was significantly associated with an increased risk of incident DM in female but not in male (Fig. 4C and D).
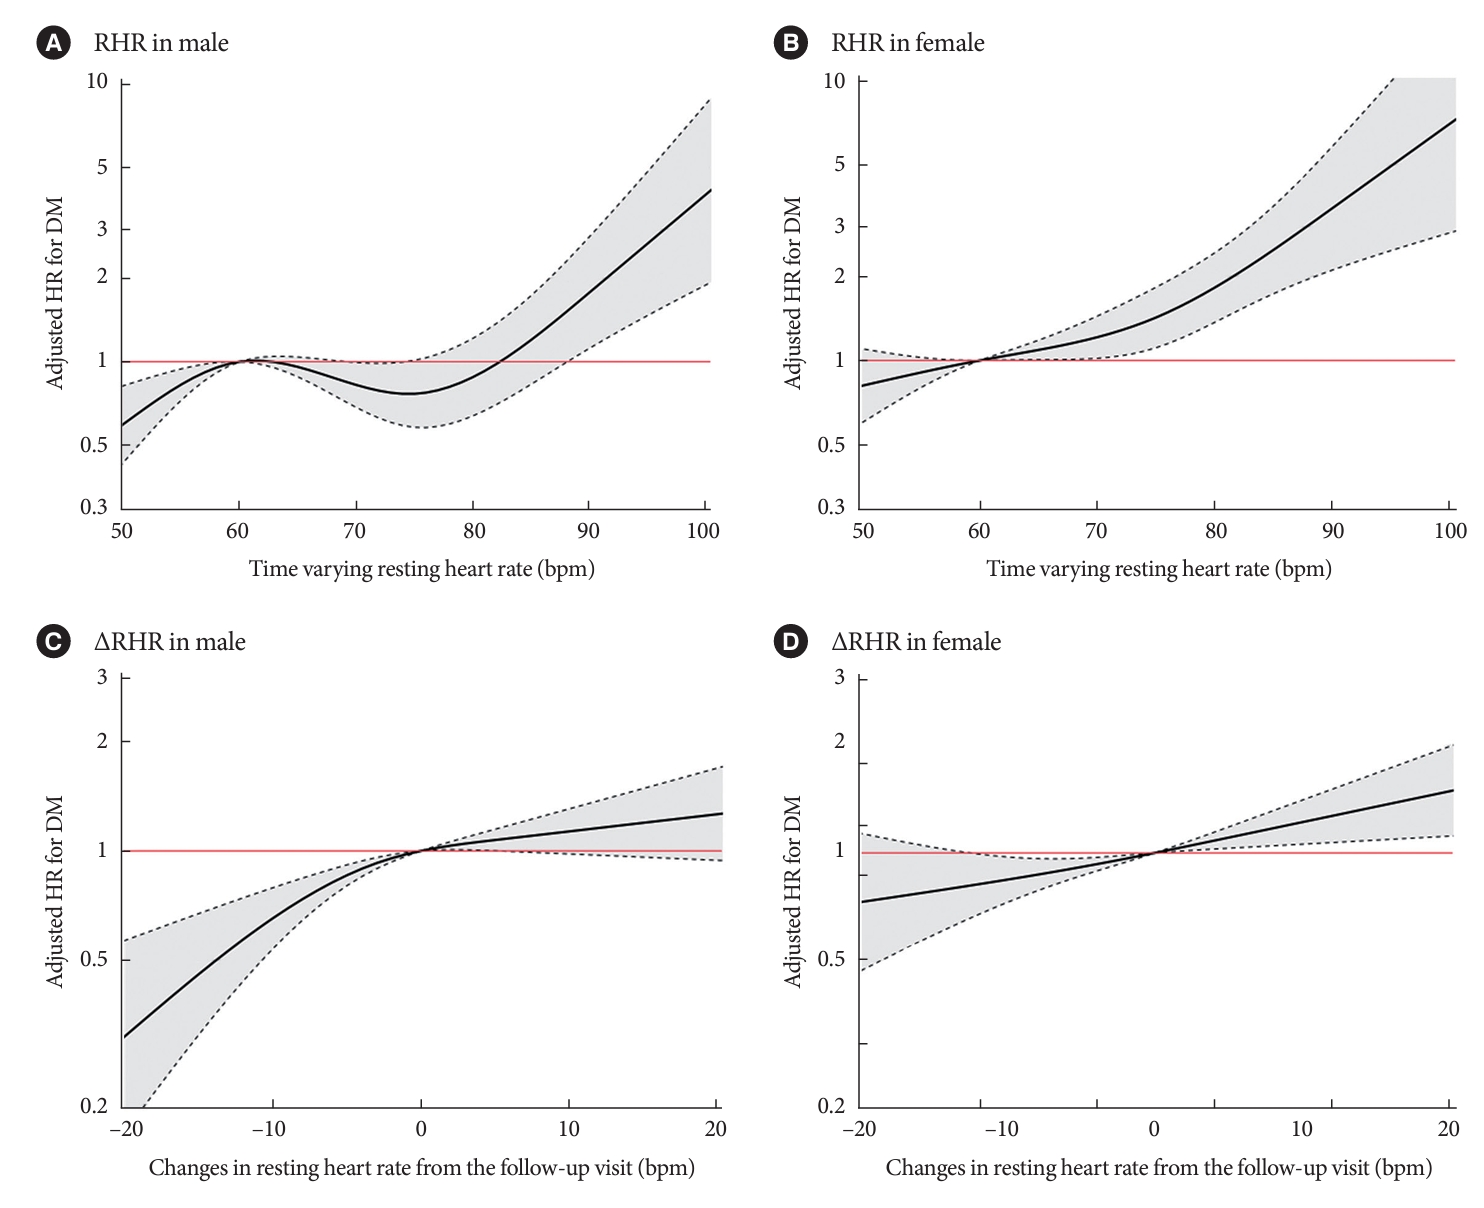
Association between resting heart rate (RHR) and the incidence of diabetes mellitus (DM). The adjusted cubic spline model demonstrates the flexible association between time-varying RHR, including all available RHR values before an event or end of the study, and the hazard of DM incidence overall (A), in male (B), and in female (C) with 60 bpm taken as the reference RHR. The adjusted cubic spline model demonstrates the flexible association between time-varying change in RHR (∆RHR) from the follow-up visit and the hazard of DM incidence overall (D) when a RHR change of 0 bpm is taken as the reference. The dashed black curves represent the upper and lower 95% confidence limits. The horizontal red line represents the hazard ratio (HR) of 1.
DISCUSSION
This study demonstrates the sex-specificity of the RHR and DM risk. In this community-based prospective cohort study of middle-aged and older adults without DM at baseline, we found that RHR ≥80 bpm, as a time-varying factor, was found to be strongly related to the risk of DM. A ∆RHR ≥5 bpm drop was associated with lower DM risk. However, when stratified by sex, decrease in RHR was significantly associated with decreased risk of DM only in male, and increase in ∆RHR was significantly associated with increased risk of DM only in female.
A novel aspect of our study includes the use of the time-varying models; to our knowledge, this approach has not been used by any previous study assessing the association between RHR or ∆RHR and DM in general population. RHR and other factors such as lifestyle, physical activity, and clinical conditions may change over time. However, previous studies relied on RHR measurements single points in time and have consistently linked elevated RHR with an increased risk of DM [7-9]. Additionally, we used a traditional Cox proportional hazards model to identify the long-term effects of fixed baseline risk factors and short-term effects of a fixed last measurement (the most recent RHR) before the index date (Supplementary Fig. 3). We also found similar results in baseline model to previous studies (HR per 5 bpm increase, 1.046; 95% CI, 1.006 to 1.086) (Supplementary Table 6). However, considering that the RHR changes over time, the results of our analysis using the most recent RHR before the index date confirmed that the linear relationship between the RHR and DM was no longer significant, indicating that a U- or J-shaped relationship between the RHR and DM is possible (Supplementary Table 6). Few epidemiological studies have evaluated longitudinal changes in RHR with the risk of DM using repeated assessments of RHR [9]. However, these studies used only two time points (start and end time). Exposure and/or confounding factor changes over time generally lead to regression dilution bias, resulting in underestimation of the true association between exposure and outcome [19]. It could be addressed by performing time-varying analysis [20]. Our study population has been biennially evaluated. Thus, we assessed the associations of RHR and ∆RHR with DM during up to 14 years of follow-up by including these longitudinal repeated measurements of RHR and covariates as time-varying variables. Our findings showed that a higher RHR was associated with increased risk. Although the underlying mechanisms are yet to be fully elucidated, several biological mechanisms have been suggested to be associated with RHR and DM. RHR is a crude index of ANS status, and an elevated RHR may reflect an ANS imbalance favoring sympathetic activation [7]. Sympathetic over-activity has been linked to reduced insulin sensitivity, high blood pressure, obesity, subclinical inflammation, and metabolic syndrome [21-24], all of which are known to be associated with the risk of DM. Higher RHRs have also been linked to increased sympathetic nervous system activity which may increase both acute and chronic insulin resistance, thereby inducing DM [25,26]. In contrast, a decrease in RHR may reflect improved cardiac function, physical fitness, and a lower sympathetic tone [27].
A novel finding in our study was that the relationship between time-varying RHR and ∆RHR with incidence of DM was different according to the sex, which was not shown in any previous study. In our study, RHR was slightly higher (approximately 1 bpm) in female than in male, and the ∆RHR showed patterns in which RHR increased with increasing age only in female with incident DM (Supplementary Fig. 4). Few studies have assessed the relationship between RHR and risk of DM by sex [12]. In previous study, the risk of type 2 diabetes mellitus (T2DM) was increased with increasing RHR and decreased with decreasing RHR in both male and female [12]. While the reason for these differing results by sex is not clear, we speculate on a few possibilities. One possibility is related to adipose tissue, which is known as an immune organ releasing various immunomodulatory substances such as tumor necrosis factor-α, interleukin 6, leptin, resistin and adiponectin, serving as a notable origin of inflammatory signals associated with insulin resistance [28]. Especially, leptin is associated with increased heart rate and sympathetic activity [29,30]. High leptin concentrations are directly associated with the obesity subsequent development of metabolic disease sequelae such as insulin resistance, T2DM, and CVD [31]. Previous study showed that leptin was significantly higher in female than male [32]. In addition, female had significantly lower sympathetic tone compared to male [33], and were found to have lower resting sympathetic nerve activity to muscles than male, especially in younger than 50 years of age [34]. As expected, heart rate variability (HRV) indices vary across the menstrual cycle in healthy female, and ANS reactivity is different across phases [35,36]. Hence, sex differences in the ANS may play a role. Another potential explanation for sex-specific differences could be attributed to the characteristics of our study population. In male, the group with ∆RHR ≥5 increase showed a trend of higher DM risk compared to those with stable ∆RHR, although the statistical significance was not achieved. Notably, in male with time-varying RHR <60 bpm, there was a relatively high frequency (48.2%) of observations with an RHR increase of ≥5 bpm and the incidence of DM was comparatively low in this group (3.72% vs. 4.50% in male and female, respectively) (Supplementary Table 7). Hence, with a larger sample size, statistical significance might be achieved. Additionally, we found that male with a time-varying RHR 70 to 79 bpm had a lower risk of DM compared to reference group. However, upon subgroup analysis, the significance was observed in male without CVD and with a BMI <23 kg/m2. Thus, it is hypothesized that relatively healthy male without CVD and with a normal BMI may have additional protective effects against DM, even if their RHR falls within the range of 70 to 79 bpm, which is slightly higher than the reference group. As a result, our findings suggest that monitoring RHR over time may be useful in identifying groups at high risk for DM.
This study had some limitations. First, changes in the RHR were only assessed biennially; therefore, further studies measuring heart rate at shorter intervals should prove useful. Second, the use of heart rate-limiting drugs such as β-blockers, which are the most frequently used drugs for the treatment of hypertension, is a possible explanation for the reduction in RHR from visit to visit; thus, HRV may have more impact than ∆RHR over time. Unfortunately, we could not obtain information regarding HRV and the use of β-blockers from the KoGES data. However, in Korea, the treatment rate of β-blockers was found to be relatively low (18.5%) [37]. Additionally, subgroup analysis in subjects without the use of antihypertensive drugs and CVD was conducted, and similar patterns were found in these groups. Another factor that may play a role in the ∆RHR over time is physical activity [38]. Thus, we also controlled for physical activity using a time-varying analysis.
Nevertheless, our study has several strengths. First, we used a large homogeneous population based on a well-designed 14-year longitudinal database. Second, time-varying models that used serial measurements of risk factors as determinants of subsequent survival were used.
In a prospective longitudinal cohort study, time-varying RHR and ∆RHR were associated with the risk of DM, and higher time-varying RHR and lower time-varying ∆RHR were associated with an increased and decreased risk of DM, respectively. In addition, the relationship between RHR and ∆RHR with incidence of DM were different by gender; lower RHR was associated with decreased risk of DM in male, and higher ∆RHR was associated with increased risk of DM in female. Our findings support the importance of frequent monitoring of RHR and the identification of changes over time to identify subjects who may be at an increased and/or decreased risk of incident DM.
SUPPLEMENTARY MATERIALS
Supplementary materials related to this article can be found online at https://doi.org/10.4093/dmj.2023.0305.
Example of the study
Data structures for modeling, analysis for time-varying Cox regression
Risk of diabetes mellitus for time-varying resting heart rate by univariate and multivariate time-varying Cox regression analysis in male
Risk of diabetes mellitus for time-varying resting heart rate by univariate and multivariate time-varying Cox regression analysis in female
Adjusted hazard ratio (95% confidence interval) for diabetes mellitus based on changes in the resting heart rate
Association between resting heart rate incidence of diabetes mellitus
Observation rate of diabetes mellitus incident according to the time-varying RHR and ∆RHR
Design for the analysis using time-varying resting heart rate (RHR) and change in RHR (∆RHR).
Distribution of time-varying (A) resting heart rate (RHR) and (B) change in RHR (∆RHR) in subjects with and without incident diabetes mellitus (DM) by sex.
Design for the Cox proportional hazards regression analysis using baseline and the most recent resting heart rate (RHR).
Trajectories of resting heart rate (RHR) according to the age in subjects with and without incident diabetes mellitus (DM). Fitted lines denote mean RHR (incident DM vs. without incident DM), calculated from restricted cubic spline of mixed-effects linear regression models. The dashed lines delimit the 95% confidence interval. (A) Time-varying RHR and DM in male. (B) Time-varying RHR and DM in female. (C) Time-varying change in RHR (∆RHR) and DM in male. (D) Time-varying ∆RHR and DM in female.
Notes
CONFLICTS OF INTEREST
No potential conflict of interest relevant to this article was reported.
AUTHOR CONTRIBUTIONS
Conception or design: M.K.S., H.Y.P.
Acquisition, analysis, or interpretation of data: M.K.S.
Drafting the work or revising: K.L., H.Y.P.
Final approval of the manuscript: all authors.
FUNDING
This research was supported by the National Institute of Health research project (2021-NI-015-02).
Acknowledgements
Data used in this study were obtained from the Korean Genome and Epidemiology Study (KoGES 4851-302) of the Korea National Institute of Health, Republic of Korea. The authors wish to thank the participants and staff of the KoGES.