Association of Measures of Glucose Metabolism with Colorectal Cancer Risk in Older Chinese: A 13-Year Follow-up of the Guangzhou Biobank Cohort Study-Cardiovascular Disease Substudy and Meta-Analysis
Article information

Abstract
Background
Abnormal glucose metabolism is a risk factor for colorectal cancer (CRC). However, association of glycosylated hemoglobin (HbA1c) with CRC risk remains under-reported. We examined the association between glycemic indicators (HbA1c, fasting plasma glucose, fasting insulin, 2-hour glucose, 2-hour insulin, and homeostasis model of risk assessment-insulin resistance index) and CRC risk using prospective analysis and meta-analysis.
Methods
Participants (n=1,915) from the Guangzhou Biobank Cohort Study-Cardiovascular Disease Substudy were included. CRC events were identified through record linkage. Cox regression was used to assess the associations of glycemic indicators with CRC risk. A meta-analysis was performed to investigate the association between HbA1c and CRC risk.
Results
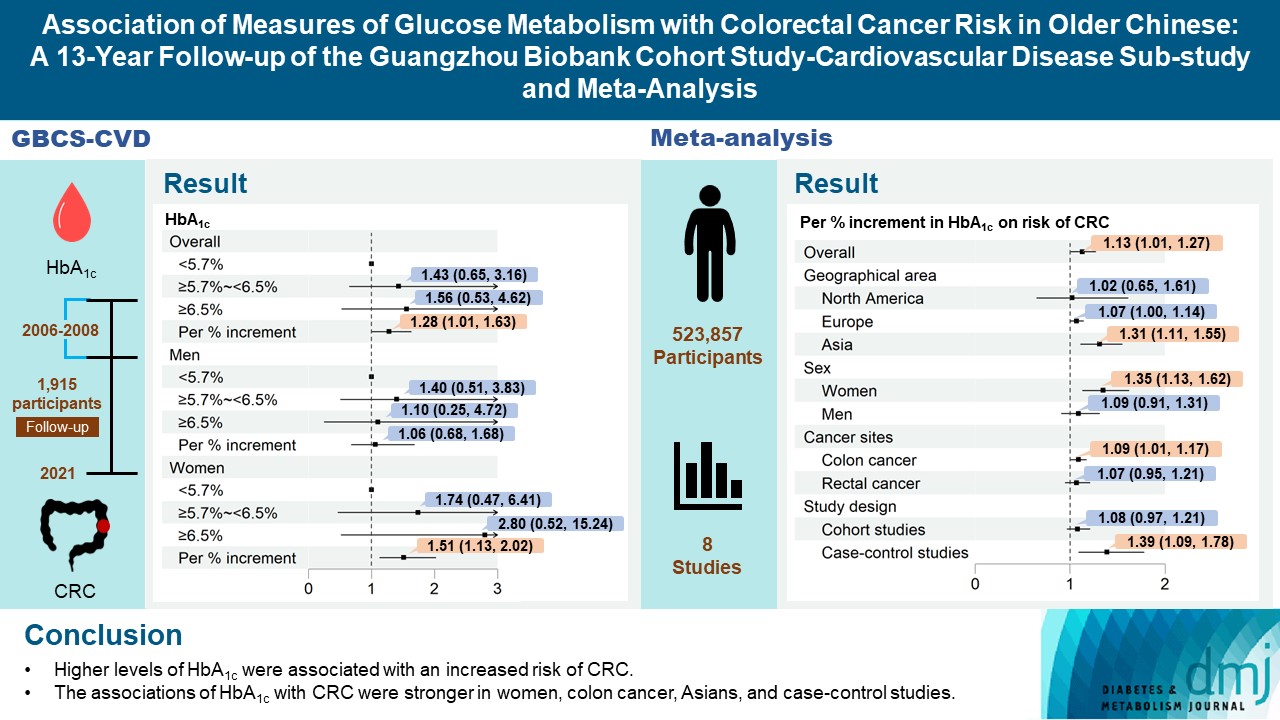
During an average of 12.9 years follow-up (standard deviation, 2.8), 42 incident CRC cases occurred. After adjusting for potential confounders, the hazard ratio (95% confidence interval [CI]) of CRC for per % increment in HbA1c was 1.28 (95% CI, 1.01 to 1.63) in overall population, 1.51 (95% CI, 1.13 to 2.02) in women and 1.06 (95% CI, 0.68 to 1.68) in men. No significant association of other measures of glycemic indicators and baseline diabetes with CRC risk was found. Meta-analyses of 523,857 participants including our results showed that per % increment of HbA1c was associated with 13% higher risk of CRC, with the pooled risk ratio being 1.13 (95% CI, 1.01 to 1.27). Subgroupanalyses found stronger associations in women, colon cancer, Asians, and case-control studies.
Conclusion
Higher HbA1c was a significant predictor of CRC in the general population. Our findings shed light on the pathology of glucose metabolism and CRC, which warrants more in-depth investigation.
INTRODUCTION
Colorectal cancer (CRC) is one of the most common cancers globally, ranking third in terms of incidence and second in terms of mortality [1]. The incidence of CRC has been increasing over recent decades in low- and middle-income countries including China [2], where the incident cases accounted for 28.8% of cases in the world in 2020 [3]. Identifying modifiable risk factors for CRC may enable effective primary prevention strategies to mitigate the rising burden.
Hyperglycemia may lead to DNA damage through oxidative stress induced by mitochondrial glucose oxidation [4]. In addition, insulin resistance and hyperinsulinemia may stimulate cancer cell proliferation and metastasis [5]. Higher fasting plasma glucose (FPG) was also associated with a higher risk of CRC [6], although the assessment of hyperglycemia using FPG only would lead to underestimation of hyperglycemia (i.e., individuals with impaired glucose tolerance could not be identified) [7].
Glycosylated hemoglobin (HbA1c) reflects average blood glucose levels over the past 12 weeks, which is less likely to be affected by sample storage, transportion or day to day variations, and can serves as an alternative glycemic measure [8]. However, the association between HbA1c and the risk of CRC was inconclusive. A meta-analysis based on mostly Western populations showed that higher HbA1c was significantly associated with higher CRC risk, despite no significant association for a meta-analysis of cohort studies [6]. As the use of different glycemic measures may identify individuals with different types of glucose metabolism and result in different estimates of diabetes prevalence [7], assessment of various glycemic indicators may provide valuable insights into etiology of CRC. Therefore, the current study aimed to examine the association between HbA1c and the risk of CRC using data from the Guangzhou Biobank Cohort Study-Cardiovascular Disease Substudy (GBCS-CVD). Moreover, to comprehensively explore the associations of glucose metabolism and CRC, other glycemic measures including FPG, fasting insulin, 2-hour glucose, 2-hour insulin and homeostasis model of risk assessment-insulin resistance (HOMA-IR) index were also analyzed. On the basis of the findings, a meta-analysis of the association between HbA1c and risk of CRC was performed to provide up-to-date evidence on the association between HbA1c and CRC.
METHODS
Study participants
The GBCS is a three-way collaboration between the Guangzhou Twelfth People’s Hospital and the Universities of Hong Kong and Birmingham. GBCS have been reported in detail previously [9]. In brief, all participants were recruited from “The Guangzhou Health and Happiness Association for the Respectable Elders” (GHHARE) from 2003 to 2008. GHHARE is a community social and welfare organization unofficially aligned with the local government. Membership is open to local residents aged 50 years or above from all districts of Guangzhou. About 7% of residents in this age group were included. A random sample of 1,996 participants were selected from 10,027 participants from phase 3 of the GBCS during November 2006 to September 2007 for a more detailed sub-cohort (GBCS-CVD) on cardiovascular disease and diabetes. The sample selection was stratified by sex to ensure approximately equal numbers of men (49.7%) and women in the group. The cohort profile of the GBCS-CVD has been reported elsewhere [10]. Information on demographic characteristics, lifestyle factors, family and personal medical history was collected via face-to-face computer-assisted interview by trained nurses. Reliability and validity of the questionnaire were tested 6 months into recruitment by recalling 200 randomly selected participants for re-interview and showed satisfactory results [9]. The study has received ethical approval from the Guangzhou Medical Ethics Committee of the Chinese Medical Association, Guangzhou, China (IRB No. 20030210). All participants gave written informed consent before participation.
Measures of glucose metabolism
All participants were required to fast for at least 10 hours from the night before blood taking in the morning. HbA1c was measured using enzyme-linked immunosorbent assay (ELISA) (DiaSTAT Hemoglobin A1c Program, Bio-Rad Laboratories, Hercules, CA, USA; normal values up to 6.5%). FPG were measured by Shimadzu CL-8000 Clinical Chemistry Analyzer (Shimadzu, Kyoto, Japan). Fasting insulin were measured by Mercodia AB (Uppsala, Sweden). Two-hour glucose and 2-hour insulin were measured after 75-g oral glucose administration in all participants except for those with self-reported physician diagnosis of diabetes or with glucose-lowering treatment. HOMA-IR was calculated using the formula [11] as follows:
HOMA-IR=[fasting insulin (μU/mL)×FPG (mmol/L)]/22.5
HbA1c, FPG, and 2-hour glucose were categorized into three groups according to the suggested criteria by the American Diabetes Association: for HbA1c, <5.7% as normal, 5.7% to <6.5% as prediabetes, ≥6.5% as diabetes; for FPG, <5.6 mmol/L as normal, 5.6 to <7.0 mmol/L as impaired FPG, ≥7.0 mmol/L as diabetes; for 2-hour glucose, <7.8 mmol/L as normal, 7.8 to <11.1 mmol/L as impaired glucose tolerance, ≥11.1 mmol/L as diabetes [12]. Insulin resistance was defined as the top quartile of the HOMA-IR [13]. As no established cut-offs for fasting insulin and 2-hour insulin, they were categorized into quartiles. Diabetes was defined as a FPG ≥7.0 mmol/L, 2-hour post-load glucose ≥11.1 mmol/L, HbA1c ≥6.5%, and/or previous physician diagnosis or use of antidiabetic medications [12].
Outcomes
The outcome of interest was first primary CRC diagnosed after baseline (2006 to 2008). Incident CRC up to April 2021 were ascertained from the Guangzhou Cancer Registry of the Guangzhou Center for Disease Control and Prevention. CRC were classified using Tenth Revision of the International Classification of Diseases (ICD-10 C18–C20).
Potential confounders
Age [14], sex [15,16], waist circumference [17], socioeconomic position (household annual income, education) [18,19], lifestyle factors (smoking [20,21], alcohol drinking [22,23], physical activity [24,25], intake of vegetable and red meat [26,27]) were considered as potential confounders because they have been associated with both glucose metabolism and CRC. Waist circumference was measured horizontally around the smallest circumference between the ribs and iliac crest, or at the navel, if no natural waistline was present. Physical activity was categorized into inactive, moderate and active based on the short version of the International Physical Activity Questionnaire, which has been validated previously [28]. Consumption of vegetable and red meat intake were assessed using a validated food frequency questionnaire [29].
Statistical analysis
Baseline characteristics were described by incident CRC using mean±standard deviation or median (interquartile range) for continuous variables and number (percentage) for categorical variables. T-test or Wilcoxon test was used for comparison of continuous variables between the groups, and chi-square test for categorical variables.
Cox proportional hazard regression was used to analyze associations of glycemic indictors with CRC risk, giving crude and adjusted hazard ratio (HR) and 95% confidence interval (CI). No evidence for the violation of the proportional hazard assumption was found by the Schoenfeld residual method. Restricted cubic splines with three knots (10th, 50th, 90th percentiles) based on Cox regression were used to estimate potential nonlinear relationships between glycemic indictors and the risk of CRC. Potential interactions between glycemic indictors and sex, age, waist circumference, smoking, alcohol drinking and physical activity were tested. No significant interaction was found (P for interaction from 0.28 to 0.98). To enable comparability with other studies, stratified analyses by sex, obesity (waist circumference ≥90 cm in men and 80 cm in women vs. <90 cm in men and 80 cm in women) [30] and age group (age <65 years vs. ≥65 years) were also conducted. Sensitivity analyses were conducted by dividing the participants into quartiles of HbA1c, FPG, and 2-hour glucose level and using the competing risk model to account for competing risks. All analyses were performed using R software version 4.1.3 (R Foundation for Statistical Computing, Vienna, Austria) and all tests were two-sided with a significant level of P<0.05.
Meta-analysis on HbA1c and risk of CRC
Meta-analysis incorporating the GBCS results was conducted to investigate the association of HbA1c with CRC risk, following the Preferred Reporting Items for Systematic Reviews and Meta-Analysis (PRISMA) guideline [31]. A literature search was conducted in PubMed, Web of Science, and Embase for publications published before July 10, 2022 without language or time restrictions. The following terms were applied: ((‘hemoglobin a1c’ OR ‘hba1c’ OR ‘glycated hemoglobin’ OR ‘glycosylated hemoglobin’ OR ‘glycohemoglobin’ OR ‘glycated hemoglobin a1c’ OR ‘glycosylated hemoglobin a1c’) AND (‘colorectal’ OR ‘colon’ OR ‘rectal’ OR ‘rectum’) AND (‘cancer’ OR ‘carcinoma’ OR ‘tumor’ OR ‘neoplasm’ OR ‘neoplasia’ OR ‘malignancy’)). The population, exposure, comparison and outcome of the meta-analysis [32] were: (1) general population; (2) elevated HbA1c; (3) participants with normal HbA1c level; (4) incident colorectal cancer, respectively.
A total of 21 articles were retrieved and 14 of them were excluded for one of the following reasons: (1) review article (n=8); (2) duplicate publication (n=3); (3) insufficient data (n=3). Details of the literature search and screening process are shown in Supplementary Fig. 1. Information was extracted from each eligible study, including first author name, publication year, setting, study design, sample size, the number of cases, sex, follow-up duration, baseline age, covariates adjusted, fully adjusted risk estimate and 95% CI. Quality of the studies was assessed with the Newcastle-Ottawa scale.
For each study, the median or midpoint of the upper and lower boundaries in each category was assigned to the corresponding relative risk (RR). When the lowest or the highest category was open-ended, we assumed the length of the open-ended interval to be the same as that of the adjacent interval [33]. When HbA1c was expressed in mmol/mol, value was transformed to % by the following equation:
HbA1c (%)=0.0915×HbA1c (mmol/mol)+2.15% [34]
RR of CRC associated with per % increment in HbA1c was obtained by using linear dose-response meta-analysis proposed by Greenland and Longnecker [35], except GBCS where linear dose-response trends were reported. Heterogeneity was examined by Cochran’s Q test and I2 statistic. When P value for the Q test less than 0.05 or an I2 value greater than 50%, data from the included studies were combined in a random-effects model; otherwise, the fixed-effects model was employed. Subgroup meta-analyses were conducted by study design, geographical area, sex, and cancer site. Potential publication bias was examined by funnel plot and Egger test. The potential nonlinear relationship between HbA1c and RR for CRC were explored by a cubic spline model with three knots at the 10%, 50%, and 90% percentiles of the distribution.
Data availability statement
Due to ethical restrictions protecting patient privacy, data available on request from the Guangzhou Biobank Cohort Study Data Access Committee. Please contact the corresponding authors for fielding data accession requests.
RESULTS
The sample characteristics of GBCS
In 1,996 participants, after excluding those with self-reported cancer at baseline (n=23), loss to follow-up for vital status (n=17), missing information on HbA1c (n=7), or other covariates (n=34), a total of 1,915 participants were included in the main analysis. During an average follow-up of 12.9±2.8 years with 24,732 person-years, 42 incident CRC cases (40.5% women) were recorded. Table 1 shows no significant association between most baseline characteristics and incident CRC (P>0.05), except for age (i.e., the older, the higher CRC incidence; P<0.05).

Baseline characteristics by incident colorectal cancer
The CRC incidence by baseline glycemic measures in GBCS
Fig. 1 shows that, after adjusting for age, sex, waist circumference, smoking, alcohol drinking, household annual income, education, physical activity, intake of vegetable and red meat, per % increment in HbA1c was significantly associated with a higher CRC risk, with HR being 1.28 (95% CI, 1.01 to 1.63). This association became stronger in the subgroup of women (HR, 1.51; 95% CI, 1.13 to 2.02), but attenuated and became non-significant in men (HR, 1.06; 95% CI, 0.68 to 1.68). Non-significant association between HbA1c and colon or rectal cancer risk was observed. No significant associations were found in the subgroups of obesity and age (Supplementary Fig. 2). Similar results were found when using the competing risk model and grouping participants based on quartiles of HbA1c (Supplementary Figs. 3 and 4). No significant association of FPG, 2-hour glucose, fasting insulin, 2-hour insulin, HOMA-IR, and baseline diabetes with CRC risk was found (Supplementary Figs. 5-12). Results from the restricted cubic spline regression did not support the non-linearity assumptions between the glycemic indicators and risk of CRC (all P for nonlinearity >0.05) (Fig. 2).
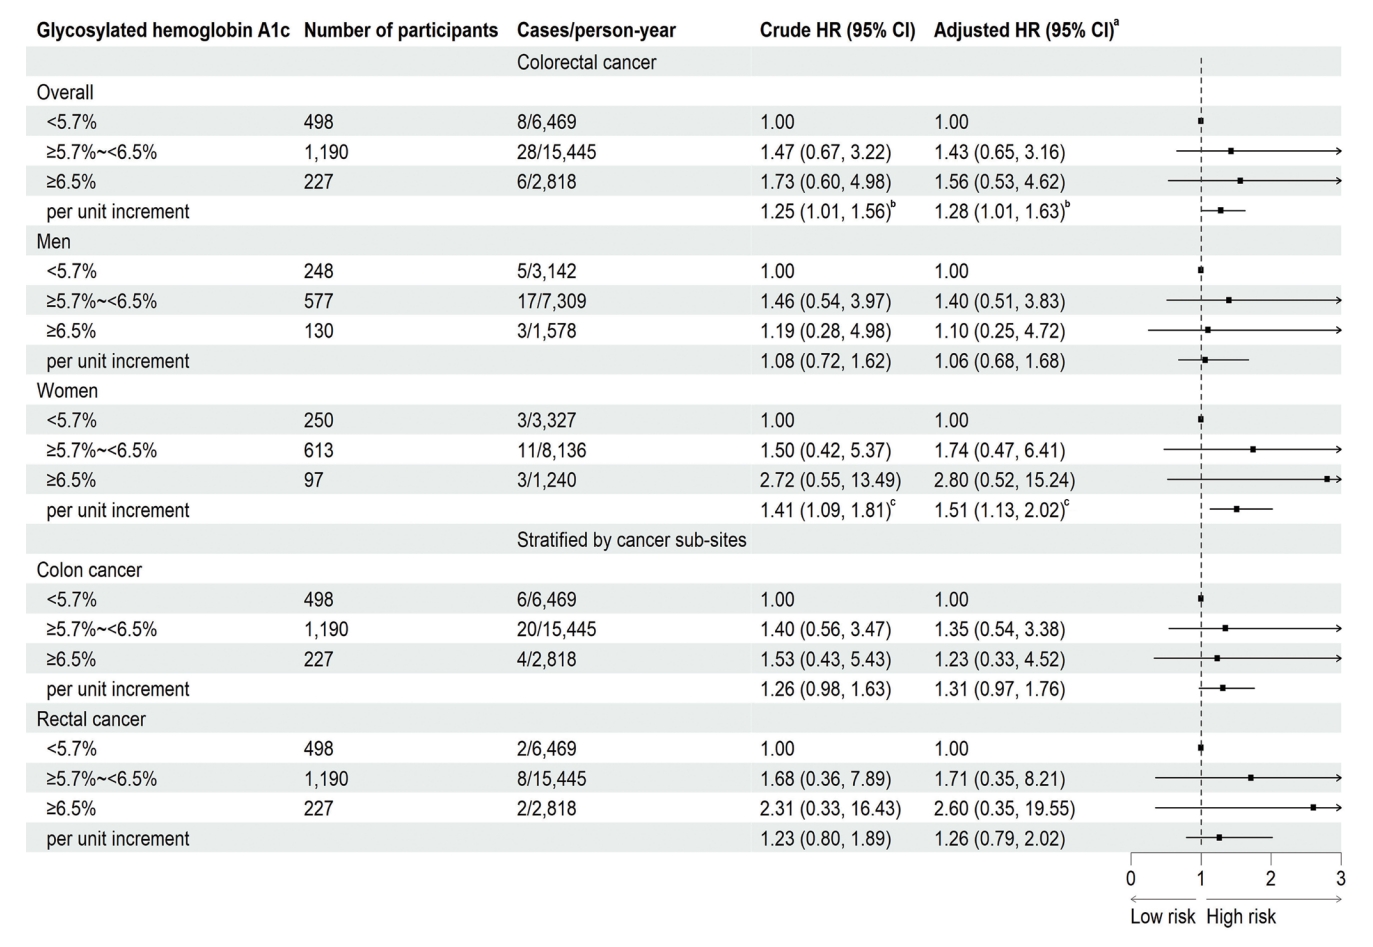
Association of baseline glycosylated hemoglobin with the risk of colorectal cancer on 1,915 participants followed up from 2006–2008 (baseline) to April 2021 in the Guangzhou Biobank Cohort Study. The squares indicate the adjusted hazard ratios (HRs) and the horizontal lines represent 95% confidence interval (CI). aAdjusting for age, sex, waist circumference, smoking, alcohol drinking, household annual income, education, physical activity, intake of vegetable and red meat, bP<0.05, cP<0.01.
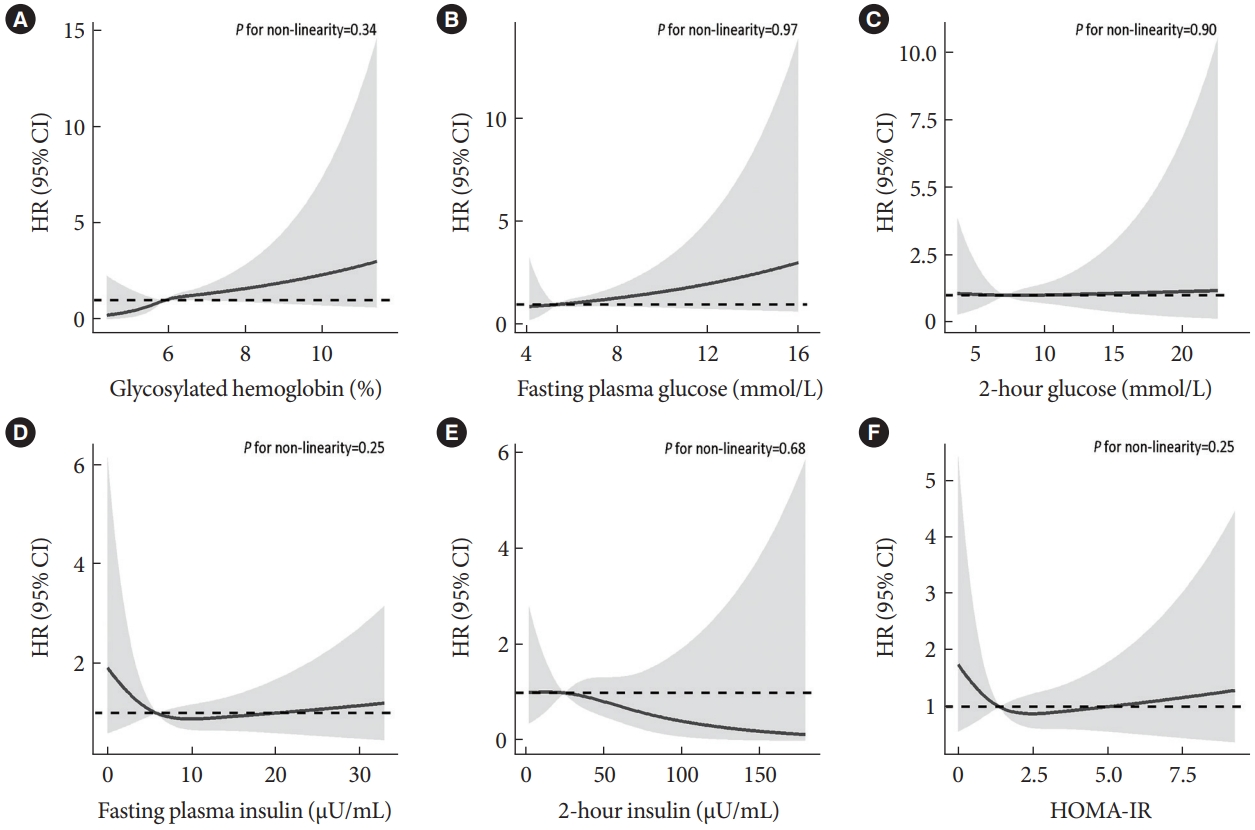
Association of baseline measures of glucose metabolism (2006–2008) with risk of colorectal cancer on participants of the Guangzhou Biobank Cohort Study follow-up until April 2021. Potential nonlinear relationships were examined using restricted cubic splines (three knots on 10th, 50th, and 90th), with hazard ratios (HRs) from Cox proportional hazard models. The HRs was adjusted for age, sex, waist circumference, smoking, alcohol drinking, household annual income, education, physical activity, intake of vegetable and red meat. (A) Glycosylated hemoglobin, (B) fasting plasma glucose, (C) 2-hour glucose, (D) fasting plasma insulin, (E) 2-hour insulin, (F) homeostasis model of risk assessment-insulin resistance (HOMA-IR). CI, confidence interval.
Meta-analysis of CRC risk by baseline HbA1c levels
The systematic search on PubMed, Web of Science, and Embase identified seven studies which met the inclusion criteria [36-42]. Therefore, these seven studies from the literature search and our study were include in the final meta-analysis, giving a total of 523,857 participants and 5,755 CRC cases. The characteristics of the included studies are shown in Supplementary Table 1. All the studies were rewarded a score of ≥7, indicating high quality of the studies (Supplementary Table 2).
As shown in Fig. 3, the pooled RR for CRC risk due to per % increment in HbA1c was 1.13 (95% CI, 1.01 to 1.27), with significant heterogeneity (I2=48%, P=0.04). Subgroup analysis found that the association between HbA1c and the risk of CRC were stronger in women than in men, with pooled RR being 1.35 (95% CI, 1.13 to 1.62) and 1.09 (95% CI, 0.91 to 1.31), respectively (Table 2). Separate analyses by cancer site yielded pooled RR of 1.09 (95% CI, 1.01 to 1.17) for colon cancer and 1.07 (95% CI, 0.95 to 1.21) for rectal cancer. When stratified by geographical area, per % increment in HbA1c was significantly associated with increased CRC risk in Asians (1.31; 95% CI, 1.11 to 1.55) but not in North American and European studies (1.02 [95% CI, 0.65 to 1.61] and 1.07 [95% CI, 1.00 to 1.14], respectively). Additionally, significant association was observed in case-control studies but not in cohort studies. We found no evidence for publication bias (P for Egger’s test=0.20) (Supplementary Fig. 13), nor nonlinear association between HbA1c and CRC risk (P for a non-linearity=0.053).
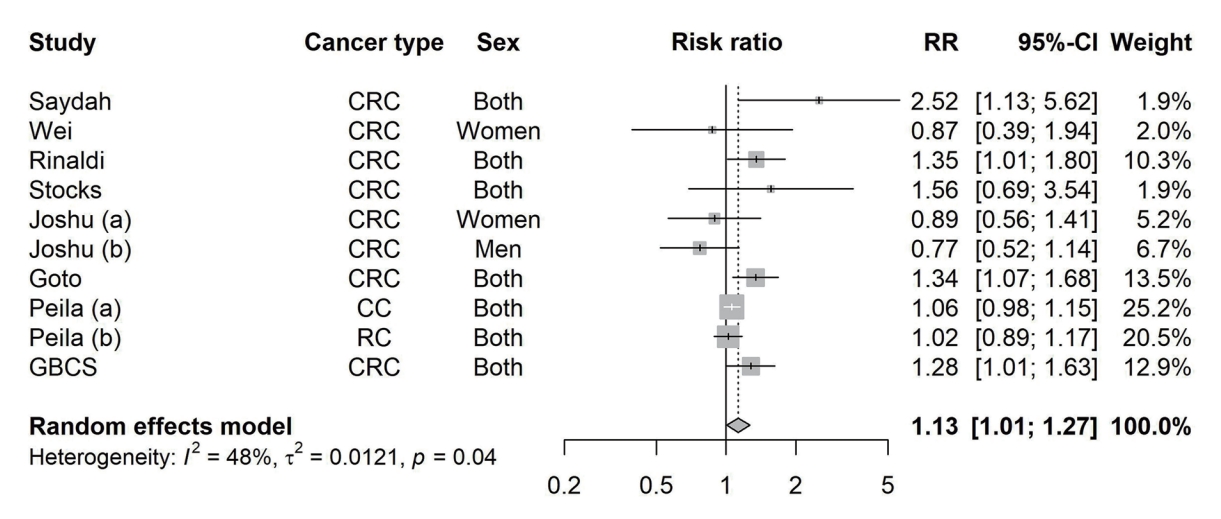
Pooled effect sizes and 95% confidence intervals (CIs) of per % increment in glycosylated hemoglobin (HbA1c) on risk of colorectal cancer. Effect sizes and 95% CIs of individual study except Guangzhou Biobank Cohort Study (GBCS) were calculated using study-specific dose-response analysis. The pooled estimates were obtained by using a random effect model. The dots indicate the effect sizes of per % increment in HbA1c. The size of the square is proportional to the weight of individual study. The horizontal lines represent 95% CI. The diamond data markers indicate the pooled effect size. RR, risk ratio; CRC, colorectal cancer; CC, colon cancer; RC, rectal cancer.

Pooled effect sizes and 95% CIs for association between per % increment in glycosylated hemoglobin and colorectal cancer incidence by study design, geographical area, sex, cancer site
DISCUSSION
In this prospective cohort study with 12.9 years follow-up, we found that higher HbA1c, but not other glycemic indicators, was significantly associated with a higher risk of CRC. The association was more pronounced in women. An up-to-date meta-analysis including our results further supports a positive association between HbA1c and CRC risk. To our knowledge, this is the first study investigating the associations of various glycemic indicators with CRC risk comprehensively. We did not find significant associations of FPG, 2-hour glucose, fasting insulin, 2-hour insulin, HOMA-IR, and baseline diabetes with risk of CRC. Our results highlight the role of HbA1c in the development of CRC.
Our study adds to the literature by showing a significant association between HbA1c and CRC risk. Previous cohort studies examining the association of HbA1c and CRC risk showed inconsistent results. A recent study on 28,629 Japanese showed that higher HbA1c (≥6.5%) was associated with 70% higher risk of CRC [40]. Moreover, a cohort study on 9,605 participants from the United Kingdom reported that per % increment in HbA1c was associated with 34% higher risk of CRC [43]. Another study based on United Kingdom biobank showed that higher HbA1c (39 to <48 mmol/mol) was associated with a risk of colon cancer by 14% [41]. However, another three studies from the United States [39,44] and New Zealand [45] found no significant association between HbA1c and CRC. It is notable that the study from New Zealand included 48,673 young adults (mean age, 38 years) with a relatively short follow-up time (4.4 years) [45]. Therefore, the number of CRC cases was relatively small (n=39) [45]. Moreover, the HbA1c concentrations reported in the Women’s Health Study from the United States [44] were much lower than those reported in other settings (5.1% vs. 5.4%–6.0%) [40,43], which could be due to the use of older unstandardized assays in measuring HbA1c. Note that HbA1c assays were not as reliable as the glucose-based measurements initially [46], although laboratory based HbA1c assays are now as accurate and standardized as glucose-based tests. Finally, some important confounders such as anthropometric measures (waist circumference or body mass index) [45] and lifestyle factors (physical activity and dietary habits) [39] were not accounted in these studies.
Our updated meta-analysis was consistent with two previous meta-analyses conducted in 2014 and 2015 respectively including studies from the Western countries showing that higher HbA1c were significantly associated with higher risk of CRC [6,47]. By addition of two Asian cohorts to our meta-analysis, we observed a stronger association in Asians. Moreover, we also found that women had a more pronounced association than men, which was also supported by a case-control study based on the European Prospective Investigation into Cancer and Nutrition cohort [38]. One possible mechanism for the sex disparity might be explained by the moderating effect due to sex hormones. Experimental studies in male rodents showed that androgens inhibit colorectal tumor growth, probably through the activation of androgen receptor signaling pathway. Male rats with azoxymethane-induced colon cancer showed higher colonic tumorigenesis after castration [48].
Moreover, our subgroup meta-analysis also found significant associations in colon cancer and Asian studies but no significant association in rectal cancer, European and North American studies. These discrepancies might be partly explained by variations in glucose absorption in different segments of the intestines and dietary habits in different countries. In addition, cohort studies, which have been argued to generate more reliable evidence, showed no significant association. However, all the case-control studies included in our meta-analysis were nested in prospective cohorts, which minimized selection bias and information bias. Further studies with large sample sizes and long follow-up duration are warranted to confirm the associations and clarify different associations across subgroups.
Some possible explanations for the positive association between hyperglycemia and CRC have been proposed. First, as glucose is an essential source of energy for cancer cell growth and proliferation, hyperglycemia provides ideal condition for tumor cells [49]. Second, the increase in insulin secretion was found to promote cell proliferation and inhibit apoptosis of colon cancer cells through several signaling pathways [50]. Finally, the accumulation of advanced glycation end products (AGEs) and upregulation of AGEs receptors expression related to hyperglycemia would lead to stimulation of chronic inflammation and oxidative stress, which increase the growth, migration and invasion of CRC cells [49,51]. However, as studies using Mendelian randomization approach as well as ours did not find significant association between diabetes and CRC risk [52], the causal relationship between plasma glucose and CRC remains to be clarified. Regarding the association of HbA1c and CRC, other factors associated with production of HbA1c might also play a role. For example, iron deficiency could increase HbA1c irrespective of plasma glucose levels by inducing peroxidation and changing the structure of hemoglobin [53]. Meanwhile, iron deficiency was associated with increased risk of CRC by altering immune-cell function and restricting the immune system’s response to CRC growth and metastasis [54]. Additional investigation is needed to clarify.
Strengths of our study includes its population-based prospective cohort design, a relatively long follow-up duration (mean, 12.9 years), standardized and comprehensive measurement of glucose metabolism (HbA1c, FPG, 2-hour glucose, fasting insulin, 2-hour insulin). Several limitations should also be noted. First, levels of glycemic indicators were measured at a single time-point, which might have changed during the long follow-up period. Second, because of limited sample size, the statistical power in detecting associations with small effect sizes might be insufficient, especially in subgroup analyses. However, we conducted a meta-analysis to increase the numbers of subjects and evaluate the associations between HbA1c and CRC with greater statistical power. Third, although a wide range of potential confounders were adjusted, bias due to residual confounding cannot be fully ruled out. Previous meta-analysis reported that metformin, a first-line antidiabetic drug, was associated with lower CRC risk [55]. The lack of information on metformin use in our study may have led to underestimation of the associations between glycemic measures and CRC. Further causal inference analyses using methods such as Mendelian randomization are needed to overcome residual confounding and confirm the results.
In conclusion, higher levels of HbA1c were associated with an increased risk of CRC. The results from the updated meta-analysis provide compelling evidence for this association, especially in women, colon cancer, and Asian countries. Our findings shed light on the pathology of glucose metabolism and CRC, which warrants more in-depth investigation.
SUPPLEMENTARY MATERIALS
Supplementary materials related to this article can be found online at https://doi.org/10.4093/dmj.2022.0383.
Supplementary Table 1.
Characteristics of included studies of glycosylated hemoglobin and colorectal cancer risk
Supplementary Table 2.
Quality assessment of each eligible study according to the Newcastle-Ottawa Quality Assessment Scale for case-control study and cohort study
Supplementary Fig. 1.
Flow chart for included study selection in the meta-analysis. aWhen several publications were from the same study, the publication with the largest number of cases were selected.
Supplementary Fig. 2.
Association of baseline glycosylated hemoglobin with the risk of colorectal cancer on 1,915 participants followed up from 2006–2008 (baseline) to April 2021 in the Guangzhou Biobank Cohort Study, stratified by obesity and age group. The squares indicate the adjusted hazard ratios (HRs) and the horizontal lines represent 95% confidence interval (CI). WC, waist circumference. aAdjusting for age, sex, waist circumference, smoking, alcohol drinking, household annual income, education, physical activity, intake of vegetable and red meat.
Supplementary Fig. 3.
Association of baseline glycosylated hemoglobin (HbA1c) with the risk of colorectal cancer on 1,915 participants followed up from 2006–2008 (baseline) to April 2021 in the Guangzhou Biobank Cohort Study, by dividing the participants according to the quartiles of HbA1c level. The squares indicate the adjusted hazard ratios (HRs) and the horizontal lines represent 95% confidence interval (CI). aAdjusting for age, sex, waist circumference, smoking, alcohol drinking, household annual income, education, physical activity, intake of vegetable and red meat.
Supplementary Fig. 4.
Association of baseline glycosylated hemoglobin with the risk of colorectal cancer on 1,915 participants followed up from 2006–2008 (baseline) to April 2021 in the Guangzhou Biobank Cohort Study, by competing risk analysis. The squares indicate the adjusted hazard ratios (HRs) and the horizontal lines represent 95% confidence interval (CI). aAdjusting for age, sex, waist circumference, smoking, alcohol drinking, household annual income, education, physical activity, intake of vegetable and red meat, bP<0.05, cP<0.01.
Supplementary Fig. 5.
Association of baseline 2-hour glucose with the risk of colorectal cancer on 1,261 participants followed up from 2006–2008 (baseline) to April 2021 in the Guangzhou Biobank Cohort Study. The squares indicate the adjusted hazard ratios (HRs) and the horizontal lines represent 95% confidence interval (CI). aAdjusting for age, sex, waist circumference, smoking, alcohol drinking, household annual income, education, physical activity, intake of vegetable and red meat.
Supplementary Fig. 6.
Association of baseline fasting glucose with the risk of colorectal cancer on 1,920 participants followed up from 2006–2008 (baseline) to April 2021 in the Guangzhou Biobank Cohort Study. The squares indicate the adjusted hazard ratios (HRs) and the horizontal lines represent 95% confidence interval (CI). aAdjusting for age, sex, waist circumference, smoking, alcohol drinking, household annual income, education, physical activity, intake of vegetable and red meat, bP<0.05.
Supplementary Fig. 7.
Association of baseline fasting glucose with the risk of colorectal cancer on 1,920 participants followed up from 2006–2008 (baseline) to April 2021 in the Guangzhou Biobank Cohort Study, by dividing the participants according to the quartiles of fasting glucose level. The squares indicate the adjusted hazard ratios (HRs) and the horizontal lines represent 95% confidence interval (CI). NA, not available. aAdjusting for age, sex, waist circumference, smoking, alcohol drinking, household annual income, education, physical activity, intake of vegetable and red meat.
Supplementary Fig. 8.
Association of baseline 2-hour glucose with the risk of colorectal cancer on 1,261 participants followed up from 2006–2008 (baseline) to April 2021 in the Guangzhou Biobank Cohort Study, by dividing the participants according to the quartiles of 2-hour glucose level. The squares indicate the adjusted hazard ratios (HRs) and the horizontal lines represent 95% confidence interval (CI). aAdjusting for age, sex, waist circumference, smoking, alcohol drinking, household annual income, education, physical activity, intake of vegetable and red meat.
Supplementary Fig. 9.
Association of baseline fasting plasma insulin with the risk of colorectal cancer on 1,111 participants followed up from 2006–2008 (baseline) to April 2021 in the Guangzhou Biobank Cohort Study. The squares indicate the adjusted hazard ratios (HRs) and the horizontal lines represent 95% confidence interval (CI). aAdjusting for age, sex, waist circumference, smoking, alcohol drinking, household annual income, education, physical activity, intake of vegetable and red meat.
Supplementary Fig. 10.
Association of baseline 2-hour insulin with the risk of colorectal cancer on 1,107 participants followed up from 2006–2008 (baseline) to April 2021 in the Guangzhou Biobank Cohort Study. The squares indicate the adjusted hazard ratios (HRs) and the horizontal lines represent 95% confidence interval (CI). aAdjusting for age, sex, waist circumference, smoking, alcohol drinking, household annual income, education, physical activity, intake of vegetable and red meat.
Supplementary Fig. 11.
Association of baseline homeostasis model of risk assessment-insulin resistance (HOMA-IR) with the risk of colorectal cancer on 1,110 participants followed up from 2006–2008 (baseline) to April 2021 in the Guangzhou Biobank Cohort Study. The squares indicate the adjusted hazard ratios (HRs) and the horizontal lines represent 95% confidence interval (CI). aThe 75th percentile as cut-off value, bAdjusting for age, sex, waist circumference, smoking, alcohol drinking, household annual income, education, physical activity, intake of vegetable and red meat.
Supplementary Fig. 12.
Association of baseline diabetes with the risk of colorectal cancer on 1,923 participants followed up from 2006–2008 (baseline) to April 2021 in the Guangzhou Biobank Cohort Study. The squares indicate the adjusted hazard ratios (HRs) and the horizontal lines represent 95% confidence interval (CI). aAdjusting for age, sex, waist circumference, smoking, alcohol drinking, household annual income, education, physical activity, intake of vegetable and red meat.
Supplementary Fig. 13.
Funnel plot of the highest compared to lowest glycosylated hemoglobin (HbA1c) categories from all included studies evaluating the association between HbA1c and risk of colorectal cancer. Egger’s regression asymmetry test (P=0.20).
Notes
CONFLICTS OF INTEREST
No potential conflict of interest relevant to this article was reported.
AUTHOR CONTRIBUTIONS
Conception or design: all authors.
Acquisition, analysis, or interpretation of data: all authors.
Drafting the work or revising: S.Y.W., W.S.Z., L.X.
Final approval of the manuscript: all authors.
FUNDING
This work was supported by the Special Foundation for Science and Technology Basic Research Program (2019FY101103) and Natural Science Foundation of China (81941019). The Guangzhou Biobank Cohort Study was funded by The University of Hong Kong Foundation for Educational Development and Research (SN/1f/HKUF-DC; C20400.28505200), the Health Medical Research Fund (Grant number: HMRF/13143241) in Hong Kong; Guangzhou Public Health Bureau (201102A211004011) Natural Science Foundation of Guangdong (2018A030313140), and the University of Birmingham, UK.
Acknowledgements
The Guangzhou Biobank Cohort Study investigators include the following: Guangzhou Twelfth People’s Hospital, WS Zhang, M Cao, T Zhu, B Liu, and CQ Jiang (Co-PI); The University of Hong Kong, CM Schooling, SM McGhee, GM Leung, R Fielding, and TH Lam (Co-PI); and The University of Birmingham, P Adab, GN Thomas, and KK Cheng (Co-PI).