- Current
- Browse
- Collections
-
For contributors
- For Authors
- Instructions to authors
- Article processing charge
- e-submission
- For Reviewers
- Instructions for reviewers
- How to become a reviewer
- Best reviewers
- For Readers
- Readership
- Subscription
- Permission guidelines
- About
- Editorial policy
Articles
- Page Path
- HOME > Diabetes Metab J > Volume 43(1); 2019 > Article
-
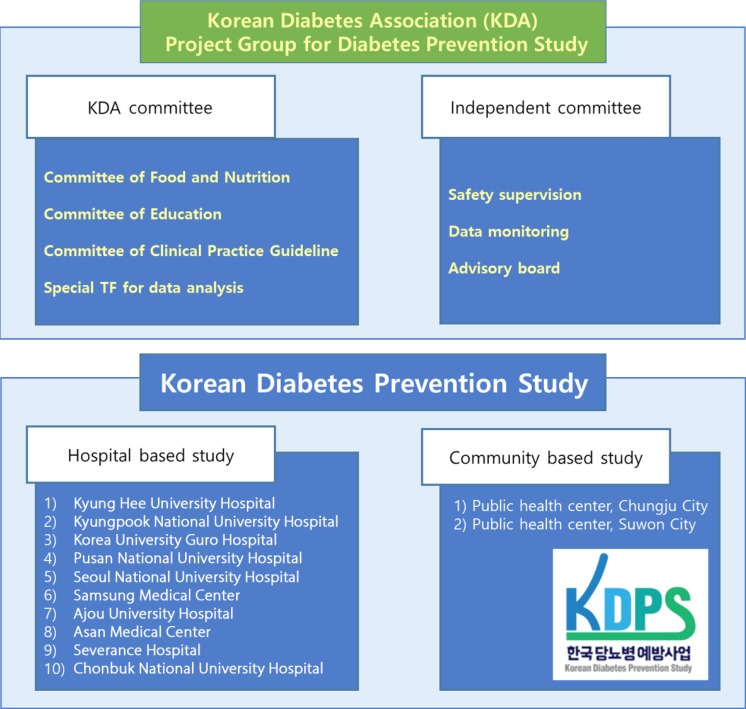
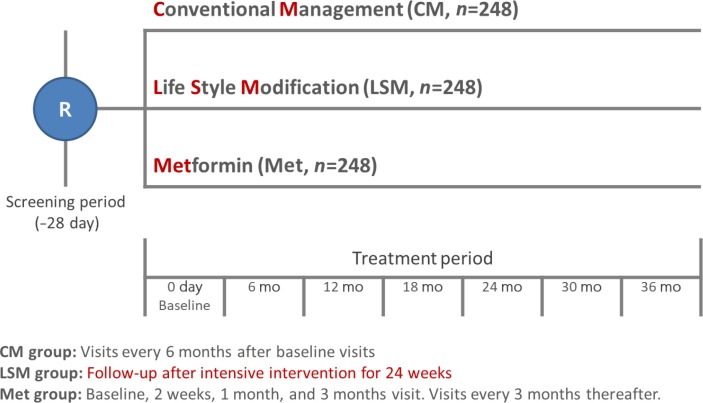
Original ArticleClinical Diabetes and Therapeutics Hospital-Based Korean Diabetes Prevention Study: A Prospective, Multi-Center, Randomized, Open-Label Controlled Study
-
Sang Youl Rhee, Suk Chon, Kyu Jeung Ahn, Jeong-Taek Woo
 , the Korean Diabetes Prevention Study Investigators
 -
Diabetes & Metabolism Journal 2019;43(1):49-58.
DOI: https://doi.org/10.4093/dmj.2018.0033
Published online: November 2, 2018
Department of Endocrinology and Metabolism, Kyung Hee University School of Medicine, Seoul, Korea.
- Corresponding author: Jeong-Taek Woo. Department of Endocrinology and Metabolism, Kyung Hee University School of Medicine, 23 Kyungheedae-ro, Dongdaemun-gu, Seoul 02447, Korea. jtwoomd@khmc.or.kr
• Received: February 18, 2018 • Accepted: June 3, 2018
Copyright © 2018 Korean Diabetes Association
This is an Open Access article distributed under the terms of the Creative Commons Attribution Non-Commercial License (http://creativecommons.org/licenses/by-nc/4.0/) which permits unrestricted non-commercial use, distribution, and reproduction in any medium, provided the original work is properly cited.


Figure & Data
References
Citations
Citations to this article as recorded by 
- Estimating insulin sensitivity and β-cell function from the oral glucose tolerance test: validation of a new insulin sensitivity and secretion (ISS) model
Joon Ha, Stephanie T. Chung, Max Springer, Joon Young Kim, Phil Chen, Aaryan Chhabra, Melanie G. Cree, Cecilia Diniz Behn, Anne E. Sumner, Silva A. Arslanian, Arthur S. Sherman
American Journal of Physiology-Endocrinology and Metabolism.2024; 326(4): E454. CrossRef - Development and Adaptability of Smartphone-based Dietary Coaching Program for Patients Undergoing Diabetes and Prediabetes with Continuous Glucose Monitoring Device
Myoung Soo Kim, Jung Mi Ryu, Minkyeong Kang, Jiwon Park, Yeh Chan Ahn, Yang Seok Kim
Journal of Health Informatics and Statistics.2023; 48(1): 36. CrossRef - Improving Machine Learning Diabetes Prediction Models for the Utmost Clinical Effectiveness
Juyoung Shin, Joonyub Lee, Taehoon Ko, Kanghyuck Lee, Yera Choi, Hun-Sung Kim
Journal of Personalized Medicine.2022; 12(11): 1899. CrossRef - Impaired fasting glucose levels in overweight or obese subjects for screening of type 2 diabetes in Korea
Jin-Hee Lee, Suk Chon, Seon-Ah Cha, Sun-Young Lim, Kook-Rye Kim, Jae-Seung Yun, Sang Youl Rhee, Kun-Ho Yoon, Yu-Bae Ahn, Jeong-Taek Woo, Seung-Hyun Ko
The Korean Journal of Internal Medicine.2021; 36(2): 382. CrossRef - Development and Validation of a Deep Learning Based Diabetes Prediction System Using a Nationwide Population-Based Cohort
Sang Youl Rhee, Ji Min Sung, Sunhee Kim, In-Jeong Cho, Sang-Eun Lee, Hyuk-Jae Chang
Diabetes & Metabolism Journal.2021; 45(4): 515. CrossRef - 2021 Clinical Practice Guidelines for Diabetes Mellitus of the Korean Diabetes Association
Kyu Yeon Hur, Min Kyong Moon, Jong Suk Park, Soo-Kyung Kim, Seung-Hwan Lee, Jae-Seung Yun, Jong Ha Baek, Junghyun Noh, Byung-Wan Lee, Tae Jung Oh, Suk Chon, Ye Seul Yang, Jang Won Son, Jong Han Choi, Kee Ho Song, Nam Hoon Kim, Sang Yong Kim, Jin Wha Kim,
Diabetes & Metabolism Journal.2021; 45(4): 461. CrossRef - Short-Term Effects of the Internet-Based Korea Diabetes Prevention Study: 6-Month Results of a Community-Based Randomized Controlled Trial
Jin-Hee Lee, Sun-Young Lim, Seon-Ah Cha, Chan-Jung Han, Ah Reum Jung, Kook-Rye Kim, Kun-Ho Yoon, Seung-Hyun Ko
Diabetes & Metabolism Journal.2021; 45(6): 960. CrossRef - 2021 Clinical Practice Guidelines for Diabetes Mellitus in Korea
Seung-Hyun Ko
The Journal of Korean Diabetes.2021; 22(4): 244. CrossRef - Optimal fasting plasma glucose and haemoglobin A1c levels for screening of prediabetes and diabetes according to 2‐hour plasma glucose in a high‐risk population: The Korean Diabetes Prevention Study
Seon‐Ah Cha, Suk Chon, Jae‐Seung Yun, Sang Youl Rhee, Sun‐Young Lim, Kun‐Ho Yoon, Yu‐Bae Ahn, Seung‐Hyun Ko, Jeong‐Taek Woo, Jin‐Hee Lee
Diabetes/Metabolism Research and Reviews.2020;[Epub] CrossRef - How was the Diabetes Metabolism Journal added to MEDLINE?
Hye Jin Yoo
Science Editing.2020; 7(2): 201. CrossRef - Commercial Postural Devices: A Review
Nicole Kah Mun Yoong, Jordan Perring, Ralph Jasper Mobbs
Sensors.2019; 19(23): 5128. CrossRef - Changes in Metabolic Profile Over Time: Impact on the Risk of Diabetes
Yunjung Cho, Seung-Hwan Lee
Diabetes & Metabolism Journal.2019; 43(4): 407. CrossRef - Metformin for prevention or delay of type 2 diabetes mellitus and its associated complications in persons at increased risk for the development of type 2 diabetes mellitus
Kasper S Madsen, Yuan Chi, Maria-Inti Metzendorf, Bernd Richter, Bianca Hemmingsen
Cochrane Database of Systematic Reviews.2019;[Epub] CrossRef
 PubReader
 Cite
Cite