- Current
- Browse
- Collections
-
For contributors
- For Authors
- Instructions to authors
- Article processing charge
- e-submission
- For Reviewers
- Instructions for reviewers
- How to become a reviewer
- Best reviewers
- For Readers
- Readership
- Subscription
- Permission guidelines
- About
- Editorial policy
Articles
- Page Path
- HOME > Diabetes Metab J > Volume 43(4); 2019 > Article
-
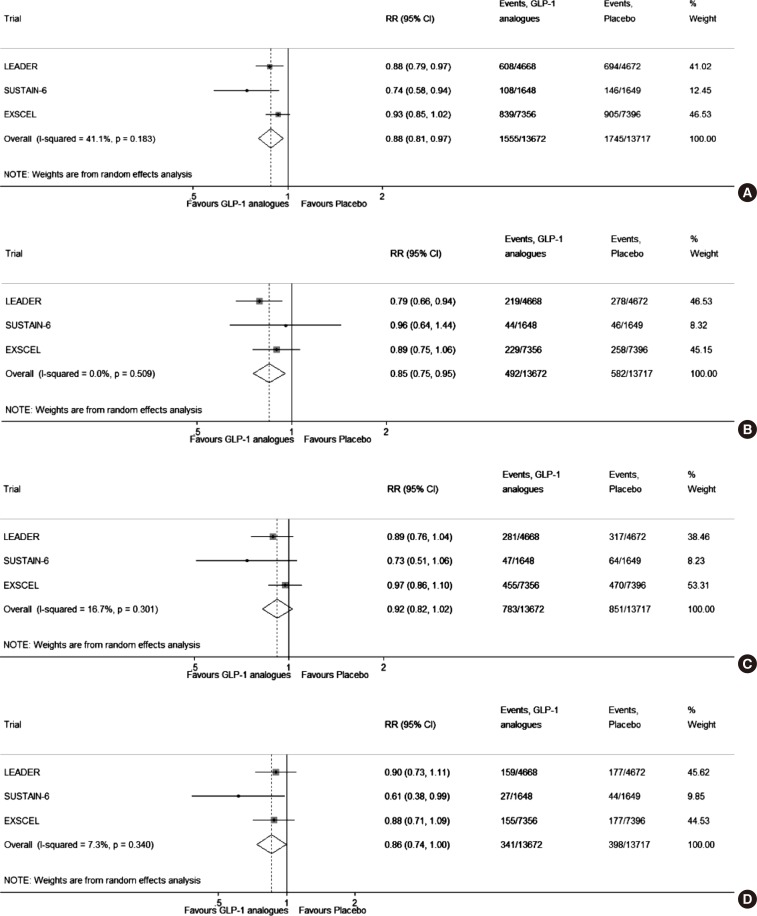
Original ArticleClinical Diabetes & Therapeutics Asian Subpopulations May Exhibit Greater Cardiovascular Benefit from Long-Acting Glucagon-Like Peptide 1 Receptor Agonists: A Meta-Analysis of Cardiovascular Outcome Trials
-
Yu Mi Kang1
 , Yun Kyung Cho2, Jiwoo Lee2, Seung Eun Lee2, Woo Je Lee2, Joong-Yeol Park2, Ye-Jee Kim3, Chang Hee Jung2, Michael A. Nauck4
 -
Diabetes & Metabolism Journal 2019;43(4):410-421.
DOI: https://doi.org/10.4093/dmj.2018.0070
Published online: December 27, 2018
1International Healthcare Center, Asan Medical Center, University of Ulsan College of Medicine, Seoul, Korea.
2Department of Internal Medicine, Asan Medical Center, University of Ulsan College of Medicine, Seoul, Korea.
3Department of Clinical Epidemiology and Biostatistics, Asan Medical Center, University of Ulsan College of Medicine, Seoul, Korea.
4Diabetes Center Bochum-Hattingen, St. Josef-Hospital, Ruhr-University Bochum, Bochum, Germany.
- Corresponding author: Chang Hee Jung. Department of Internal Medicine, Asan Medical Center, University of Ulsan College of Medicine, 88 Olympic-ro 43-gil, Songpa-gu, Seoul 05505, Korea. chjung0204@amc.seoul.kr
- Corresponding author: Michael A. Nauck. Diabetes Center Bochum-Hattingen, Medical Department I, St. Josef-Hospital, Ruhr-University Bochum, Gudrunstraße 56, 44791 Bochum, Germany. Michael.nauck@rub.de
- *Yu Mi Kang and Yun Kyung Cho contributed equally to this study as first authors.
Copyright © 2019 Korean Diabetes Association
This is an Open Access article distributed under the terms of the Creative Commons Attribution Non-Commercial License (http://creativecommons.org/licenses/by-nc/4.0/) which permits unrestricted non-commercial use, distribution, and reproduction in any medium, provided the original work is properly cited.

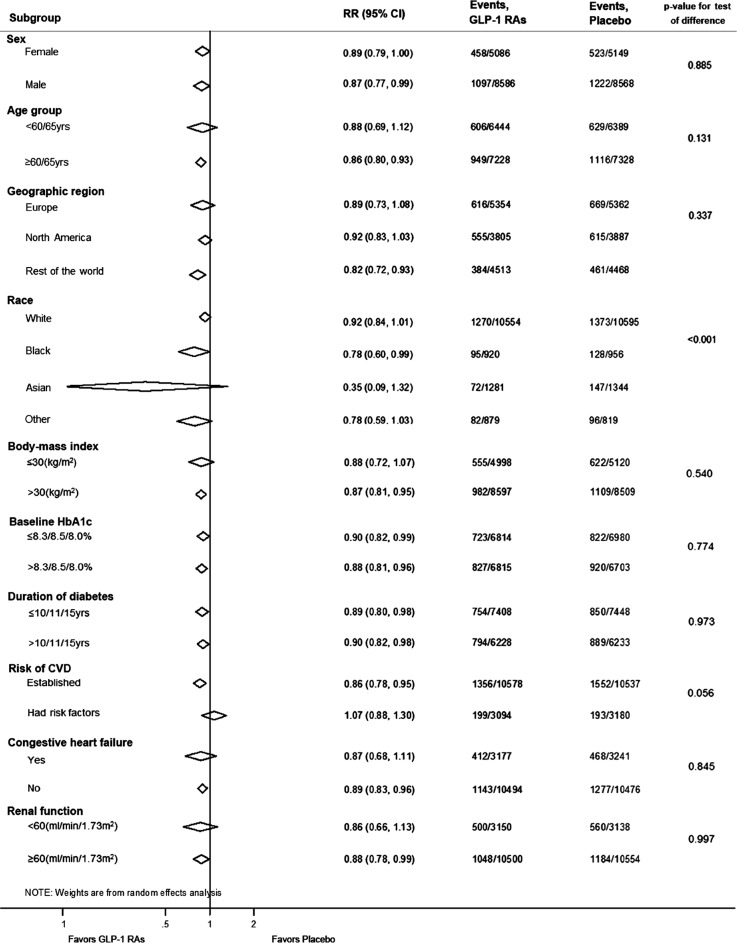
Figure & Data
References
Citations
- Sex, racial, ethnic, and geographical disparities in major adverse cardiovascular outcome of glucagon-like peptide-1 receptor agonists among patients with and without diabetes mellitus: A meta-analysis of placebo-controlled randomized controlled trials,
Frederick Berro Rivera, Nathan Ross B. Bantayan, John Paul Aparece, Linnaeus Louisse A. Cruz, John Vincent Magallong, Polyn Luz Pine, Anne Mira Nicca Idian-Javier, Grace Nooriza O. Lumbang, Edgar V. Lerma, Kyla M. Lara-Breitinger, Martha Gulati, Krishnasw
Journal of Clinical Lipidology.2024;[Epub] CrossRef - Coronary Artery Disease in South Asian Patients: Cardiovascular Risk Factors, Pathogenesis and Treatments
Vincenzo Sucato, Giuseppe Coppola, Girolamo Manno, Giuseppe Vadalà, Giuseppina Novo, Egle Corrado, Alfredo Ruggero Galassi
Current Problems in Cardiology.2023; 48(8): 101228. CrossRef - Retrospective Analysis of the Effectiveness of Oral Semaglutide in Type 2 Diabetes Mellitus and Its Effect on Cardiometabolic Parameters in Japanese Clinical Settings
Hodaka Yamada, Masashi Yoshida, Shunsuke Funazaki, Jun Morimoto, Shiori Tonezawa, Asuka Takahashi, Shuichi Nagashima, Kimura Masahiko, Otsuka Kiyoshi, Kazuo Hara
Journal of Cardiovascular Development and Disease.2023; 10(4): 176. CrossRef - Efficacy of treatment with glucagon-like peptide receptor agonists-1 in Asian patients with type 2 diabetes mellitus
L. Yu. Khamnueva, L. S. Andreeva
Problems of Endocrinology.2023; 69(2): 38. CrossRef - Role of diabetes in stroke: Recent advances in pathophysiology and clinical management
Sian A. Bradley, Kevin J. Spring, Roy G. Beran, Dimitrios Chatzis, Murray C. Killingsworth, Sonu M. M. Bhaskar
Diabetes/Metabolism Research and Reviews.2022;[Epub] CrossRef - Obesity Pillars Roundtable: Obesity and East Asians
Harold Edward Bays, Jennifer Ng, Jeffrey Sicat, Michelle Look
Obesity Pillars.2022; 2: 100011. CrossRef - Pathophysiology, phenotypes and management of type 2 diabetes mellitus in Indian and Chinese populations
Calvin Ke, K. M. Venkat Narayan, Juliana C. N. Chan, Prabhat Jha, Baiju R. Shah
Nature Reviews Endocrinology.2022; 18(7): 413. CrossRef - Effect of race on cardiometabolic responses to once-weekly exenatide: insights from the Exenatide Study of Cardiovascular Event Lowering (EXSCEL)
Timothy M. E. Davis, Anna Giczewska, Yuliya Lokhnygina, Robert J. Mentz, Naveed Sattar, Rury R. Holman
Cardiovascular Diabetology.2022;[Epub] CrossRef - Generalizability of the Results of Cardiovascular Outcome Trials of Glucagon-Like Peptide 1 Receptor Agonists in Chinese Patients with Type 2 Diabetes Mellitus
Xiaoling Cai, Linong Ji
Diabetes Therapy.2021; 12(7): 1861. CrossRef - Current trends in epidemiology of cardiovascular disease and cardiovascular risk management in type 2 diabetes
Jae-Seung Yun, Seung-Hyun Ko
Metabolism.2021; 123: 154838. CrossRef - Sex and ethnic differences in the cardiovascular complications of type 2 diabetes
Jian L. Yeo, Emer M. Brady, Gerry P. McCann, Gaurav S. Gulsin
Therapeutic Advances in Endocrinology and Metabolism.2021; 12: 204201882110342. CrossRef - Efficacy and Safety of GLP-1 Receptor Agonists in Patients With Type 2 Diabetes Mellitus and Non-Alcoholic Fatty Liver Disease: A Systematic Review and Meta-Analysis
Yuan Zhu, Jiao Xu, Dong Zhang, Xingyu Mu, Yi Shi, Shangtao Chen, Zengxiang Wu, Shuangqing Li
Frontiers in Endocrinology.2021;[Epub] CrossRef - Efficacy and safety of dulaglutide in type 2 diabetes patients in endocrinology clinics of Islamabad, Pakistan
Matiullah Kamin, SajjadAli Khan, UmarYousaf Raja, Osama Ishtiaq, Asmara Malik, Tejhmal Rehman, MuhammadUmar Wahab
Indian Journal of Endocrinology and Metabolism.2021; 25(5): 456. CrossRef - Type 2 Diabetes and Atherosclerotic Cardiovascular Disease in South Asians: a Unique Population with a Growing Challenge
Afreen I. Shariff, Nitya Kumar, William S. Yancy, Leonor Corsino
Current Diabetes Reports.2020;[Epub] CrossRef - Antihypertensive and Renal Mechanisms of SGLT2 (Sodium-Glucose Linked Transporter 2) Inhibitors
Christopher S. Wilcox
Hypertension.2020; 75(4): 894. CrossRef - Subpopulation Differences in the Cardiovascular Efficacy of Long-Acting Glucagon-Like Peptide 1 Receptor Agonists in Type 2 Diabetes Mellitus: A Systematic Review and Meta-analysis
Liyun He, Na Yang, Lingling Xu, Fan Ping, Wei Li, Yuxiu Li, Huabing Zhang
Diabetes Therapy.2020; 11(9): 2121. CrossRef - 2020 Consensus of Taiwan Society of Cardiology on the pharmacological management of patients with type 2 diabetes and cardiovascular diseases
Chern-En Chiang, Kwo-Chang Ueng, Ting-Hsing Chao, Tsung-Hsien Lin, Yih-Jer Wu, Kang-Ling Wang, Shih-Hsien Sung, Hung-I Yeh, Yi-Heng Li, Ping-Yen Liu, Kuan-Cheng Chang, Kou-Gi Shyu, Jin-Long Huang, Cheng-Dao Tsai, Huei-Fong Hung, Ming-En Liu, Tze-Fan Chao,
Journal of the Chinese Medical Association.2020; 83(7): 587. CrossRef - Beneficial effect of anti-diabetic drugs for nonalcoholic fatty liver disease
Kyung-Soo Kim, Byung-Wan Lee
Clinical and Molecular Hepatology.2020; 26(4): 430. CrossRef
 PubReader
 Cite
Cite