
- Current
- Browse
- Collections
-
For contributors
- For Authors
- Instructions to authors
- Article processing charge
- e-submission
- For Reviewers
- Instructions for reviewers
- How to become a reviewer
- Best reviewers
- For Readers
- Readership
- Subscription
- Permission guidelines
- About
- Editorial policy
Articles
- Page Path
- HOME > Diabetes Metab J > Volume 40(2); 2016 > Article
-
Original ArticleOthers The Effect of Glycemic Status on Kidney Stone Disease in Patients with Prediabetes
- Tzu-Hsien Lien1, Jin-Shang Wu1,2, Yi-Ching Yang1,2, Zih-Jie Sun1,3, Chih-Jen Chang1,2
-
Diabetes & Metabolism Journal 2016;40(2):161-166.
DOI: https://doi.org/10.4093/dmj.2016.40.2.161
Published online: April 25, 2016
1Department of Family Medicine, National Cheng Kung University Hospital, Tainan, Taiwan.
2Department of Family Medicine, National Cheng Kung University College of Medicine, Tainan, Taiwan.
3Department of Family Medicine, National Cheng Kung University Hospital, Dou-Liou Branch, Douliu, Taiwan.
- Corresponding author: Chih-Jen Chang. Department of Family Medicine, National Cheng Kung University Hospital, 138 Sheng Li Road, Tainan 70403, Taiwan. em75210@email.ncku.edu.tw
- Corresponding author: Yi-Ching Yang. Department of Family Medicine, National Cheng Kung University Hospital, 138 Sheng Li Road, Tainan 70403, Taiwan. yiching@mail.ncku.edu.tw
• Received: December 17, 2015 • Accepted: March 28, 2016
Copyright © 2016 Korean Diabetes Association
This is an Open Access article distributed under the terms of the Creative Commons Attribution Non-Commercial License (http://creativecommons.org/licenses/by-nc/3.0/) which permits unrestricted non-commercial use, distribution, and reproduction in any medium, provided the original work is properly cited.
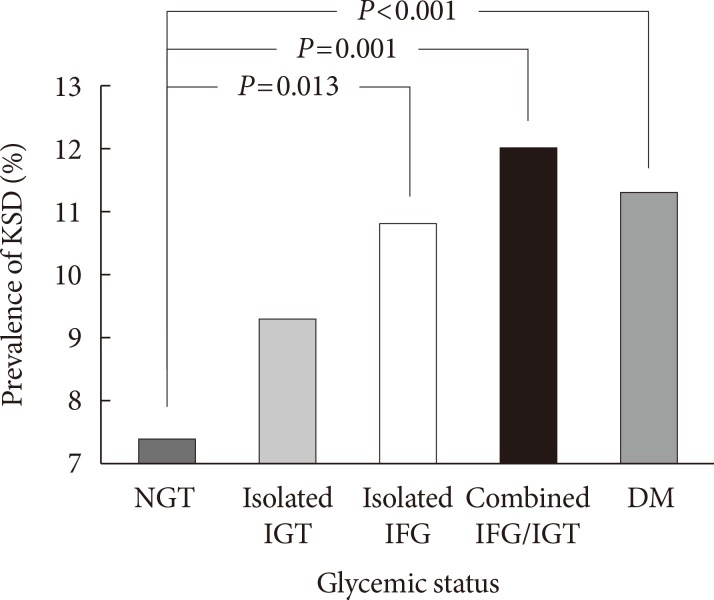
Figure & Data
References
Citations
Citations to this article as recorded by 
- Related Risk Factor Analysis for Upper Urinary Tract Stones in Patients with Abnormal Glucose Metabolism
泽伟 于
Advances in Clinical Medicine.2022; 12(02): 749. CrossRef - Nephrolithiasis: A Red Flag for Cardiovascular Risk
Alessia Gambaro, Gianmarco Lombardi, Chiara Caletti, Flavio Luciano Ribichini, Pietro Manuel Ferraro, Giovanni Gambaro
Journal of Clinical Medicine.2022; 11(19): 5512. CrossRef - Association between metabolic syndrome components and the risk of developing nephrolithiasis: A systematic review and bayesian meta-analysis
Ilham Akbar Rahman, Ilham Fauzan Nusaly, Syakri Syahrir, Harry Nusaly, Makbul Aman Mansyur
F1000Research.2021; 10: 104. CrossRef - Glycemic Status, Insulin Resistance, and the Risk of Nephrolithiasis: A Cohort Study
Seolhye Kim, Yoosoo Chang, Hyun-Suk Jung, Young Youl Hyun, Kyu-Beck Lee, Kwan Joong Joo, Heung Jae Park, Young-Sam Cho, Hyeonyoung Ko, Eunju Sung, Hocheol Shin, Seungho Ryu
American Journal of Kidney Diseases.2020; 76(5): 658. CrossRef - Associations between nephrolithiasis and diabetes mellitus, hypertension and gallstones: A meta‐analysis of cohort studies
Bing‐Biao Lin, Rong‐Hua Huang, Bing‐Liang Lin, Ying‐Kai Hong, Ming‐En Lin, Xue‐Jun He
Nephrology.2020; 25(9): 691. CrossRef - Risk Factors for Urolithiasis (Review)
В. А. Слободянюк
Health of Man.2020; (1): 75. CrossRef - Re: Evidence of Disordered Calcium Metabolism in Adolescent Girls with Type 1 Diabetes: An Observational Study Using a Dual-Stable Calcium Isotope Technique
Dean G. Assimos
Journal of Urology.2018; 199(2): 335. CrossRef - Metabolic syndrome and uric acid nephrolithiasis: insulin resistance in focus
Leonardo Spatola, Pietro Manuel Ferraro, Giovanni Gambaro, Salvatore Badalamenti, Marco Dauriz
Metabolism.2018; 83: 225. CrossRef - Kidney stones diseases and glycaemic statuses: focus on the latest clinical evidences
Leonardo Spatola, Claudio Angelini, Salvatore Badalamenti, Silvio Maringhini, Giovanni Gambaro
Urolithiasis.2017; 45(5): 457. CrossRef
 PubReader
 Cite
Cite


