
- Current
- Browse
- Collections
-
For contributors
- For Authors
- Instructions to authors
- Article processing charge
- e-submission
- For Reviewers
- Instructions for reviewers
- How to become a reviewer
- Best reviewers
- For Readers
- Readership
- Subscription
- Permission guidelines
- About
- Editorial policy
Articles
- Page Path
- HOME > Diabetes Metab J > Volume 40(2); 2016 > Article
-
Original ArticleOthers The Level of Autoantibodies Targeting Eukaryote Translation Elongation Factor 1 α1 and Ubiquitin-Conjugating Enzyme 2L3 in Nondiabetic Young Adults
-
Eunhee G. Kim1, Soo Heon Kwak2, Daehee Hwang3, Eugene C. Yi4, Kyong Soo Park2,4, Bo Kyung Koo2,5
 , Kristine M. Kim1
 -
Diabetes & Metabolism Journal 2016;40(2):154-160.
DOI: https://doi.org/10.4093/dmj.2016.40.2.154
Published online: November 13, 2015
1Department of Systems Immunology, College of Biomedical Science and the Institute of Bioscience and Biotechnology, Kangwon National University, Chuncheon, Korea.
2Department of Internal Medicine, Seoul National University College of Medicine, Seoul, Korea.
3Department of New Biology, Daegu Gyeongbuk Institute of Science and Technology and Institute for Basic Science, Daegu, Korea.
4Molecular Medicine and Biopharmaceutical Sciences, Seoul National University College of Medicine and Pharmacy, Seoul, Korea.
5Department of Internal Medicine, Seoul Metropolitan Government Seoul National University Boramae Medical Center, Seoul National University College of Medicine, Seoul, Korea.
- Corresponding author: Kristine M. Kim. Department of Systems Immunology, College of Biomedical Science and Institute of Bioscience and Biotechnology, Kangwon National University, 1 Gangwondaehak-gil, Chuncheon 24341, Korea. kmkim@kangwon.ac.kr
- Corresponding author: Bo Kyung Koo. Department of Internal Medicine, Seoul Metropolitan Government Seoul National University Boramae Medical Center, 20 Boramae-ro 5-gil, Dongjak-gu, Seoul 07061, Korea. bokyungkoomd@gmail.com
Copyright © 2016 Korean Diabetes Association
This is an Open Access article distributed under the terms of the Creative Commons Attribution Non-Commercial License (http://creativecommons.org/licenses/by-nc/3.0/) which permits unrestricted non-commercial use, distribution, and reproduction in any medium, provided the original work is properly cited.
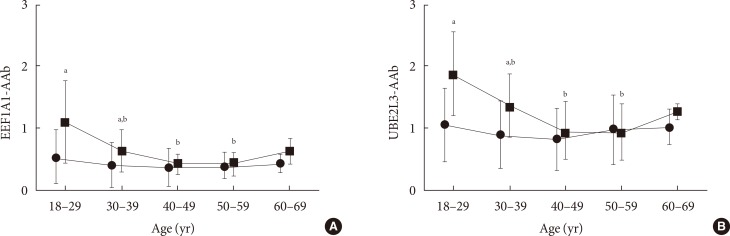
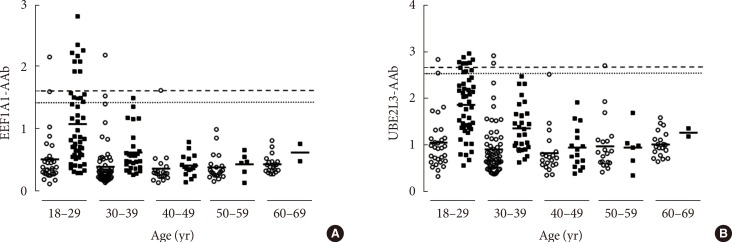
Figure & Data
References
Citations
- An autoantigen-ome from HS-Sultan B-Lymphoblasts offers a molecular map for investigating autoimmune sequelae of COVID-19
Julia Y. Wang, Wei Zhang, Victor B. Roehrl, Michael W. Roehrl, Michael H. Roehrl, Mibel Aguilar
Australian Journal of Chemistry.2023; 76(8): 525. CrossRef - An Autoantigen Atlas From Human Lung HFL1 Cells Offers Clues to Neurological and Diverse Autoimmune Manifestations of COVID-19
Julia Y. Wang, Wei Zhang, Victor B. Roehrl, Michael W. Roehrl, Michael H. Roehrl
Frontiers in Immunology.2022;[Epub] CrossRef - Prevalence of antibodies targeting ubiquitin-conjugating enzyme 2L3 and eukaryote translation elongation factor 1 α1 in Chinese Han and American Caucasian populations with type 1 diabetes
Li Qian, Yuxiao Zhu, Yan Luo, Mu Zhang, Liping Yu, Yu Liu, Tao Yang
Endocrine Connections.2022;[Epub] CrossRef - An autoantigen profile of human A549 lung cells reveals viral and host etiologic molecular attributes of autoimmunity in COVID-19
Julia Y. Wang, Wei Zhang, Michael W. Roehrl, Victor B. Roehrl, Michael H. Roehrl
Journal of Autoimmunity.2021; 120: 102644. CrossRef
 PubReader
 Cite
Cite


