
- Current
- Browse
- Collections
-
For contributors
- For Authors
- Instructions to authors
- Article processing charge
- e-submission
- For Reviewers
- Instructions for reviewers
- How to become a reviewer
- Best reviewers
- For Readers
- Readership
- Subscription
- Permission guidelines
- About
- Editorial policy
Articles
- Page Path
- HOME > Diabetes Metab J > Volume 36(3); 2012 > Article
-
Original ArticleClinical Care/Education Effects of Aerobic Exercise Intensity on Abdominal and Thigh Adipose Tissue and Skeletal Muscle Attenuation in Overweight Women with Type 2 Diabetes Mellitus
- Ji Yeon Jung1, Kyung Ah Han1,2, Hee Jung Ahn1, Hwi Ryun Kwon1, Jae Hyuk Lee2, Kang Seo Park2, Kyung Wan Min1,2
-
Diabetes & Metabolism Journal 2012;36(3):211-221.
DOI: https://doi.org/10.4093/dmj.2012.36.3.211
Published online: June 14, 2012
1Diabetes Center, Eulji General Hospital, Seoul, Korea.
2Department of Internal Medicine, Eulji University School of Medicine, Daejeon, Korea.
- Corresponding author: Kyung Wan Min. Diabetes Center, Eulji General Hospital, 14 Hangeulbiseong-ro, Nowon-gu, Seoul 139-872, Korea. minyungwa@gmail.com
- *Ji Yeon Jung and Kyung Ah Han contributed equally to this study as first authors.
• Received: June 17, 2011 • Accepted: March 13, 2012
Copyright © 2012 Korean Diabetes Association
This is an Open Access article distributed under the terms of the Creative Commons Attribution Non-Commercial License (http://creativecommons.org/licenses/by-nc/3.0/) which permits unrestricted non-commercial use, distribution, and reproduction in any medium, provided the original work is properly cited.

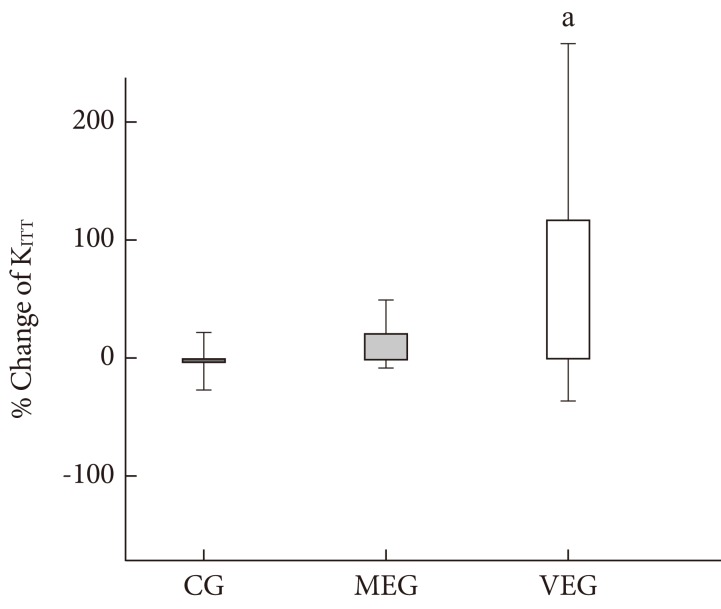

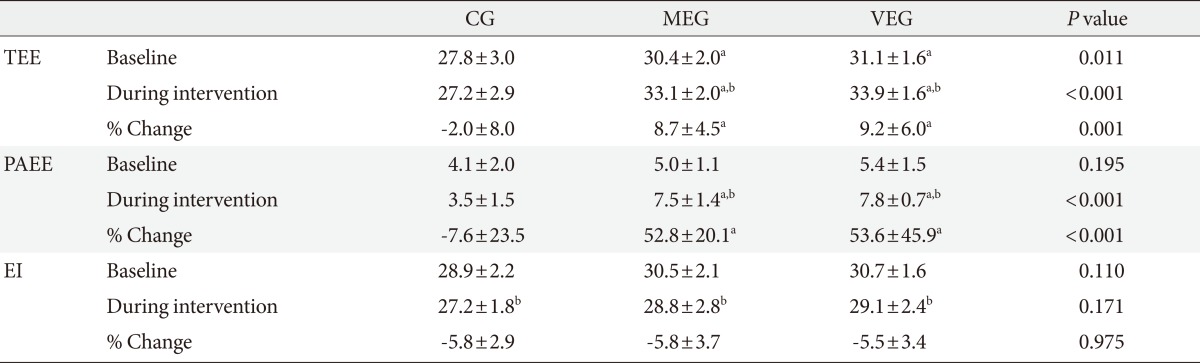
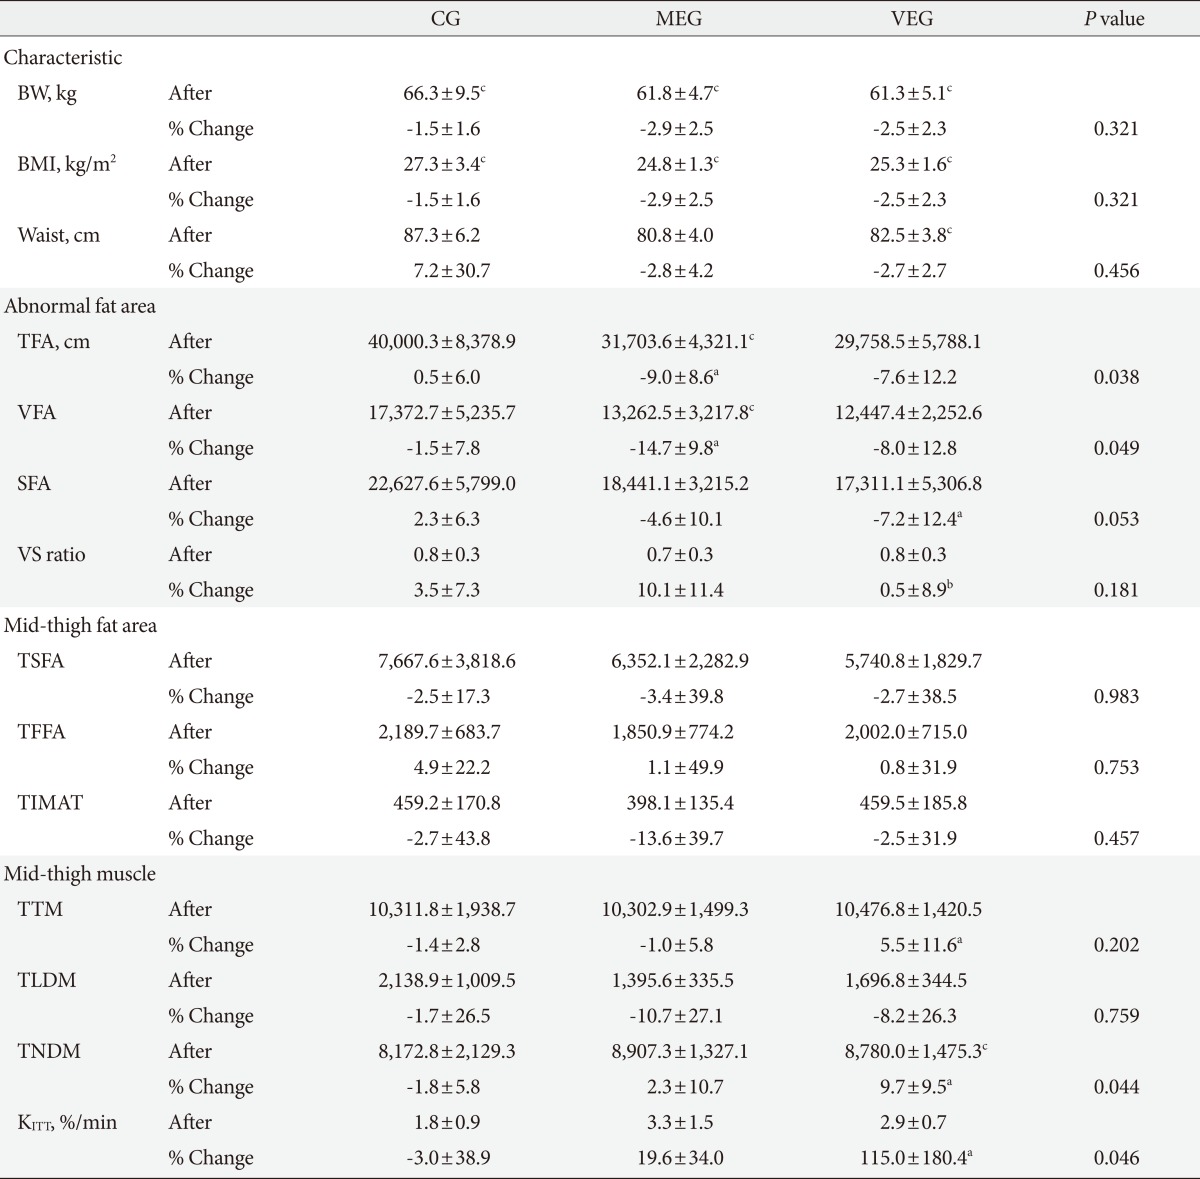
Figure & Data
References
Citations
Citations to this article as recorded by 
- Intermuscular adipose tissue in metabolic disease
Bret H. Goodpaster, Bryan C. Bergman, Andrea M. Brennan, Lauren M. Sparks
Nature Reviews Endocrinology.2023; 19(5): 285. CrossRef - Dose–response effects of exercise and caloric restriction on visceral adiposity in overweight and obese adults: a systematic review and meta-analysis of randomised controlled trials
Francesco Recchia, Chit K. Leung, Angus P. Yu, Welton Leung, Danny J. Yu, Daniel Y. Fong, David Montero, Chi-Ho Lee, Stephen H.S. Wong, Parco M. Siu
British Journal of Sports Medicine.2023; 57(16): 1035. CrossRef - Muscle quality: the assessment, prognosis, and intervention
翔 畑中, 洋祐 大須賀
Nippon Ronen Igakkai Zasshi. Japanese Journal of Geriatrics.2023; 60(2): 103. CrossRef - Associations of Muscle Density and Area With Coronary Artery Plaque and Physical Function
Kristine M. Erlandson, Triin Umbleja, Michael T. Lu, Jana Taron, Heather J. Ribaudo, Edgar T. Overton, Rachel M. Presti, David W. Haas, Paul E. Sax, Michael T. Yin, Bingxue Kris Zhai, Rochelle Louis, Namrata Upadhyay, Parastou Eslami, Pamela S. Douglas, M
JAIDS Journal of Acquired Immune Deficiency Syndromes.2023; 94(2): 174. CrossRef - Aerobic training reduces pancreatic fat content and improves β‐cell function: A randomized controlled trial using IDEAL‐IQ magnetic resonance imaging
Min Li, Qidong Zheng, Joshua D. Miller, Panpan Zuo, Xiaodan Yuan, Jitao Feng, Chao Liu, Shan Bao, Qingqing Lou
Diabetes/Metabolism Research and Reviews.2022;[Epub] CrossRef - Effect of aerobic exercise on waist circumference in adults with overweight or obesity: A systematic review and meta‐analysis
Alex Armstrong, Klaus Jungbluth Rodriguez, Angelo Sabag, Yorgi Mavros, Helen M. Parker, Shelley E. Keating, Nathan A. Johnson
Obesity Reviews.2022;[Epub] CrossRef - Effect of exercise on myosteatosis in adults: a systematic review and meta-analysis
Robinson Ramírez-Vélez, Yasmin Ezzatvar, Mikel Izquierdo, Antonio García-Hermoso
Journal of Applied Physiology.2021; 130(1): 245. CrossRef - Effect of exercise intervention dosage on reducing visceral adipose tissue: a systematic review and network meta-analysis of randomized controlled trials
Yu-Hsuan Chang, Hui-Ying Yang, Shiow-Ching Shun
International Journal of Obesity.2021; 45(5): 982. CrossRef - Exercise Training to Decrease Ectopic Intermuscular Adipose Tissue in Individuals With Chronic Diseases: A Systematic Review and Meta-Analysis
Mauro Tuñón-Suárez, Alvaro Reyes-Ponce, Rodrigo Godoy-Órdenes, Nicolás Quezada, Marcelo Flores-Opazo
Physical Therapy.2021;[Epub] CrossRef - Low-attenuation muscle is a predictor of diabetes mellitus: A population-based cohort study
Muhei Tanaka, Hiroshi Okada, Yoshitaka Hashimoto, Muneaki Kumagai, Hiromi Nishimura, Michiaki Fukui
Nutrition.2020; 74: 110752. CrossRef - Drop-out ratio between moderate to high-intensity physical exercise treatment by patients with, or at risk of, type 2 diabetes mellitus: A systematic review and meta-analysis
Guillem Jabardo-Camprubí, Rafel Donat-Roca, Mercè Sitjà-Rabert, Raimon Milà-Villarroel, Judit Bort-Roig
Physiology & Behavior.2020; 215: 112786. CrossRef - High-Intensity Interval Training Versus Moderate-Intensity Continuous Training in Middle-Aged and Older Patients with Type 2 Diabetes: A Randomized Controlled Crossover Trial of the Acute Effects of Treadmill Walking on Glycemic Control
Romeu Mendes, Nelson Sousa, José Luís Themudo-Barata, Victor Machado Reis
International Journal of Environmental Research and Public Health.2019; 16(21): 4163. CrossRef - Trunk muscle quality assessed by computed tomography: Association with adiposity indices and glucose tolerance in men
Alexandre Maltais, Natalie Alméras, Isabelle Lemieux, Angelo Tremblay, Jean Bergeron, Paul Poirier, Jean-Pierre Després
Metabolism.2018; 85: 205. CrossRef - Counting Footsteps with a Pedometer to Improve HMW Adiponectin and Metabolic Syndrome among Young Female Adults in the United Arab Emirates
Hayder Hasan, Amita Attlee, Hamid Jan Bin Jan Mohamed, Norliyana Aris, Wan Abdul Manan Bin Wan Muda
Journal of Obesity.2018; 2018: 1. CrossRef - Exercise and ectopic fat in type 2 diabetes: A systematic review and meta-analysis
A. Sabag, K.L. Way, S.E. Keating, R.N. Sultana, H.T. O’Connor, M.K. Baker, V.H. Chuter, J. George, N.A. Johnson
Diabetes & Metabolism.2017; 43(3): 195. CrossRef - Effect of aerobic exercise intensity on glycemic control in type 2 diabetes: a meta-analysis of head-to-head randomized trials
Yilina Liubaoerjijin, Tasuku Terada, Kevin Fletcher, Normand G. Boulé
Acta Diabetologica.2016; 53(5): 769. CrossRef - A systematic review and meta‐analysis on the effects of exercise training versus hypocaloric diet: distinct effects on body weight and visceral adipose tissue
R. J. H. M. Verheggen, M. F. H. Maessen, D. J. Green, A. R. M. M. Hermus, M. T. E. Hopman, D. H. T. Thijssen
Obesity Reviews.2016; 17(8): 664. CrossRef - Muscle wasting and aging: Experimental models, fatty infiltrations, and prevention
Thomas Brioche, Allan F. Pagano, Guillaume Py, Angèle Chopard
Molecular Aspects of Medicine.2016; 50: 56. CrossRef - Arterial Stiffness by Aerobic Exercise Is Related with Aerobic Capacity, Physical Activity Energy Expenditure and Total Fat but not with Insulin Sensitivity in Obese Female Patients with Type 2 Diabetes
Ji Yeon Jung, Kyung Wan Min, Hee Jung Ahn, Hwi Ryun Kwon, Jae Hyuk Lee, Kang Seo Park, Kyung Ah Han
Diabetes & Metabolism Journal.2014; 38(6): 439. CrossRef - Intermuscular Fat: A Review of the Consequences and Causes
Odessa Addison, Robin L. Marcus, Paul C. LaStayo, Alice S. Ryan
International Journal of Endocrinology.2014; 2014: 1. CrossRef - Relative Skeletal Muscle Mass Is Associated with Development of Metabolic Syndrome
Byung Sam Park, Ji Sung Yoon
Diabetes & Metabolism Journal.2013; 37(6): 458. CrossRef
 PubReader
 Cite
Cite


