Glucose Effectiveness from Short Insulin-Modified IVGTT and Its Application to the Study of Women with Previous Gestational Diabetes Mellitus
Article information

Abstract
Background
This study aimed to design a simple surrogate marker (i.e., predictor) of the minimal model glucose effectiveness (SG), namely calculated SG (CSG), from a short insulin-modified intravenous glucose tolerance test (IM-IVGTT), and then to apply it to study women with previous gestational diabetes mellitus (pGDM).
Methods
CSG was designed using the stepwise model selection approach on a population of subjects (n=181) ranging from normal tolerance to type 2 diabetes mellitus (T2DM). CSG was then tested on a population of women with pGDM (n=57). Each subject underwent a 3-hour IM-IVGTT; women with pGDM were observed early postpartum and after a follow-up period of up to 7 years and classified as progressors (PROG) or non-progressors (NONPROG) to T2DM. The minimal model analysis provided a reference SG.
Results
CSG was described as CSG=1.06×10⁻²+5.71×10⁻²×KG/Gpeak, KG being the mean slope (absolute value) of loge glucose in 10–25- and 25–50-minute intervals, and Gpeak being the maximum of the glucose curve. Good agreement between CSG and SG in the general population and in the pGDM group, both at baseline and follow-up (even in PROG and NONPROG subgroups), was shown by the Bland-Altman plots (<5% observations outside limits of agreement), and by the test for equivalence (equivalence margin not higher than one standard deviation). At baseline, the PROG subgroup showed significantly lower SG and CSG values compared to the NONPROG subgroup (P<0.03).
Conclusion
CSG is a valid SG predictor. In the pGDM group, glucose effectiveness appeared to be impaired in women progressing to T2DM.
INTRODUCTION
The term ‘glucose effectiveness’ has been used to indicate and quantify the processes that occur to normalize the glucose concentration during hyperglycemia, independently from any change in insulin concentration [1]. In fact, glucose per se has the ability to stimulate its own uptake and suppress its own production even at basal insulin concentrations [1], contributing to about 60% of all glucose disposal in normal human subjects and animals [123]. The role of glucose effectiveness in predicting possible future derangements of glucose tolerance has gained increasing interest in the last years and the available evidence has been recently reviewed by Alford et al. [4], concluding that a lower glucose effectiveness over time is a critical determinant of future glucose intolerance and type 2 diabetes mellitus (T2DM) in subjects at increased risk. Recent evidence has also shown that overweight and obese subjects, who are at recognized increased risk of developing T2DM, exhibit lower glucose effectiveness [5]. On this basis, specific therapies aimed at enhancing glucose effectiveness in at-risk or intolerant subjects may play an important role in preventing T2DM [4]. Such treatments may include sodium glucose cotransporter 2 (SGLT2) inhibitors, recently proposed as antidiabetic pharmacologic agents, which exert their function by acting directly on non-insulin-mediated processes [6]. Thus, quantification of glucose effectiveness should be performed to have a complete description of the glucose tolerance status.
The history of gestational diabetes mellitus (GDM) is one of the most representative conditions leading to the increased risk for developing glucose intolerance and eventually T2DM [7], thus suggesting regular follow-ups for early detection of possible deterioration of glucose tolerance. Women with previous GDM (pGDM), among several metabolic abnormalities, may also exhibit lower glucose effectiveness [8]. However, to the best of our knowledge, no study has focused on the analysis of glucose effectiveness in this population; specifically, possible alterations in glucose effectiveness after a follow-up period have never been explored in pGDM.
Originally, two tests were employed to assess glucose effectiveness: the hyperglycemic glucose clamp and the intravenous glucose tolerance test (IVGTT) with minimal model interpretation [39]. The estimation of glucose effectiveness provided by the minimal model, known as the SG index, has been proven to be reliable and equivalent to the one provided by the clamp technique [10]. Although less experimentally demanding compared to the clamp technique, the minimal model SG assessment requires a 3-hour IVGTT, specific skills, and dedicated computer programs for model parameter estimation. To overcome these limitations, a simple index, calculated SG (CSG), has been recently proposed, allowing the reliable assessment of SG without using complex mathematical models and resorting to a shorter—only 1-hour—IVGTT [11].
It has been shown that increasing the dynamics of the IVGTT may yield more accurate evaluation of the metabolic parameters. To this aim, an infusion of insulin can be added to the traditional IVGTT, a test termed the insulin-modified IVGTT (IM-IVGTT). This test is particularly recommended in subjects at increased risk of developing T2DM, such as women with pGDM, where the IM-IVGTT has been used to accurately assess possible defects in insulin sensitivity [12]. A simple index has already been proposed to assess insulin sensitivity [13] from the IM-IVGTT, but this has not been conducted for glucose effectiveness. Thus, the aims of this study were: (1) to derive—from a short IM-IVGTT—a simple surrogate marker (i.e., a predictor) of the SG; (2) to test the reliability of the derived surrogate marker in a population of women with pGDM; and (3) to analyze possible alterations in glucose effectiveness in this population, at baseline and after a follow-up period.
METHODS
Participants
This study has been granted the exemption from approval by Marche Regional Ethics Committee, being a retrospective analysis of datasets collected and published from previous studies [714151617181920]. Informed consent is not applicable due to a retrospective study. The original studies [714151617181920] were performed in agreement with the Declaration of Helsinki, were approved by the respective local ethics committees and all participants provided their informed consent.
Participants included subjects with different clinical characteristics, determining different glucose tolerance statuses: (1) nondiabetic subjects (ND, n=108), including subjects having normal glucose regulation and subjects affected by conditions causing a possible deterioration in glucose regulation (e.g., obesity) and (2) subjects with T2DM (n=73). These subjects represented the training dataset. Women with pGDM (n=57), already analyzed in a previous study [20], were also considered. All women were analyzed early postpartum (4 to 6 months after delivery) and then re-examined over a period of up to 7 years. All women were nondiabetic at the time of the first analysis (early postpartum). None of the women was treated with antidiabetic agents before the possible onset of T2DM.
All participants underwent a 3-hour IM-IVGTT, with an intravenous insulin infusion (0.03 to 0.05 U/kg) at 20 minutes after the glucose infusion (0.3 g/kg). Blood samples were collected during the 3-hour period, with frequent sampling during the first 30 minutes (typically at time 0, 3, 4, 5, 6, 8, 10, 14, 19, 22, 27, 30, 35, 40, 50, 70, 100, 140, 180 minutes), for the measurement of glucose and insulin concentrations. In some cases, blood samples were collected with a slightly different sampling protocol, resulting in the replacement of some of the reported samples with additional samples (e.g., at time 2, 12, 15, 20, 25, 60, 80 minutes). The women in the pGDM group underwent an IM-IVGTT both at baseline and at the last follow-up visit. Since some women developed T2DM during the study, they were divided into two groups: those progressing to T2DM (progressors [PROG]) and those remaining nondiabetic (nonprogressors [NONPROG]). For the PROG subgroup, the last follow-up visit was at the onset of the disease (shortly thereafter), whereas for the NONPROG subgroup, the last follow-up visit occurred at least 5 years after the first visit (up to a maximum of 7 years). The main characteristics of the participants are reported in Table 1.

Characteristics of the participants
Calculations and statistical analysis
In all participants, SG (1/min) was assessed by minimal model analysis of IM-IVGTT data [14]. The CSG (1/min) index was designed and validated on the indicated subjects with different clinical characteristics (ND and T2DM groups). The CSG design was performed through a stepwise model selection approach by optimizing the Akaike's information criterion, using the minimal model SG (1/min) as a dependent variable. As an independent variable, the rate of glucose disappearance KG (1/min)—normalized to the maximum of the glucose curve during the test Gpeak (mmol/L)—was assumed as the key factor for the prediction of SG, as previously demonstrated for regular IVGTT [11]. KG was computed as the mean value between KG1 and KG2, i.e., the slope (absolute value) of loge glucose multiplied by 100 in the 10–25- and 25–50-minute intervals, respectively, as already performed in a previous study assessing insulin sensitivity from the short IM-IVGTT [13]. The 25-minute time-point was selected since the insulin infusion took place at 20 minutes and lasted for approximately 1 minute; thus, 5 minutes could be a reasonable delay for exogenous insulin to act on glucose disappearance. Other independent variables included in the stepwise model selection were age, sex, body mass index (BMI), basal glucose, and insulin concentrations.
Similarly to other studies [1121], the CSG formulation obtained from the stepwise model selection was validated using the “jackknife” technique, which allowed for the estimation of index prospective accuracy when applied to an independent set of subjects [22]. To this purpose, one subject was removed from the dataset, and model coefficients were computed on the remaining subjects. Based on such model coefficients, a predicted CSG value was computed for the removed subject, and this was repeated for every subject. Furthermore, the derived CSG formula was then tested for the assessment of glucose effectiveness in the pGDM group (and in its related PROG and NONPROG subgroups), both at baseline and at follow-up.
To evaluate the degree of agreement between CSG and SG, Bland-Altman plots were computed. Finally, a Two One-Sided Test for equivalence (TOST) [1123], was performed to test the minimum equivalence margin (epsilon parameter) showing equivalence between SG and CSG.
After stratifying the pGDM group into the PROG and NONPROG subgroups, an unpaired Student t-test was performed to assess differences in SG and CSG at baseline and at follow-up.
Following the Kolmogorov-Smirnov test for normality, in the case of skewed distributions, tests were applied to the log-transformed values. Values are reported as mean±standard error of the mean, unless otherwise specified. Statistical analysis was performed in R V3.4.3 (The R Foundation for Statistical Computing Platform, Vienna, Austria). The two-sided significance level was set at 5% (P<0.05).
RESULTS
The stepwise model selection showed that, among all the tested explanatory variables, KG/Gpeak was the only variable that had a significant role in predicting the minimal model SG. Thus, the CSG formulation was:

The related Bland-Altman plots (in the training dataset and in the jackknife-obtained validation dataset) (Fig. 1) showed a substantial agreement between CSG and SG, with less than 5% of the data falling outside the limits of agreement and no fixed bias affecting CSG estimation (mean of SG–CSG not significantly different from zero). Furthermore, according to the TOST procedure, CSG and SG were shown to be equivalent both in the training and validation dataset, with small equivalence margins: epsilon was in fact equal to 0.1 standard deviation (SD) of SG in both cases.
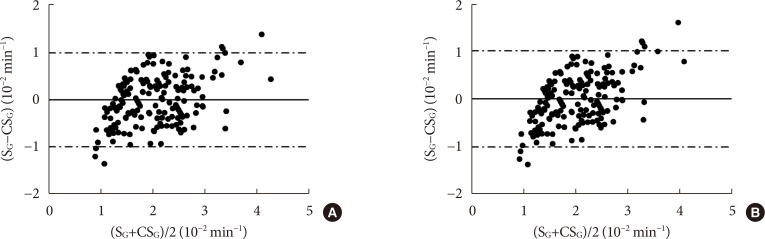
Bland-Altman plot for the training dataset (A) and the jackknife-based validation dataset (B) in a population of subjects with different clinical characteristics (nondiabetic [ND] and type 2 diabetes mellitus [T2DM] groups). The continuous line represents the mean of the difference between minimal model glucose effectiveness (SG) and calculated SG (CSG); the dash-dotted lines represent the limits of agreement (mean±1.96×standard deviation).
With regard to the pGDM group, the mean follow-up duration in the NONPROG subgroup was 5.2±0.1 years. In the PROG subgroup, the follow-up was interrupted at the onset of T2DM: the mean follow-up duration was 4.6±0.4 years. Notably, in our dataset, almost 80% (11 out of 14) of those women progressing to T2DM developed the disease within 5 years of follow-up.
In the pGDM group and in the related NONPROG and PROG subgroups, Bland-Altman plots at baseline and at follow-up (Figs. 2 and 3) showed substantial agreement between CSG and SG, again with less than 5% of the data falling outside the limits of agreement, with no fixed bias affecting CSG estimation. Also, in the pGDM group, CSG and SG were shown to be equivalent according to the TOST procedure, both at baseline and at follow-up, with the equivalence margin epsilon equal to 0.2 SD and 0.3 SD, respectively. In the NONPROG and PROG subgroups, at baseline, the epsilon was equal to 0.3 and 0.5 SD, respectively; at follow-up, the epsilon was equal to 0.5 and 1 SD, respectively.
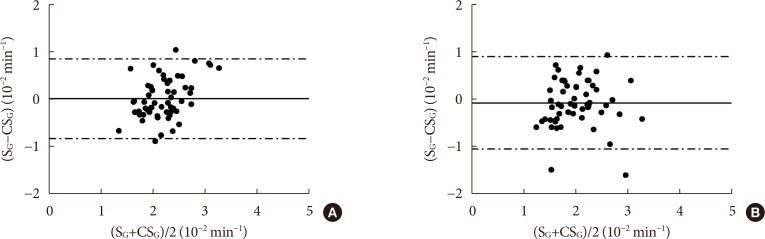
Bland-Altman plot for the previous gestational diabetes mellitus group (women) at baseline (A) and follow-up (B). The continuous line represents the mean of the difference between minimal model glucose effectiveness (SG) and calculated SG (CSG); the dash-dotted lines represent the limits of agreement (mean±1.96×standard deviation).

Bland-Altman plot for the (A) women not progressing to type 2 diabetes mellitus (NONPROG) and (B) women progressing to type 2 diabetes mellitus (PROG) subgroups at baseline and follow-up. The continuous line represents the mean of the difference between minimal model glucose effectiveness (SG) and calculated SG (CSG); the dash-dotted lines represent the limits of agreement (mean±1.96×standard deviation).
Glucose effectiveness values assessed by SG and CSG at baseline and at follow-up in the PROG and NONPROG subgroups are reported in Fig. 4. At baseline, the PROG subgroup showed significantly lower SG and CSG values compared to the NONPROG subgroup (P=0.01 and P<0.0001, respectively). Similar results were found at follow-up (P=0.03 and P<0.0001, respectively).
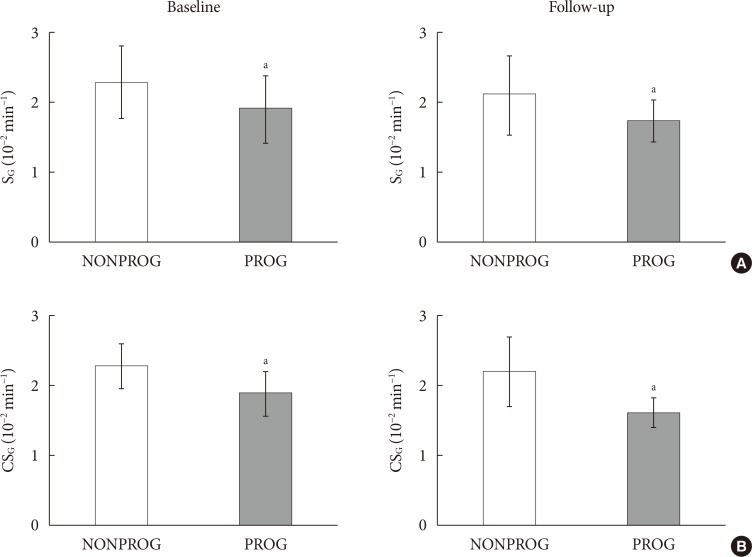
Glucose effectiveness assessed by (A) minimal model glucose effectiveness (SG) and (B) calculated SG (CSG) at baseline and follow-up in the women not progressing to type 2 diabetes mellitus at follow-up (NONPROG) and women progressing to type 2 diabetes mellitus (PROG) subgroups. Data are expressed as mean±standard error of the mean. aStatistically significant difference (P<0.05).
DISCUSSION
The present study proposed and validated a simple index for the assessment of CSG that predicts the minimal model SG, when a simple 1-hour IM-IVGTT is performed. IM-IVGTT may be preferred to the regular IVGTT in subjects with high insulin resistance, to obtain a more reliable estimation of this metabolic parameter [14242526]. The introduction of CSG, together with the previously proposed calculated insulin sensitivity (CSI) [13], overcomes the limitations of minimal model methodology, allowing a simple assessment of the two main processes regulating glucose disposal from a short, 1-hour, IM-IVGTT. The CSG index proposed in this study exhibited excellent performances on the general population ranging from normal glucose tolerance to T2DM, as shown by the Bland-Altman plot (Fig. 1) and by the results of the test for equivalence (TOST), showing an equivalence margin parameter much lower than the SD of SG.
The CSG index was then tested in a population of women with a previous history of GDM, commonly recognized for an increased risk of developing T2DM. This population was analyzed early postpartum and then re-examined up to 7 years later. To the best of our knowledge, this is the first study to analyze, in detail, the glucose effectiveness in women with pGDM, coupled with a specific focus on the possible differences of this metabolic parameter in women progressing to T2DM during a follow-up period, compared to women that did not progress to T2DM. As detected by values at baseline and at follow-up, we found that glucose effectiveness was significantly and chronically reduced in those women progressing to T2DM compared to women remaining nondiabetic (Fig. 4). These findings suggest that in this population of women who progress to T2DM, alterations in glucose effectiveness, together with the already well-known defects in insulin resistance and secretion, could contribute to the development of T2DM. In fact, results obtained in previous studies showed that glucose effectiveness independently predicts conversion to T2DM across ethnic groups, family history of T2DM, and obesity [27]. Notably, a substantial equivalence between SG and CSG was proven again by the Bland-Altman plots (Figs. 2 and 3) and by the TOST analysis (showing equivalence margin always not higher than one SD), both at baseline and at follow-up.
In a previous study, CSG was assessed from a regular 1-hour IVGTT [11]. Comparing the “regular” and the “insulin-modified” indices, one can notice that the formulation is essentially the same, i.e., the ratio between the rate of glucose disappearance, KG, and the maximum of the glucose curve during the test, Gpeak. This confirms the central role assumed by KG/Gpeak in the prediction of SG. Conversely, other regressors (sex, age, BMI, basal glucose, and insulin concentrations), which were proven to be relevant variables in other studies [28], were not able to improve the SG prediction.
The proposed CSG index was designed and validated on a general population, including subjects with glucose tolerance abnormalities, ranging from defective glucose regulation to overt T2DM, but also healthy subjects. Insulin administration during IM-IVGTT can induce transient hypoglycemia and a consequent counterregulatory response in healthy insulin-sensitive subjects, thus determining the inaccuracy of minimal model-based parameter estimation [29]. However, it was shown that this inaccuracy pertains only to SI and not to SG estimation [29], making inclusion of insulin-sensitive healthy subjects in CSG design an advantage rather than a disadvantage.
Since this study represents a post hoc analysis of datasets collected from previous studies, IM-IVGTT data were obtained according to different insulin administration protocols (i.e., 0.03 or 0.05 U/kg at 20 minutes). The choice to include data derived from different protocols has been justified by the observation that using different insulin doses and protocols during the IM-IVGTT does not affect the minimal model estimation of SG [30]. Also, KG estimation is not affected by the insulin dose [30]. Moreover, the sampling protocol was not exactly the same in all studies. Nonetheless, the obtained results have proven the robustness of the proposed CSG, which can be computed on the basis of somewhat different IVGTT protocols.
In this study, KG was computed as the mean value between KG1 and KG2, i.e., the rates of glucose disappearance before (10 to 25 minutes) and after (25 to 50 minutes) the insulin infusion, as previously carried out for CSI [13]. In the pGDM group, we analyzed the effect of replacing KG with KG1 in the equation (as above) for CSG assessment. Since samples drawn before the 25-minute are not influenced by insulin infusion, using KG1 rather than KG would mean resorting to a regular, very short, IVGTT. In that condition, CSG estimation was not equivalent to SG (results not shown), corroborating the hypothesis that IM-IVGTT may be superior to regular IVGTT; thus, it should be preferred when possible.
Important factors differentiating women at highest risk of progression to T2DM among all the pGDM women are family history of diabetes, certain ethnicities, age, early onset of GDM, hypertension during pregnancy, high BMI, insulin resistance, impaired β-cell function [31]. However, other possible markers for later risk of T2DM have been hypothesized recently. For instance, an increased circulating fatty acid-binding protein 4 (FABP4) has been shown to differentiate between women progressing to and those not progressing to T2DM after GDM [32]. In fact, circulating FABP4 has pleiotropic roles that include the stimulation of hepatic glucose production [33]. On the other hand, glucose effectiveness is defined as the ability of glucose per se to stimulate its own uptake, but also to suppress its own production [1]. Thus, the lower glucose effectiveness characterizing the pGDM women progressing to T2DM may reflect, among other factors, increased levels of FABP4, which have shown to be a condition of risk for T2DM progression [32]. However, further studies are required to corroborate this hypothesis.
It is also worth noting that all the subjects included in this study were white Caucasians, and hence, the application of CSG to assess glucose effectiveness in other ethnicities (e.g., Asian subjects) has to be tested.
In conclusion, this study developed a simple index for the assessment of glucose effectiveness when an IM-IVGTT is performed. Testing the new index, CSG, in a population of women with a previous history of GDM confirmed the index reliability in a category of subjects at a particularly high risk for developing T2DM. Since glucose effectiveness appears to be impaired in this population of subjects progressing to T2DM development, its simple and reliable quantification by CSG may facilitate a timely assessment of this aspect of glucose metabolism, thus possibly prompting corrective actions that have now become available with pharmacological agents, such as SGLT2 inhibitors, which act independently on insulin.
ACKNOWLEDGMENTS
We would like to thank Angelo Avogaro (University of Padova, Italy), Bernhard Ludvik (Wiener Krankenanstaltenverbund, Austria), John J. Nolan (Trinity College Dublin, Ireland), and Donal O'Gorman (Dublin City University, Ireland) for granting the permission to use the data collected in previous studies.
Notes
CONFLICTS OF INTEREST: No potential conflict of interest relevant to this article was reported.
AUTHOR CONTRIBUTIONS:
Conception or design: M.M., G.P., A.T.
Acquisition, analysis, or interpretation of data: M.M., C.C., C.G., A.K.W., G.P., L.B., A.T.
Drafting the work or revising: M.M., C.C., C.G., A.K.W., G.P., L.B., A.T.
Final approval of the manuscript: M.M., C.C., C.G., A.K.W., G.P., L.B., A.T.
