Unusual Suspects in the Development of Obesity-Induced Inflammation and Insulin Resistance: NK cells, iNKT cells, and ILCs
Article information

Abstract
The notion that obesity-induced inflammation mediates the development of insulin resistance in animal models and humans has been gaining strong support. It has also been shown that immune cells in local tissues, in particular in visceral adipose tissue, play a major role in the regulation of obesity-induced inflammation. Specifically, obesity increases the numbers and activation of proinflammatory immune cells, including M1 macrophages, neutrophils, Th1 CD4 T cells, and CD8 T cells, while simultaneously suppressing anti-inflammatory cells such as M2 macrophages, CD4 regulatory T cells, regulatory B cells, and eosinophils. Recently, however, new cell types have been shown to participate in the development of obesity-induced inflammation and insulin resistance. Some of these cell types also appear to regulate obesity. These cells are natural killer (NK) cells and innate lymphoid cells (ILCs), which are closely related, and invariant natural killer T (iNKT) cells. It should be noted that, although iNKT cells resemble NK cells in name, they are actually a completely different cell type in terms of their development and functions in immunity and metabolism. In this review, we will focus on the roles that these relatively new players in the metabolism field play in obesity-induced insulin resistance and the regulation of obesity.
INTRODUCTION
The prevalence of obesity has increased dramatically recently, both in the United States (in 2011, 33.7% of men and 36.5% of women in the United States were obese) and worldwide (in 2014, 10.8% of men and 14.9% of women were obese) [12]. Obesity imposes a tremendous health burden on society because it associates strongly with many diseases, including cardiovascular disease and immunological disorders such as rheumatoid arthritis and multiple sclerosis. Obesity is also considered to be the main cause of insulin resistance and type 2 diabetes mellitus (T2DM). Recent studies suggest that one of the mechanisms that drive the development of insulin resistance and T2DM is obesity-induced inflammation [3], and that this inflammation is mainly mediated by immune cells in local tissues, in particular adipose tissue [4]. Moreover, it has been shown that adipose tissues contain many different types of immune cells and that obesity changes the numbers and activation status of these cells.
Obesity-induced inflammation shares many of the characteristics of more classical examples of inflammation such as infection-induced inflammation. For example, in the classical immunology field, immune system responses are often classified into two categories, namely, innate immunity and adaptive immunity. These two distinct but related arms of the immune system also operate in obesity-induced inflammation.
INNATE IMMUNITY VERSUS ADAPTIVE IMMUNITY
The innate and adaptive arms of the immune system are designed to protect the organism from the harmful insults of foreign agents, including viruses, bacteria, and the pathogenic products of foreign microorganisms. This protection can be achieved by innate immune responses that clear away the dangerous viruses and bacteria during infection, remove the host cells that are affected by these pathogens, and repair the tissue damage that has arisen during the infection. Later during the infection, the host also mobilizes adaptive immunity. Thereafter, the adaptive arm of the immune system prepares for the next infection with the same pathogen.
It is crucial that, while the host is defending itself from the infection, its immune system does not also attack the host. Thus, it is essential that the immune defense system can differentiate between “self ” and “non-self.” Both the innate and adaptive arms of the immune system are endowed with such discriminatory ability, and thus can respond specifically to foreign insults alone. However, they use different molecular and cellular mechanisms (Fig. 1).

Innate immunity versus adaptive immunity. NK, natural killer; ILC, innate lymphoid cell; NKT, natural killer T; DC, dendritic cell.
Innate immunity
Innate immunity refers to a set of immediate responses to infections with pathogens [5]. The two major players are neutrophils and macrophages. They not only directly remove pathogens by phagocytosis; they also respond to pathogen-derived pathogen-associated molecular patterns (PAMPs) (e.g., lipopolysaccharide and bacterial flagellin) and host cell-derived danger-associated molecular patterns (DAMPs) (e.g., chromatin-associated protein high-mobility group box 1, DNA, and hyaluronan fragment). When neutrophils and macrophages encounter these PAMPs or DAMPs, their cell-surface toll-like receptors (TLRs) or intracellular nucleotide-binding oligomerization domain (NOD)-like receptors (NLRs) bind to these molecules. These binding events induce the neutrophils and macrophages to secrete various chemokines (e.g., chemokine [C-C motif] ligand 2 [CCL2]) and cytokines (e.g., tumor necrosis factor α [TNFα] and interleukin 6 [IL-6]) that mediate the recruitment and activation of other immune cells. These cells in turn initiate secondary cascades of immune responses, including adaptive immune responses. The cytokines produced by neutrophils and macrophages can also induce the apoptosis of infected cells. Hence, innate immune responses are not specific for particular invading pathogens. They are also immediate and short-lived.
Adaptive immunity
In adaptive immunity, pathogens are engulfed by antigen-presenting cells (APCs) and their antigens are digested. The resulting pathogen-derived peptides bind to major histocompatibility complex (MHC) molecules within the APCs. The peptide/MHC complexes are then presented on the APC surface, where they interact with the T cell receptor (TCR) on T cells. There are two types of MHCs, namely, MHC I and II, and their roles in adaptive immunity differ markedly. MHC I is expressed ubiquitously on all cell types, whereas MHC II expression is limited to specific APCs, namely, macrophages, dendritic cells (DCs), and B cells. Moreover, antigen/MHC I complexes are only recognized by the TCRs on CD8 T cells. This allows CD8 T cells to identify the pathogen-infected cells and kill them directly by cytotoxic mechanisms. By contrast, antigen/MHC II complexes only interact with the TCRs on CD4 helper T cells. These interactions activate the CD4 T cells and induce their elaboration of cytokines, which shape the activation and functions of other immune cells. Another function of CD4 T cells is that they bind to B cells and thereby help them make antibodies. Thus, B cells take up pathogen antigens via their B cell receptor (BCR), which is a specific surface immunoglobulin. The antigen is then processed and presented as an antigen/MHC II complex. The binding of the TCR to this complex causes the B cells to proliferate, mature, and produce antibodies against the pathogen-derived antigen. Since all T cells and B cells are clonal (i.e., TCRs and BCRs only recognize a single specific antigen peptide) and the MHCs on APCs can only bind peptides with a specific pattern of amino acids, the adaptive immune system is highly specific for the pathogen. This feature sets it apart from innate immunity, which is highly non-specific. Another extremely important difference between innate and adaptive immunity is that adaptive immunity has memory. This is the hallmark of this arm of the immune system. Memory arises as follows: when the host is infected with a pathogen for the first time, pathogen-specific clonal CD4 and CD8 T and B cells expand and help to clear the pathogen. Thereafter, the numbers of these cells drop, leaving only a small number of memory T and B cells to patrol the body of the host. When the same pathogen infects the host again, these memory T and B cells expand rapidly and differentiate into effector cells that eradicate the pathogens and infected cells anew. This secondary response is much faster and more effective than the primary response. Thus, the adaptive immune system is not only highly specific for single antigens of the pathogen; it remembers the first insult and, when exposed to it again, eliminates it with great efficiency.
Innate immunity, adaptive immunity, and insulin resistance
Adipose tissues contain many different immune cell types from both the innate and adaptive arms of the immune system. The innate immune cells include adipose tissue macrophages (ATMs), neutrophils, and mast cells, while the adaptive immune cells include T and B cells and DCs. Most studies on obesity-induced inflammation have focused on aspects of the innate immune system in adipose tissue. Specifically, they examined the role of inflammatory mediators, including proand anti-inflammatory cytokines, in the development of obesity-induced inflammation and insulin resistance [4]. ATMs play a central role in the production of these inflammatory mediators [6]. In the lean condition, ATMs are the most abundant cells in adipose tissue, and obesity increases these numbers further. Moreover, obesity alters the ATM phenotype from the anti-inflammatory M2 phenotype to the proinflammatory M1 phenotype [7]. This change causes the ATMs to express many proinflammatory cytokines, including TNFα and IL-1β [8]. Strong evidence for this obesity-induced change in ATM phenotype has been obtained by studies using several myeloid cell-specific mouse models that are generated using LysM-Cre mice, including myeloid cell-specific Ikkb knockout mice [9].
Nevertheless, other studies suggest that adaptive immunity also plays a role in the development of obesity-induced inflammation: modulating the numbers of Th2 CD4 T cells, CD8 T cells, regulatory T cells (Tregs), B cells, and DCs in mice alters their development of obesity-induced inflammation and insulin resistance [4]. Furthermore, recent studies show that deleting MHC II in adipocytes or myeloid cells (thereby crippling the adaptive immune system) improves obesity-induced inflammation and insulin resistance [1011]. However, it is not yet clear which cell types play the more critical role in the antigen presentation that drives adaptive immune responses in obesity. Moreover, it is not clear what, if any, the antigens are. In any case, the latter studies suggest that obesity-induced inflammation may actually be an antibody-mediated chronic immune disease, and possibly even an autoimmune disease. However, it should be strongly emphasized that this notion remains speculative and further studies are needed to validate it. Moreover, it should be noted that, in many cases, these modulations of the expression of a specific protein in mice (including knocking out MHC II) also change the body and/or fat weights of the mice. Since these changes can secondarily modulate insulin resistance in obesity, these results should be interpreted with caution.
Immune cells that participate in both innate and adaptive immunity
In general, immune cells are exclusively categorized as being either innate or adaptive immune cells. However, many cells also play roles in both arms of the immune system. These cells include natural killer (NK) cells, invariant natural killer T (iNKT) cells, and innate lymphoid cells (ILCs) (Fig. 1). While all of these cells produce many different cytokines that regulate innate immunity, these cytokines also help to shape the development of adaptive immunity. Moreover, recent studies show that NK cells have memory, namely, they can recognize a specific antigen that they have seen before and respond much more vigorously when encountering it than they did when they first saw it [1213]. iNKT cells are a subset of CD3 T cells. They recognize lipid antigens presented by CD1d, which is a non-polymorphic MHC 1 molecule. While the lipid antigens that are recognized by iNKT cells have not been identified, the features of iNKT cells suggest that they are likely to have memory as well [14]. ILCs are newly identified cell types that closely resemble NK cells. Recent studies indicate that all three cell types in adipose tissues may play important roles in the development of obesity-induced inflammation and insulin resistance. Since there are many excellent reviews on the contributions of classical innate and adaptive immune cells to obesityinduced inflammation and insulin resistance, we will focus on NK cells, iNKT cells, and ILCs in this review.
NATURAL KILLER CELLS
NK cells are a very specialized subset of lymphocytes that are commonly identified as CD3– NK1.1+ [1213]. Other common markers for NK cells are NKp46 (natural cytotoxicity triggering receptor 1 [NCR1] or CD335) and CD49b (DX5). NK cells were first identified in 1975 due to their ability to kill tumor cells without previous priming [15]. Thus, the main function of NK cells is to kill tumor cells and infected cells via their cytolytic activity: this activity is mainly mediated by the perforin and granzymes that are released in granules by the NK cells [1213]. However, another major function of NK cells is to produce large quantities of various inflammatory mediators. These immune modulators include both pro- and anti-inflammatory cytokines (e.g., TNFα, interferon γ [IFNγ], and IL-10), growth factors for immune cells (e.g., granulocyte-macrophage colony-stimulating factor and granulocyte-colony stimulating factor), and chemokines (CCL2, RANTES [Regulated on Activation, Normal T Cell Expressed and Secreted], and IL-8). Although these mediators can regulate cytotoxicity, they are also important for promoting the migration and proliferation, development, maturation, activation, and polarization of other immune cells. For example, NK cells secrete IFNγ, which promotes DC activation and the polarization of CD4 T cells and macrophages toward Th1 and M1 phenotypes, respectively.
NK cell development and maturation
In the adult mouse, NK cells develop in the bone marrow. Thus, hematopoietic stem cells in the bone marrow differentiate into common lymphoid progenitor (CLP) cells, which in turn differentiate into T and B cells or NK cell precursors (NKPs). The NKPs then become immature NK (iNK) cells and eventually CD11b+ CD27+ mature NK (mNK) cells. The latter differentiation processes are regulated by E4BP4/NFIL3 (nuclear factor interleukin-3-regulated protein) and Eomes, respectively. E4BP4/NFIL3 is a particularly critical transcription factor in NK cell development. For this reason, E4BP4/NFIL3 knockout mice are often used to study the roles of NK cells in various settings [16]. The CD11b+ CD27+ mNK cells egress from the bone marrow into the circulation and then migrate to local tissues. There, the NK cells mature further and become activated into CD11b+ CD27– NK cells. Moreover, under inflammatory conditions, NK cells can proliferate in local tissues.
The local maturation, activation, and proliferation of NK cells are regulated by IL-12, IL-15, and IL-18, which are derived from DCs or macrophages [1213]. The role of IL-15 in NK cell activation and proliferation is particularly well understood [17]. IL-15 complexes with IL-15 receptor α subunit (IL-15Rα) on DCs or macrophages, and these complexes are trans-presented to the IL-15 receptor components on NK cells. The IL-15 receptor is composed of several subunits, including IL-2Rγ, which is also part of many other cytokine receptor complexes, including the IL-2 receptor.
NK cell receptors
NK cells differ from the more common T and B lymphocytes in that they do not have antigen-specific receptors (TCR and BCR, respectively). Instead, they have inhibitory and activating receptors that recognize “self” and “non-self,” respectively [1213]. The inhibitory receptors recognize the native MHC class I proteins that are expressed on all normal cells. Cells expressing native MHC I (that does not present antigen) are recognized as “self,” and NK cells take no action. However, if cells do not express native MHC I, they are seen by the NK cells as foreign and are killed. By contrast, the activating receptors recognize “non-self” molecules on native cells. Thus, even if a cell expresses native MHC I, the presence of non-self molecules (such as viral proteins) will induce the NK cell to kill it. NK cells also express TLRs, which themselves recognize various bacterial and viral products. In addition, NK cells express CD16, which recognizes the Fc domain of antibodies and therefore antibody-coated cells. The engagement of the TLRs or CD16 with their ligands causes the NK cells to kill the ligand-bearing target cell.
Recent studies in hypersensitivity and viral infection have identified new features of NK cells. These studies suggest that NK cells have “memory,” which is considered to be a central feature of adaptive immunity [13]. Thus, when mice were challenged with an immunological insult and subsets of NK cells from these mice were adoptively transferred into naïve mice, these NK cells had characteristics of memory: when the recipient was challenged with the same insult, the NK cells expanded rapidly and their immune response was greater than that seen in the donor mice during the first exposure to the insult. In addition, the transferred NK cells homed to the tissue from which they had been harvested in the recipient mice. Furthermore, it has been shown that the activating Ly49H NK cell receptor plays an important role in the memory of NK cells in cytomegalovirus infection.
NK cells in insulin resistance and T2DM
NK cells play an important role in infection because they kill infected cells [12]. Moreover, NK cells can kill cancer cells in humans [18]. This ability is the subject of intense research interest at present: there are currently more than 200 clinical trials on the clinicaltrial.gov site that are investigating NK cell immunotherapy in cancer.
Of particular interest in this review, NK cells also participate in the development of insulin resistance and T2DM, presumably because of their capacity to produce large amounts of cytokines such as IFNγ. However, this role of NK cells has only recently started to attract attention from researchers.
Association of NK cells with human obesity and T2DM
Several studies have found that human obesity and/or T2DM associate with changes in the number and activity of NK cells. However, these studies have discrepant results. Most studies found that obese or T2DM patients exhibit higher numbers and/or activation of NK cells in the circulation or adipose tissue than control subjects [1920212223242526272829]. However, a few other studies observed decreases or no changes [303132]. This discrepancy may relate to the fact that, in the latter studies, NK cell frequencies were normalized by the number of total leukocytes (CD45+) or lymphocytes. This variable may be misleading because obesity dramatically increases total leukocyte and neutrophil numbers in the circulation and the macrophage numbers in adipose tissues. Thus, if NK cell numbers rise on obesity, this would not be observed readily if these numbers are expressed as a percentage of total leukocyte numbers. This is supported by studies on children with obesity-related hepatosteatosis: while these children had higher absolute NK cell numbers than the control children, this difference disappeared when these numbers were converted to percentages of total leukocytes [2833]. Furthermore, in most of the studies that showed obesity increases NK cell counts in the circulation or adipose tissue, absolute NK cell counts were used [19202122232425262728]. Interestingly, when bariatric surgery or calorie restriction results in weight loss, the absolute circulating NK cell numbers also drop [233334].
Other evidence showing that NK cells are altered by obesity in humans includes the finding that circulating NK cells from obese and unhealthy subjects have more DNA methylation than the NK cells from lean and healthy subjects: this suggests that transcription of NK cells in obese and T2DM patients are differently regulated [24]. Furthermore, homozygotes for NK cell immunoglobulin-like receptor (KIR) haplotype A have a greater risk of T2DM (odds ratio, 7.97) [35]. Since KIRs are mainly inhibitory receptors that bind to MHC I, this observation suggests that the cytotoxic activity of NK cells may associate with risk of T2DM. Interestingly, the cytotoxic activity of the circulating NK cells is decreased in obese humans [2730].
The role of NK cells in the development of obesity-induced insulin resistance in rodent models
Obese mice also exhibit higher NK cell numbers in the adipose tissue than lean mice [20363738394041], unless the NK cell numbers are presented as a percentage of leukocytes or stromal vascular cells: in this case, obesity associates with decreased frequencies of adipose NK cells [4243]. Thus, the human and animal studies together strongly suggest that obesity elevates NK cell numbers. This consistent association led to speculation that NK cells may participate in the development of obesity-induced insulin resistance.
Our recent animal model study strongly supports this notion [39]. One of the approaches that we used to test this was to deplete NK cells by injecting a specific antibody against a NK cell-specific surface marker, namely, NK1.1. In the classical immunology field, this approach is often used to determine the in vivo roles of NK cells. We found that depleting NK cells with an anti-NK1.1 (PK136) antibody improved insulin resistance under high fat diet (HFD) conditions (60% HFD). The Polic group also observed this effect of PK136-mediated NK cell depletion on insulin resistance [41]. In lean conditions, this depletion did not change the metabolic phenotypes [3941]. Importantly, the antibody-mediated NK cell depletions did not alter body weight or obesity. However, anti-NK1.1 antibodies also recognize another immune cell type, namely, iNKT cells. For this reason, the Polic group used a lower dose of anti-NK1.1 antibody: this depletes NK cells without markedly depleting iNKT cells [41]. In our study, we addressed this issue by examining whether knocking out iNKT cells affected metabolic phenotypes. Compared with control mice, iNKT cell knockout mice did not differ in terms of body and fat weights, fasting glucose and insulin levels, or glucose or insulin tolerance test (GTT and ITT, respectively) results under both obese and lean conditions [39]. Thus, iNKT cell deletion did not affect metabolic phenotypes in our lab, meaning that the improved metabolic phenotypes seen in wild-type animals after anti-NK1.1 injection were due to NK cell depletion rather than iNKT cell depletion (see the following section on iNKT cells as well). Nevertheless, to validate these results further, we employed another NK cell-specific antibody to deplete NK cells, namely, the anti-asialo ganglio-N-tetraosylceramide (asialo-GM1) antibody that recognizes NK cells, but not iNKT cells [39]. The results were identical to those of the PK136 antibody experiments: the NK cell depletion improved HFD-induced insulin resistance. In addition, we assessed the effects of genetic NK cell deficiency on HFD-induced insulin resistance using E4bp4/Nfil3 knockout mice [39]. Homozygous E4bp4/Nfil3 knockout mice, which had ~5% of the NK cells seen in wildtype mice, showed improved insulin resistance under the HFD condition alone. However, their body and fat weights were also significantly decreased in HFD conditions, which made it difficult to interpret the insulin resistance results. We therefore examined heterozygous E4bp4/Nfil3 knockout mice, which have only 50% of the NK cell numbers seen in normal chowfed and HFD-fed wild-type mice and do not exhibit any differences from wild-type mice in terms of fat and body weights. When we examined the metabolic status of these heterozygous E4bp4/Nfil3 knockout mice on a HFD, they exhibited improved insulin resistance [39]. Notably, this effect was only observed after 9 weeks on a HFD. This suggests that NK cells participate in the regulation of obesity-induced insulin resistance at the late stage of obesity only.
Our results are further validated by the study of O'Rourke et al. [44]. They used mice that specifically express diphtheria toxin receptor (DTR) in NK cells. Hence, injections of low doses of diphtheria toxin specifically kill the NK cells in these mice. When these mice were fed a HFD and then injected with diphtheria toxin, they exhibited a mild improvement in ITT. However, changes in fasting glucose and insulin levels and GTT results were not observed [44]. It is not clear why only mild improvements in obesity-induced insulin resistance were observed: much stronger effects were observed when NK cell numbers were reduced using neutralizing antibodies or E4bp4/Nfil3 haplodeficiency [3941]. It may be due, at least in part, to the side-effects of diphtheria toxin, which are well-known to include loss of body weight.
We also used the opposite approach to assess the role of NK cells in insulin resistance, namely, we expanded NK cells in vivo. In the classical immunology field, the most commonly used NK cell-expanding technique is to inject IL-15. Alternatively, because cells are presented with IL-15 after it complexes with an IL-15Rα, NK cells can be expanded by injecting animals with a pre-assembled IL-15/IL-15Rα complex. However, the latter approach is limited by the fact that long-term injections with IL-15/IL-15Rα complexes cause NK cell exhaustion, resulting in the expansion of non-functional NK cells [45]. Hence, we injected our mice with a low dose of IL-15 alone. This expands NK cell numbers by 2- to 3-fold, which is equivalent to the NK cell numbers seen in HFD conditions [39]. We found that such NK cell expansion worsened HFD-induced insulin resistance. We also found that reconstituting NK cell-deficient E4bp4/Nfil3 homozygous knockout mice with wild-type NK cells from HFD-fed mice exacerbated their obesity-induced insulin resistance [39].
In summary, our results [39], together with those of the Polic group and O'Rourke et al. [4144], strongly indicate that NK cells play an important role in the development of obesity-induced insulin resistance, especially at the late stage of obesity.
Regulation of epididymal NK cell numbers and activation by obesity
Our study and those of the Polic group and O'Rourke et al. [394144] also examined the mechanism by which NK cells may promote the development of obesity-induced inflammation and insulin resistance. First, we all showed repeatedly that, although multiple tissues were examined, obesity only increased the activation of NK cells in the epididymal fat. Indeed, changes in NK cell activation were not even observed in the subcutaneous fat [394144]. The Polic group found that obesity altered the cytokine production of NK cells: this change was only observed in the epididymal fat. Specifically, they found that, 2 to 4 weeks after starting HFD feeding, the epididymal NK cells produced about 2-fold more IFNγ than the equivalent cells from mice fed with normal chow [41]. IFNγ is the classical signature cytokine of NK cells. Similarly, we found that epididymal NK cells also express higher levels of IFNγ at a later stage of obesity, namely, 12 weeks of HFD feeding. However, this increase was only due to a relatively small rise in the numbers of these cells (~4%): the production of IFNγ by the individual IFNγ-expressing NK cells did not change [39]. By contrast, we found that, at the same later stage of obesity, there was a dramatic increase in both the numbers of TNFα-expressing epididymal NK cells (~60% of all epididymal NK cells from HFD-fed mice expressed TNFα versus 10% of the cells from control animals) and the production of TNFα by individual epididymal NK cells (6-fold higher relative to control NK cell production). A small increase in IL-6-producing NK cells (~4%) was also observed at the later stage of obesity. However, like IFNγ, the HFD did not alter the amount of IL-6 that was produced by the individual IL-6-producing cells [39]. Hence, our study together with that of the Polic group suggests that, while early stages of obesity associate with increased NK cell production of the classical signature cytokine of NK cells (i.e., IFNγ), TNFα becomes the major NK cell cytokine when obesity becomes more severe [3941].
Second, the studies by all three groups consistently showed that obesity only increased the number of NK cells in the epididymal fat. Again, changes in NK cell numbers were not even observed in the subcutaneous fat [394144]. Local NK cell numbers are regulated by recruitment of NK cells from the circulation and/or by local proliferation of tissue resident NK cells. We and the Polic group have evidence that suggests that obesity regulates the NK cell numbers in the epididymal fat by inducing both recruitment and local proliferation. Thus, our study showed that obesity increased the ATM expression of genes that encode NK cell-attracting chemokines (e.g., Ccl3, Ccl4, and Cxcl10) [39]. Furthermore, when we intravenously transferred splenic NK cells from obese wild-type mice into HFD-fed E4bp4/Nfil3–/– mice, the transferred NK cells were found in the epididymal fat. This shows that NK cells can migrate to the epididymal fat. These two lines of evidence together suggest that obesity increases the epididymal recruitment of NK cells from the circulation. On the other hand, the Polic group showed that obesity increased the frequency of Ki67+ NK cells and EdU (5-ethynyl-2′-deoxyuridine) incorporation in the epididymal fat [41]. Since both are markers of proliferation, this suggests that there is local NK cell proliferation in the epididymal fat under HFD conditions. This is further supported by our finding that obesity elevates the epididymal ATM expression of the Il15 cytokine, which, as described above, plays an important role in NK cell development, proliferation and activation. We also observed that the increased expression of Il15 in obesity was only observed in the epididymal fat: it was not observed in any other tissues, including the subcutaneous fat [39]. These results together suggest that obesity increases the expression of IL-15 in epididymal ATMs only, and that this in turn induces the resident NK cells in the epididymal fat to proliferate. It may also activate these cells. Thus, obesity may activate ATMs, which in turn promote the epididymal recruitment and local proliferation of NK cells.
In addition, the Polic group found that the obesity-induced activation of epididymal NK cells may involve an as-yet-unknown ligand for NCR1 on adipocytes [41]. NCR1 is a receptor on NK cells: when it is ligated, it potently activates NK cells. The Polic group showed that obesity upregulates the expression of the unknown ligand on adipocytes and that this induces epididymal NK cells to produce IFNγ. They also showed that this chain of events promotes the development of insulin resistance, as follows. First, while HFD-fed Ifng homozygous knockout mice exhibit decreased glucose intolerance compared with wild-type controls, their glucose tolerance is impaired and their insulin resistance rises when wild-type, but not NCR1-deficient, NK cells are adoptively transferred. Second, obesity-induced insulin resistance improves when HFD-fed mice are injected with an NCR1-immunoglobulin fusion protein that blocks NCR1 ligand binding. These observations suggest that, along with ATMs, epididymal adipocytes may also play a role in the activation of NK cells in obesity [41].
Thus, the fact that obesity only increases the numbers and cytokine production of NK cells in the epididymal fat suggests that epididymal NK cells may play a specific role in the development of obesity-induced inflammation and insulin resistance.
Regulation of epididymal adipose tissue and ATM inflammation by NK cells
The two main functions of NK cells are cytotoxicity and the regulation of other immune cells. However, the cytotoxic function of NK cells does not appear to mediate their regulation of obesity-induced inflammation because obesity does not alter NK cell cytotoxicity in mice [41]. This is in line with the observation that, in obese humans, the cytotoxic activity of the circulating NK cells is decreased [2730]. Moreover, while the perforin in the cytotoxic pathway does participate in obesityinduced insulin resistance, CD8 T cells, not NK cells, appear to be its main source [46]. These observations suggest that NK cells regulate obesity-induced inflammation by regulating other cells via cytokine/chemokine secretion.
This notion is supported by our study: we showed that modulating NK cell numbers in obesity shapes the numbers and/or activation of ATMs in a predictable manner [39], as follows. First, we showed that modulating NK cells alters the ATM inflammatory phenotype (M1 polarization), as indicated by CD11c expression analyses. These changes are seen in the epididymal fat only. Thus, antibody-mediated NK cell depletion and E4bp4/Nfil3 deletion decreased epididymal CD11c+ ATM numbers while IL-15-mediated expansion of NK cells and NK cell reconstitution in E4bp4/Nfil3 homozygous knockout mice increased them [39].
Second, we showed that, when NK cells were depleted by GM1 antibody injections, the sorted ATMs exhibited down-regulated expression of proinflammatory genes, including Tnf, Il1b, and Itgax (which encodes CD11c), and upregulated expression of Il10 (an anti-inflammatory gene) and Arg1 (an M2 marker gene) [39]. Moreover, when the neutralizing GM1 antibody was substituted by the control immunoglobulin G and the NK cell numbers were allowed to recover, this pro/anti-inflammatory pattern in the ATMs was reversed: proinflammatory gene expression rose while anti-inflammatory and M2 marker gene expression was downregulated. Modulating NK cell numbers also shaped the inflammatory gene expression in the total epididymal fat: loss of NK cells decreased epididymal Tnf and Il6 gene expression while NK cell expansion increased it. Importantly, these changes in inflammatory mediator gene expression were not observed in any other tissue, including the subcutaneous fat. Notably, we found that modulating NK cell numbers in obesity did not alter the Ifng gene expression in any tissue, including the epididymal fat. Indeed, even a HFD did not upregulate Ifng gene expression in any tissue. This supports the notion proposed above that NK cell-derived TNFα may be the primary proinflammatory mediator that regulates obesity-induced inflammation and insulin resistance [39].
Third, we found that modulating NK cells not only alters epididymal ATM numbers; it also affected the epididymal fat expression of Ccl2, which encodes a chemokine that attracts monocytes. Again, this effect was not observed in any other tissue [39]. By contrast, modulating NK cell numbers did not affect the expression of another macrophage chemokine gene, Cx3cl1, in any of the tissues. Hence, our study suggests that NK cells may specifically regulate epididymal ATM numbers by controlling Ccl2 gene expression. Interestingly, modulating NK cell numbers did not change the macrophage numbers in other tissues, including the subcutaneous fat. It also did not affect the numbers of other immune cell types in any of the tissues, including the epididymal fat. Thus, the effect of NK cells seems to be specific for macrophage numbers in epididymal fat only.
Our findings are partly supported by the study by the Polic group: they too found that antibody-mediated NK cell depletion in obesity influences ATM polarization (CD11c expression) [41]. However, they did not detect changes in the overall ATM numbers. By contrast, O'Rourke et al. [44] showed that, when NK cells in HFD-fed NCR1-DTR mice were depleted by injecting diphtheria toxin, the total epididymal ATM numbers decreased without changing the CD11c+ (M1) or CD206+ (M2) ATM numbers. Interestingly, they found that NK cell depletion decreased the numbers of double-negative (CD11c– CD206–) ATMs [44]. Although it is not clear why our study [39] and those of the Polic group and O'Rourke et al. [4144] showed different results, it may reflect differences in mouse models and the durations for the HFD treatments that were employed in these studies.
Model for the NK cell-mediated regulation of obesity-induced inflammation and insulin resistance
Our study and those of the Polic group and O'Rourke et al. [394144] suggest that NK cells regulate obesity-induced inflammation and insulin resistance via the following mechanism. As obesity increases, ATMs become activated and produce chemokines that recruit NK cells from the circulation. This increases the NK cell numbers in epididymal fat (Fig. 2A). In addition, the obese ATMs produce IL-15, which promotes NK cell proliferation and activation. Adipocytes also produce an as-yet-unknown ligand for NCR1 that directly activates the NK cells in epididymal fat (Fig. 2A). As the activated NK cell numbers in the epididymal fat rise, these cells start to cross-regulate the numbers and activation of ATMs, as follows. First, the NK cells mediate the epididymal production of CCL2, which recruits circulating monocytes into the epididymal fat (Fig. 2B). This increases the ATM numbers in the epididymal fat. Second, the epididymal NK cells secrete proinflammatory cytokines, notably TNFα, but also IFNγ, which lead to the full activation of ATMs (Fig. 2B). This vicious cycle of escalating inflammatory stimuli and responses between ATMs and NK cells induces adipose tissue inflammation in obesity, and eventually adipocyte insulin resistance (Fig. 2C). Notably, while our study showed that modulating NK cell numbers does not affect liver and muscle inflammation [39], the study by the Polic group and our study found that modulating NK cell numbers does affect the insulin sensitivity of these tissues [3941]. Hence, epididymal fat produces mediators that can regulate insulin resistance in liver and muscle, which eventually leads to the development of systemic insulin resistance.
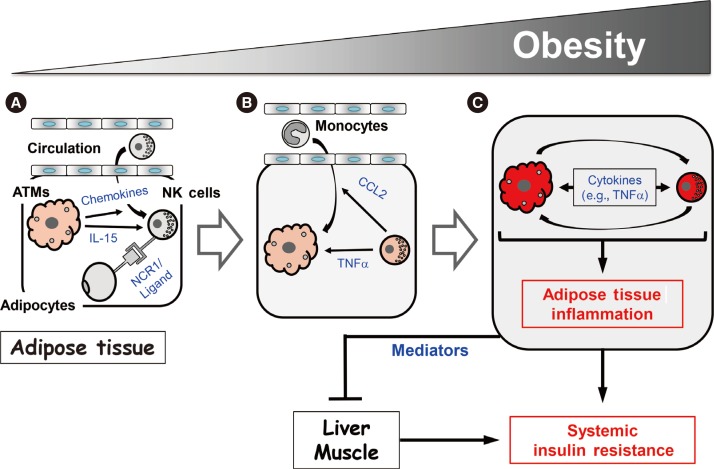
Model for the natural killer (NK) cell-mediated regulation of obesity-induced inflammation and insulin resistance. (A) As obesity increases, adipose tissue macrophages (ATMs) become activated and produce chemokines that recruit NK cells from the circulation. This increases the NK cell numbers in epididymal fat. In addition, the obese ATMs produce interleukin 15 (IL-15) and adipocytes produce an as-yet-unknown ligand for natural cytotoxicity triggering receptor 1 (NCR1), which activates the NK cells in epididymal fat. (B) Then, the activated NK cells induce increases in ATM numbers and activation. (C) This cross-activation of ATMs and NK cells induces adipose tissue inflammation in obesity, and eventually adipocyte insulin resistance. Epididymal fat also produces mediators that can regulate insulin resistance in liver and muscle, which eventually leads to the development of systemic insulin resistance. See the text for more details. CCL2, chemokine (C-C motif) ligand 2; TNFα, tumor necrosis factor α.
Our study and those of the Polic group and O'Rourke et al. [394144] were performed relatively recently, and there are still some unresolved discrepancies in the results. Thus, several questions remain. These include the following: how obesity regulates NK cell activation; how epididymal NK cells regulate the development of obesity-induced inflammation; what are the NK cell-derived inflammatory mediators that induce adipocyte insulin resistance; and what are the epididymal fat mediators that induce liver and muscle insulin resistance? The implications of these preclinical studies should also be tested in clinical studies in the future.
INVARIANT NATURAL KILLER T CELLS
iNKT cells are a specialized subset of T cells. Like conventional T cells, they express TCRs. However, unlike conventional T cells, which have diverse TCR sequences, iNKT cells have TCRs with an invariant α chain (Va4-Ja18 in mice and Va24-Ja18 in humans). Moreover, whereas conventional T cells recognize peptide antigens that are presented by MHC I or II molecules, iNKT cells recognize lipid antigens presented by CD1d [47]. α-Galactosylceramide (α-GalCer) is the prototypical lipid antigen that is recognized by iNKT cells. However, they also recognize pathogen-associated glycolipids and self-glycolipid antigens. Since iNKT cell responses are dependent on CD1d, Cd1d or Jα18 (TCR α chain Ja18) knockout mice, which lack iNKT cells, are often used to determine the in vivo role of iNKT cells [48].
Conventional T cell development in the thymus starts with double-negative (CD4– CD8–) thymocytes. These cells then express clonal TCRs that are generated by random TCR gene rearrangement and become double-positive (CD4+ CD8+) thymocytes. The TCRs of these cells subsequently encounter MHC I or II molecules on thymus epithelial cells. If they recognize the MHC molecules with at least a weak affinity, they are positively selected. However, if the T cells recognize self-peptides or MHC molecules with an affinity that is too high, they are negatively selected and die. This process results in single-positive conventional CD4+ or CD8+ T cells. With regard to iNKT cells, immature iNKT precursors arise from double-positive thymocytes by a stochastic process where double-positive thymocytes engage with an as-yet-unknown lipid antigen that is presented by CD1d on other double-positive thymocytes. In other words, the signal for iNKT development is presented on other double-positive thymocytes rather than on thymus epithelial cells [49]. Thereafter, the immature iNKT cells differentiate fully into mature iNKT cells in the thymus and periphery. The promyelocytic leukemia zinc finger protein (PLZF) is thought to be the master regulator that controls iNKT cell development, including the final stage that produces the various effector phenotypes of iNKT cells.
Fully developed iNKT cells can produce various pro- and anti-inflammatory cytokines. As a result, iNKT cells can be categorized like conventional CD4 T cells as Th1-like, Th2-like, and Th17-like iNKT cells. These cells produce a Th1 cytokine (IFNγ), Th2 cytokines (IL-4 and IL-13), and IL-17 and IL-22, respectively. The transcription factors that drive CD4 T cell polarization also participate in iNKT cell differentiation; thus, T-bet (T-box transcription factor), GATA3 (GATA binding protein 3), and RORγt (retinoid-related orphan receptor gamma) drive the differentiation of Th1-like, Th2-like, and Th17-like iNKT cells, respectively. However, it should be noted that the same iNKT cell can produce both Th1 and Th2 cytokines
iNKT cells in insulin resistance and T2DM
iNKT cells play both pro- and anti-inflammatory roles in bacterial and viral infections, type 1 diabetes, and multiple sclerosis. There is also speculation that, because iNKT cells recognize lipid antigens, they may also participate in the development of obesity-induced inflammation and insulin resistance. Many groups, including ours, have explored this possibility. Many of these studies employed the total body Cd1d–/– and Jα18–/– iNKT knockout lines (Table 1) [395051525354555657585960616263]. Most of the studies show that obesity decreases the numbers of iNKT cells in the liver. As a result, it has been suggested that loss of hepatic iNKT cells may play a role in the development of hepatosteatosis. However, the studies differ markedly in terms of the effect of obesity on adipose iNKT cell numbers: some show that obesity upregulates adipose iNKT cell numbers, other show no effect, and still others show that obesity downregulates adipose iNKT cell numbers (Table 1). These discrepancies may be due in part to the fact that some studies express iNKT cell numbers as a percentage of T or total lymphocytes while others, including ours, use absolute iNKT cell numbers normalized by tissue weight. However, the studies also differ markedly in terms of the effect of iNKT cell knockout on obesity-induced metabolic phenotypes. Some show that the deletion improves insulin resistance in obesity (insulin resistance: ↓ in Table 1), which suggests that iNKT cells promote the development of obesity-induced insulin resistance. However, many other studies show that iNKT cell deletion increases insulin resistance (insulin resistance: ↑ in Table 1), which suggests that iNKT cells protect against the development of obesity-induced insulin resistance. The latter possibility is supported by the protective effect of injecting wild-type mice with α-GalCer, which activates iNKT cells. However, just as many studies (including ours) show that iNKT deletion has no effect on obesity-induced insulin resistance (insulin resistance: ↔ in Table 1). Thus, these total body iNKT knockout mouse studies have yielded extremely inconclusive results.

Basic features of the studies that examine the role of iNKT cells in obesity-induced insulin resistance
Recent studies have focused on how adipose iNKT cells could be activated in obesity. Of particular interest is whether adipocytes present lipid antigens via CD1d. This possibility was suggested by the study by Huh et al. [58], which showed that fully differentiated adipocytes express high levels of CD1d. As a result, two studies have examined the effect of specifically deleting CD1d in adipocytes on the metabolic phenotypes in obesity [5460]. However, like the studies on the total body Cd1d–/– knockout mice, these two studies do not entirely agree with each other. Satoh et al. [54] found that the deletion reduced the body and fat weights in obesity and improved obesity-induced insulin resistance, whereas the more recent study by Huh et al. [60] showed that the deletion worsened obesityinduced insulin resistance without affecting the body and fat weights. Moreover, Satoh et al. [54] used heterozygous adipocyte-specific Cd1d+/– knockout mice as a control instead of true wild-type mice such as floxed Cd1d–/– knockout mice, whereas Huh et al. [60] used more traditional control mice (LysM-Cre–/– Cd1d flox/flox). It should be noted that both groups also published studies on total body Cd1d–/– knockout mice that showed the respective same results as their studies on adipocyte-specific CD1d knockout mice [5158].
It would also be of interest to determine whether macrophages can present lipid antigens via CD1d and thereby activate iNKT cells in obesity. However, the effect of deleting CD1d in macrophages has not yet been reported.
Interestingly, most of the studies on iNKT cell deletion showed that the insulin resistance phenotypes mirror the changes in body weights and obesity (fat weights). Thus, when iNKT cell deletion improved insulin resistance in obesity, the body weights and adiposity decreased. By contrast, when iNKT cell deletion worsened insulin resistance, the body and fat weights increased. Finally, if there were no changes in body weight or adiposity, then the insulin resistance phenotypes were also not changed.
These contradictory results have greatly puzzled researchers in the field, especially considering that (apart from the study by Subramanian et al. [53] that used iNKT cell transgenic mice) all of the studies used the same total body or adipocyte-specific knockout mouse lines on the same background. However, when the details of these studies are reviewed closely, some subtle but significant differences can be observed. These differences include the sex of the animals that are used, the source and fat content of the diet, and the duration of the diet treatment (Table 1). In relation to these factors, none of the studies that showed that iNKT cells promote the development of insulin resistance used the HFD that is provided by Research Diet (Table 1). By contrast, almost all of the studies that showed iNKT cells are protective in obesity used the HFD from Research Diet (New Brunswick, NJ, USA) (Table 1). Different vendors use different fat sources; for example, lard may be used instead of coconut oil. Since iNKT cells can have both pro- and anti-inflammatory functions, it is possible that the HFD from one vendor may contain lipid antigens that preferentially induce the proinflammatory functions of iNKT cells whereas the HFD from another vendor provokes the anti-inflammatory functions of these cells. This difference may yield opposite metabolic phenotypes despite the fact that the same mouse lines are used. The duration of HFD treatment may also affect outcomes. This is exemplified by the two studies by the Qi group, who examined the metabolic phenotypes of Cd1d–/– mice on a HFD at 4 days and 8 weeks. After 8 weeks of treatment, they found that the mice had no metabolic phenotype changes, including body and fat weights and insulin resistance [63]. By contrast, at 4 days, the same mouse strain showed worse obesity-induced insulin resistance, albeit no change in body weight [55]. These studies suggest that iNKT cells may play a protective role at the early phase of obesity and that they lose their protective capacity as obesity worsens. Another intriguing, but as-yet-untested, hypothesis is that the gut micro-biome may be responsible for the differences in the metabolic phenotypes of the iNKT cell knockout mice. Several studies show that the gut microbiome controls the development of obesity [64]. It is also well-accepted that the animal facilities in different institutes have quite different microbiomes. Furthermore, a recent study showed that the gut microbiome is important for iNKT cell development [65]. Hence, it will be interesting to see whether the different body and fat weights of the iNKT cell knockout mice at the different facilities may be caused by gut microbiome differences and whether these differences regulate the metabolic outcomes. All of these possibilities should be examined in the future.
Moreover, a recent study revealed a new role of iNKT cells that may help to explain why some of the studies on iNKT cell knockout mice showed that the loss of iNKT cells increased body and fat weights. This new role relates to the regulation of the browning of white fat [66]. The recent study showed that, when iNKT cells are activated by α-GalCer injections, the metabolic rate and whole body thermogenesis increases. This in turn decreases the body and fat weights. This phenomenon appears to be caused by iNKT cell-mediated induction of fibroblast growth factor 21 (FGF21) expression by white adipocytes. This iNKT cell-FGF21 axis also induces the browning of white adipocytes in the subcutaneous fat. Hence, the study suggests that the body and fat weight increase that was observed in some of the studies on iNKT cell knockout mice may have been mediated by decreased browning of white adipocytes, which reduces the metabolic rate.
Regardless of the metabolic outcomes of iNKT cell deletion, all studies agree that iNKT cells regulate ATM inflammation, albeit in different directions. Thus, the studies that found that iNKT cells promote insulin resistance all suggest that iNKT cells promote the development of proinflammatory (M1) ATMs, in particular by producing IFNγ. By contrast, all of the studies that found that iNKT cells are protective showed that iNKT cells suppress ATM inflammation by producing IL-4. In relation to these observations, the Qi group showed that, although α-GalCer injections (which activate iNKT cells) improved HFD-induced insulin resistance in wild-type mice, such injections did not show any effects on insulin resistance in Il4–/– knockout mice [5563]. In addition, iNKT cells have been shown to regulate the activation of adipose Tregs [67]. Tregs have been shown to influence the metabolic outcomes of obesity [68]. Thus, it is possible that this role of Tregs is also mediated by iNKT cells.
INNATE LYMPHOID CELLS
ILCs were described and classified relatively recently. ILCs are defined by (1) the lack of an antigen receptor that is rearranged by recombination activating genes (RAGs) (by contrast, mature TCRs and BCRs arise from RAG-mediated recombination); (2) the lack of myeloid cell-specific surface and lineage markers; and (3) the presence of the classical lymphocyte morphology [69]. Based on these criteria, ILCs include NK cells and lymphoid tissue inducer (LTi) cells, both of which were identified decades ago. All ILCs derive from CD127+ CLPs in the bone marrow. The CLPs first develop into ILC/NKPs, which then become pre-NKPs or Id2 (inhibitor of DNA binding 2)+ LTi/ILC precursors. The pre-NK cells finally develop into NK cells while the LTi/ILC precursors develop into LTi cells or Id2+ PLZF+ ILC precursors that in turn become ILC1, 2, and 3 cells [70]. E4BP4/NFIL3 plays a critical role in the development of ILCs in the bone marrow. Hence, deletion of E4BP4/NFIL3 causes the loss of all ILCs [7172].
ILC classification
In general, ILCs are classified according to the cytokines that they produce, analogous to the situation with T helper cells (Table 2). In T helper cells, the signature cytokine of Th1 T cells is IFNγ while Th2 T cells are defined by their expression of IL-4 and IL-13. The signature Th2 cytokines also include IL-5. Th17 cells are defined by their production of IL-17. Similarly, the group 1 ILCs are defined by production of the Th1 cytokine IFNγ, the group 2 ILCs are characterized by their production of the Th2 cytokines IL-5 and IL-13, and the group 3 ILCs are defined by their IL-17A expression. Hence, the group 1, 2, and 3 ILCs are the ILC equivalents of CD4 Th1, Th2, and Th17 cells, respectively. It should be noted that the ILC family transcription factors are the same transcription factors that are used in the differentiation of the corresponding CD4 T cell members. Thus, Th1 and group 1 ILCs require T-bet, Th2 and group 2 ILCs require GATA3, and Th17, and group 3 ILCs require RORγt.

Classification and characterization of ILCs
Since the signature cytokine of NK cells is IFNγ, NK cells are categorized as group 1 ILCs. However, unlike the other CD4 T helper cells, NK cells also play an important role in cytotoxicity. Therefore, the NK cells in the group 1 ILCs are considered to be analogous to CD8 T cells, which also have an important cytotoxic role. Notably, because of this distinct function of NK cells, ILCs have also been subcategorized as Killer ILCs versus Helper ILCs. However, this system is much less commonly used to classify ILCs than the group 1, 2, and 3 ILC categorization system (Table 2).
The biggest challenge in terms of ILC classification is that unique cell surface markers that differentiate between the ILC subtypes have not yet been clearly established. Hence, as the research on ILCs progresses, it is likely that the classification of ILCs will undergo further definition or even re-categorization.
Thus, based on current knowledge, ILCs can be categorized as follows.
Group 1 ILCs
Group 1 ILCs contain NK cells and ILC1. While the signature cytokine of both cell types is IFNγ, they also produce other proinflammatory cytokines such as TNFα. NK cells also generate perforin and granzyme, which mediate cytotoxicity. It was thought that ILC1s do not express these enzymes until recent studies that suggested that ILC1 can also express these proteins and have cytotoxicity activity, albeit weaker than that in NK cells [73]. NK cells and ILCs also share common surface markers, including NK1.1 and NCR1. It was also initially thought that NK cells and ILC1s express unique cell surface markers, including CD49b (DX5) for NK cells and CD27, CD127, and CD49a for ILC1s. However, depending on the tissue, activation status and stress conditions, other cell types can express these markers. Therefore, at present, cell surface markers and functions that can clearly differentiate between these two cell types have not yet been identified. Similarly, it was initially thought that a possible distinguishing marker could be Eomes, which is required for the development of NK cells: it was believed that ILC1s do not use Eomes and thus Eomes-tagged mice have often been used to differentiate between these cell types. However, the possibility that Eomes is specific for NK cells recently became less likely when it was found that ILC1s from the salivary gland also express Eomes [74]. Genomic studies have further complicated the matter [75]: the gene expression profiles of NK cells and ILC1s from various tissues at a steady state show that, although these cell types develop from different lineages, their gene expression profiles are very similar. This suggests that these two cell types play inter-changeable roles in immune homeostasis and/or their functions are dispensable. However, since these genetic studies only examined the steady state of immune cells, it remains possible that NK cells and ILC1s may play unique roles in different tissue environments when they are activated or stressed. This possibility can be tested when cell type-specific markers are identified. In any case, since it is still so difficult to distinguish between NK cells and ILC1s, the studies in the NK cell field often do not discuss the possibility that the cell populations they are examining may include ILC1s.
Group 2 ILCs
The group 2 ILCs contain the ILC2s only. They are characterized by a relatively unique set of cell surface markers, including CD127 and ST2, which can be used to identify ILC2s in flow cytometric analyses. IL-33, which is a ligand for ST2, is required for the expansion and activation of ILC2s. After activation, ILC2s produce other Th2 cytokines, notably IL-5, and IL-13.
Group 3 ILCs
The group 3 ILCs consist of ILC3 and LTi, both of which produce IL-17. They also produce other cytokines, notably IL-22. Interestingly, ILC3s also express NKp46 (NCR1). However, they differ from the group 1 ILCs, including NK cells, because they do not express NK1.1. Moreover, IL-23 induces the development and activation of the group 3 ILCs.
ILCs in obesity
ILCs have been suggested to play important roles in many different immune responses, including infections with bacteria (ILC1s and ILC3s), parasites (ILC1s and ILC2s), fungi (ILC3), autoimmune disorders (ILC1s and ILC3s), and allergic disease (ILC2s). However, since our knowledge about ILCs is still in the nascent stage, it is likely that the roles that ILCs play in immune homeostasis will continue to expand. Since there are several excellent reviews on this topic, these roles will not be discussed further in this review. Instead, we will focus on what is known about the roles of ILC1, ILC2, and ILC3 in metabolic diseases and obesity. Since the roles of NK cells in these pathogeneses have already been extensively described above, they will be omitted from the remaining discussion.
ILC1
Since NK cells and ILC1s share many surface markers, including NK1.1 and NKp46, and markers that clearly differentiate between these two cell types are lacking, our study and the studies of the Polic group and O'Rourke et al. [44] on the role of NK cells in obesity-induced insulin resistance (described above) did not distinguish between NK cells and ILC1s [394144]. However, the Polic group did examine several NK cell- and ILC1-specific markers in epididymal fat: they found that the CD3– NK1.1+ NKp46+ cells in epididymal fat strongly express several NK cell-specific markers, including CD49b and CD11b. This suggests that most of the CD3– NK1.1+ NKp46+ cells in epididymal fat are NK cells, not ILC1s, and that therefore the three studies mainly examined the role of epididymal NK cells in the development of obesity-induced inflammation and insulin resistance [41].
O'Sullivan et al. [76] recently examined the roles NK cells and ILC1s play in obesity-induced insulin resistance by exploiting the fact that NK cells, but not ILC1s, express Eomes at high levels (although, as mentioned above, it was found recently that ILC1s from the salivary gland also express Eomes [74]). Eomes-GFP mice were used for this study, which showed that the adipose CD3– NK1.1+ NKp46+ T-bet+ cells consist of three subpopulations, namely, DX5 (CD49b)+ Eomes+ cells (mNK cells), DX5 (CD49b)– Eomes+ cells (iNK cells), and DX5 (CD49b)– Eomes– cells (ILC1s). They found that, under HFD conditions (<4 weeks), the ILC1s in the subcutaneous fat expressed higher IFNγ levels than the mNK and iNK cells. Like the NK cell studies described above [394144], anti-NK1.1 antibody injections (which deplete both NK cells and ILC1s) improved obesity-induced insulin resistance. Furthermore, when Eomes+ NK cells or Eomes– ILC1s from the subcutaneous fat of HFD-fed wild-type mice were transferred into HFD-fed Rag2–/–Il2rg–/– mice (which lack both NK cells and ILC1s), obesity-induced insulin resistance worsened. This effect associated with the M1 polarization of ATMs. These observations suggest that NK cells and ILC1s in the subcutaneous fat both mediate the development of obesity-induced inflammation and insulin resistance. Interestingly, however, when Eomes+ NK cells or Eomes– ILC1s from wild-type epididymal fat were transferred into Rag2–/–Il2rg–/– mice, there was very little or no expression of IFNγ during HFD feeding [76]. This contradicts many published studies, including the NK cell studies discussed above [394144]. In particular, we showed that obesity induces inflammation in the epididymal fat only: such inflammation was never detected in the subcutaneous fat. Furthermore, we found that all experimental modulations of NK cell numbers affected the obesity-induced inflammation in the epididymal fat only [39]. Despite this discrepancy, the study by O'Sullivan et al. [76] suggests that NK cells and ILC1s play important roles in the development of obesity-induced insulin resistance. However, it remains possible that, as suggested by genomic analyses of NK cells and ILC1s [75], these cell types are phenotypically different but functionally identical in obesity.
ILC2
Of the ILCs, ILC2s have been particularly extensively studied in terms of their role in obesity, specifically in the development of beige fat. It should be noted that ILC2 was first identified in mesenteric fat-associated lymphoid clusters [77]. The role of ILC2 in beiging was discovered via a circuitous pathway. First, it was observed that the total body knockout of IL-5 increases body and fat weights [78]. Although IL-5 is one of the ILC2 signature cytokines, its participation in fat weight regulation was not yet suspected. Instead, it was noted that IL-5 is critical for the recruitment, maturation, and activation of eosinophils [79]. It was then shown that eosinophil-derived IL-4 induces M2 ATMs to secrete catecholamine, and that this regulates fat weight by inducing the differentiation of beige fat [8081]. Hence, it was speculated that IL-5-induced fat weight loss is mediated by eosinophils. However, when Molofsky et al. [78] deleted IL-5 in DblGata1 knockout mice, which lack eosinophils, the mice still showed fat weight increases. This suggested that the weight gain caused by IL-5 deficiency is not dependent on eosinophils. Subsequently, the murine studies of Molofsky et al. [78] showed that the main source of IL-5 in fat is adipose ILC2s, and that it is these cells that regulate the numbers of adipose eosinophils and M2 ATMs. The Artis group then found that human abdominal subcutaneous fat also contains ILC2s. In addition, they showed that, relative to lean controls, the white adipose tissue of both obese humans and HFD-fed mice is characterized by decreased ILC2 responses [82]. This suggests that obesity-induced decreases in adipose ILC2s reduce adipose IL-5 expression, which in turn increases fat weights.
In the same study, the Artis group explored the effect of injecting and deleting IL-33 levels on adipose ILC2 numbers and the development of beige fat [82]. IL-33 was of interest because this cytokine expands ILC2s. They showed that, when mice were injected intraperitoneally with IL-33, the ILC2 numbers in the epididymal and subcutaneous fat increased, the fat weights decreased, and the energy expenditure and UCP1 expression in the fat pads rose. Conversely, IL-33 total body knockout mice showed the opposite phenotype, namely, decreased ILC2 numbers in both fat pads, increased body and fat weights, and decreased UCP1 expression in the fat. They then showed that these effects are mediated specifically by ILC2s: intraperitoneal IL-33 injections only induced beiging in Rag2–/– Il2rg–/– mice (which lack ILC2s) when the mice were reconstituted with adipose ILC2s. Thereafter, they showed that ILC2s promote beiging by producing an endogenous opioid-like peptide called methionine-enkephalin (MetEnk): when ILC2s are treated in vitro with IL-33, they express MetEnk, and, when wild-type mice are injected subcutaneously with MetEnk, beiging is upregulated. Notably, the MetEnk injection did not change adipose Il4 or Il13 expression or the numbers of adipose eosinophils and M2 ATMs. This is supported by the fact that, when the eosinophil knockout DblGata1 mice or the total body Il4ra knockout mice were injected intraperitoneally with IL-33, the ILC2 numbers in fat rose and beiging occurred. This was also observed when ILC2s were adoptively transferred into these knockout mice. Hence, these data together suggested that ILC2-mediated beiging is independent of eosinophils and IL-4 [82].
The Chawla group also examined the effect of intraperitoneal IL-33 injections [83]. First, like the Artis group [82], they observed that IL-33 injections increase the UCP1 expression and energy expenditure in subcutaneous fat. They also showed that the IL-33 injections increased the proliferation of the adipocyte precursors in fat. However, they found that the IL-33-induced expansion of adipose precursors depended on IL-4 and IL-13: when total body Il4, Il13, and eosinophil-deficient DblGata1 knockout mice were injected with IL-33, the adipocyte precursor proliferation seen in IL-33-injected wild-type mice was not observed. In addition, in mice with total body knockout of Il4ra (which is required for both IL-13 and IL-4 signaling), IL-33 injection did not induce adipocyte precursor proliferation. Moreover, unlike the observations of the Artis group [82], the Chawla group found that IL-33 injections of total body Il4ra knockout mice did not increase the UCP1 expression in fat [83]. Interestingly, they found that deleting Il4ra in myeloid cells (using LysM-Cre mice) or in fully differentiated adipocytes (using Adipoq-Cre mice) did not affect adipocyte precursor proliferation. It was only when Il4ra was deleted in adipocyte precursors (using Pdgfra-Cre mice) that adipocyte precursor proliferation was impaired; UCP1 expression and energy expenditure in the fat were also decreased [83].
Hence, the Artis and Chawla groups both showed that ILC2 induces beiging [8283]. However, these studies are strikingly different in terms of the dependency of ILC2-induced beiging on IL-4, other Th2 cytokines, and eosinophils. The reason for this is not yet clear.
In addition to regulating ILC2s, IL-33 can also specifically regulate Tregs in adipose tissue. Tregs play an important role in suppressing inflammation [8485]. They mainly achieve this by secreting IL-10 and TGFβ, which are classical anti-inflammatory cytokines (and the signature cytokines of Tregs). Tregs are typically defined as CD4+ CD25+ Foxp3+ cells. In lean mice, adipose tissue has a much higher frequency of Tregs (~40% of CD4 T cells) than any of the typical immune organs (e.g., the spleen and lymph nodes) [68]. However, in obesity, this frequency drops [68]. Moreover, when Tregs are depleted in Foxp3-DTR mice by diphtheria toxin injections, obesity-induced insulin resistance worsens. Conversely, when Tregs are expanded by injections with a recombinant IL-2:anti-IL-2 monoclonal antibody complex (which selectively expands Tregs), obesity-induced insulin resistance improves [68]. Thus, Tregs protect from obesity-induced insulin resistance. Notably, it has been shown that peroxisome proliferator-activated receptor γ (PPARγ) in Tregs plays a critical role in maintaining epididymal Treg numbers and functions [86].
In terms of the role of the ILC2-stimulating cytokine IL-33 in adipose Treg homeostasis, it was shown recently that, like PPARγ, IL-33 and ST2 (an IL-33 receptor [IL1RL]) help to maintain epididymal Treg numbers. First, the adipose tissue Treg population has a higher frequency of ST2+ Tregs than other tissues, including the spleen [87888990]. Furthermore, intraperitoneal IL-33 injections induce adipose Treg proliferation, which further increases the frequencies of Tregs in adipose tissue [878890]. This IL-33-induced increase was also observed in HFD-fed mice, which have low adipose Treg frequencies [89]. Conversely, total body knockout of Il33 or Il1rl (which encodes ST2) decreased adipose Treg frequencies. Additional studies suggested that the IL-33-induced expansion of Tregs requires the IL-33/MHC II/MyD88 (myeloid differentiation primary response 88)/BATF (basic leucine zipper ATF-like transcription factor), and IRF4 (interferon regulatory factor 4) signaling pathways. However, it was not clear whether the IL-33-induced Treg expansion is mediated by ILC2s. To address this, Molofsky et al. [87] examined the effect of IL-33 injections on Treg proliferation in IL-5-DTA mice. These mice are generated by crossing IL-5-cre mice with Rosa 26-DTA mice [87]. In these mice, when cells express IL-5, they will die. Since the previous study by the same group showed that ILC2s are the main source of IL-5 in adipose tissue [78], and IL-33 induces ILC2s to express IL-5, IL-33 injections of the IL-5-cre Rosa 26-DTA mice kill activated ILC2s. Molofsky et al. [87] found that, in these mice, the IL-33 injections no longer induced adipose Treg proliferation. Thus, they concluded that IL-33-activated ILC2s regulate Treg proliferation in adipose tissue. However, since IL-5 can be produced by many other cells, including eosinophils, it remains possible that non-ILC2 cells that express IL-5 may also regulate Treg proliferation.
It should also be noted that depletion or expansion of Tregs in obese animals does not change body or fat weights [6886]. Given the known role of ILC2s in beiging, it is difficult to determine whether knocking out IL-33 and ST2 reduced epididymal Treg numbers because these molecules directly participate in the maintenance of Treg numbers, or whether these effects were merely secondary to the changes in body and fat weight that are caused by IL-33-induced beiging. Further studies that elucidate how ILC2s regulate Tregs in adipose tissues are warranted.
ILC3
Studies that directly examine the role of ILC3s in obesity-induced metabolic diseases have not been published. However, it has been shown that ILC3s play a role in obesity-induced airway hyper-reactivity (AHR). Obesity increases AHR in mouse models, and this is improved by knocking out IL-17A and the NLRP3 (nucleotide-binding oligomerization domain, leucine rich repeat and pyrin domain containing 3) inflammasome [91]. Since obesity also increases AHR in Rag1 knockout mice (which lack B and T cells, including Th17), it was speculated that obesity-induced AHR may be mediated by ILC3s. Indeed, when ILC3s were transferred into ILC-deficient Rag2–/–Il2rg–/– mice, obesity-induced AHR worsened. Obesity-induced AHR is also regulated by IL-1β, which is produced by macrophages in an NLRP3-dependent manner. Therefore, it was proposed that obesity activates lung macrophages, which secrete IL-1β, which in turn activates ILC3s. Thereafter, the activated ILC3s produce IL-17A and induce AHR [91].
PROSPECTIVES
To date, very few studies have investigated the roles of NK cells and ILCs in the development of obesity-induced inflammation and insulin resistance. Furthermore, the studies on the role of iNKT cells in these pathogeneses exhibit marked and confusing discrepancies. Nevertheless, the recent studies in the classical immunology and metabolic fields that were discussed in this review suggest strongly that all three cell types participate in obesity-induced inflammation and insulin resistance. It is likely that, as insights from the classical immunology field emerge and are incorporated into the metabolism field, we will gain a better understanding of how NK cells, ILCs, and iNKT cells participate in the development of obesity-induced inflammation and insulin resistance. It is also likely that these preclinical studies will help to identify the roles that these cell types play in human obesity-induced pathogeneses, including insulin resistance, T2DM, and cardiovascular diseases.
ACKNOWLEDGMENTS
This work was supported by National Institutes of Health (NIH) grants R21 DK80380 (Jongsoon Lee) and P30 DK36836 (Joslin Diabetes Research Center) and American Diabetes Association grants RA 1-10-BS-97 and 1-15-BS-111 (Jongsoon Lee).
Notes
CONFLICTS OF INTEREST: No potential conflict of interest relevant to this article was reported.

