The Effect of Glycemic Status on Kidney Stone Disease in Patients with Prediabetes
Article information
Abstract
Background
While the evidence supporting a positive association between diabetes mellitus and kidney stone disease (KSD) is solid, studies examining the association between impaired fasting glucose (IFG) and KSD show inconsistent results. Currently, there are no studies examining the relationship between impaired glucose tolerance (IGT) and KSD. The objective of this study is to investigate the effects of different glycemic statuses on KSD. The results may help to motivate patients with diabetes to conform to treatment regimens.
Methods
We conducted a cross sectional study of a population that underwent health check-ups between January 2000 and August 2009 at the Health Evaluation Center of National Cheng Kung University Hospital. A total of 14,186 subjects were enrolled. The following categories of glycemic status were used according to the criteria of the 2009 American Diabetes Association: normal glucose tolerance, isolated IGT, isolated IFG, combined IFG/IGT, and diabetes. The existence of KSD was evaluated using renal ultrasonography, and the presence of any hyperechoic structures causing acoustic shadowing was considered to be indicative of KSD.
Results
The prevalence of KSD was 7.4% (712/9,621), 9.3% (163/1,755), 10.8% (78/719), 12.0% (66/548), and 11.3% (174/1,543) in subjects with NGT, isolated IGT, isolated IFG, combined IFG/IGT, and diabetes, respectively. Isolated IFG, combined IFG/IGT, and diabetes were associated with KSD after adjusting for other clinical variables, but isolated IGT was not. Age (41 to 64 years vs. ≤40 years, ≥65 years vs. ≤40 years), male gender, hypertension, and hyperuricemia were also independently associated with KSD.
Conclusion
Isolated IFG, combined IFG/IGT, and diabetes, but not isolated IGT, were associated with a higher risk of KSD.
INTRODUCTION
The prevalence of kidney stone disease (KSD) is increasing worldwide, and this increase is seen across sex, race, and age, with dietary changes possibly being a key driving force [1]. Several studies have described the association of KSD with metabolic syndrome and its components, such as central obesity, high blood pressure, hypertriglyceridemia, and hyperglycemia. These associations suggest that KSD is a systemic disease rather than an isolated kidney disorder [23456]. Growing evidence has shown that KSD not only increases the risk of metabolic syndrome, coronary artery disease, osteoporosis, and fracture but also leads to end stage renal disease [78].
Diabetes mellitus (DM) is a chronic disease that is characterized by hyperglycemia, and its central feature is insulin resistance. The urologic complications associated with DM are an increasingly growing health concern. There is also epidemiological evidence that supports DM as a risk factor for the development of KSD [9]. However, the results of studies examining the associations between impaired fasting glucose (IFG), a component of metabolic syndrome, and KSD are inconsistent [35610111213]. Furthermore, there are currently no studies examining the relationship between impaired glucose tolerance (IGT) and KSD. Therefore, the aim of the current study was to evaluate the relationship between KSD and different glycemic statuses, including normal glucose tolerance (NGT), isolated IFG, isolated IGT, combined IFG/IGT, and DM.
METHODS
We conducted a cross-sectional study using secondary data collected from the Prevention Health Center of National Cheng Kung University Hospital (NCKUH). Personal identification data were not included, so informed consent was not needed. This research was approved by the Institutional Review Board of NCKUH in Taiwan. Subjects with a history of any of the following were excluded: hypertension (n=2,023, including diuretics usage), KSD (n=240), primary hyperaldosteronism (n=4), chronic diarrhea (n=1), and intestinal resection surgery (n=5). A total of 14,186 eligible adult participants from Taiwan were enrolled (8,296 male and 5,890 female).
The baseline data included demographic information, lifestyle habits (alcohol consumption, cigarette smoking, and regular exercise), and medical and medication histories. Body mass index (BMI) was calculated as weight (kg) divided by height (m) squared. Right arm systolic blood pressure (SBP) and diastolic blood pressure (DBP) were measured after subjects had been lying in a quiet examination room for five minutes in a supine position. After overnight fasting for at least 12 hours, blood and random urine samples were collected from all subjects. The tests included fasting plasma glucose (FPG), 2-hour postload plasma glucose (2h PG), total cholesterol (TC), triglyceride (TG), high density lipoprotein cholesterol (HDL-C), uric acid, creatinine, and routine urine analyses.
Current alcohol use was defined as at least one alcoholic drink per week for more than half a year. Current smoking was defined as at least one pack per month for more than half a year. Regular exercise was defined as vigorous exercise for a minimum of 20 minutes each time, three times or more per week. Subjects were considered hypertensive if they had a SBP ≥140 mm Hg, a DBP ≥90 mm Hg, a history of hypertension or were taking anti-hypertensive medication [14]. Following the Nutrition and Health Survey in Taiwan, obesity was defined as a BMI of 27 kg/m2 [15]. Hypertriglyceridemia and high atherosclerotic index were defined as a TG level ≥1.69 mmol/L (150 mg/dL) and a TC/HDL-C level ≥4.5 in females and ≥5 in males [1617]. Male subjects with uric acid levels ≥416.4 µmol/L (7 mg/dL) and female subjects with uric acid levels ≥386.7 µmol/L (6.5 mg/dL) were classified as hyperuricemic based on reference values from the central laboratory. Glycemic status was categorized using the 2009 criteria of the American Diabetes Association [18]. Subjects were considered to have DM if they had a FPG ≥6.9 mmol/L (126 mg/dL), 2h PG ≥11.0 mmol/L (200 mg/dL), positive DM history or used hypoglycemic agents. Subject were considered to have NGT if they had a FPG <5.6 mmol/L (100 mg/dL), 2h PG <7.8 mmol/L (140 mg/dL) and no prior history of DM. Isolated IFG was defined as a FPG between 5.6 mmol/L (100 mg/dL) and 6.9 mmol/L (126 mg/dL) and 2h PG <7.8 mmol/L (140 mg/dL). Isolated IGT was defined as a 2h PG between 7.8 mmol/L (140 mg/dL) and 11 mmol/L (200 mg/dL) and FPG <5.6 mmol/L (100 mg/dL). Combined IFG/IGT was defined as a FPG between 5.6 mmol/L (100 mg/dL) and 6.9 mmol/L (126 mg/dL) and 2h PG between 7.8 mmol/L (140 mg/dL) and 11.0 mmol/L (200 mg/dL). Urine pH was classified into the following categories: pH <5.5, 5.5≤pH≤6.6, and ≥6.7. The existence of KSD was evaluated using renal ultrasonography (Toshiba Xario/SSA=660A Ultrasound Machine; Toshiba, Tokyo, Japan, with a 3.5-MHz transducer) to find any hyperechoic structures causing acoustic shadowing [4].
The analyses were performed using SPSS version 17.0 (SPSS Inc., Chicago, IL, USA), with the data presented as the mean±standard deviations or percentages. Comparisons of clinical characteristics between those with and without KSD were carried out using Pearson chi-square tests for categorical data and independent samples t-tests for continuous data. Multiple logistic regressions were used to determine whether glycemic status was associated independently with the presence of KSD after adjusting for other variables, including age (≤40, 41 to 64, and ≥65 years), sex, TC/HDL-C, hypertriglyceridemia, hyperuricemia, obesity, hypertension, urine pH, current smoking, current alcohol use, and regular exercise. The odds ratios (ORs) and 95% confidence intervals (CIs) of the predictors were derived from the regression model. Statistical significance was defined as a P≤0.05.
RESULTS
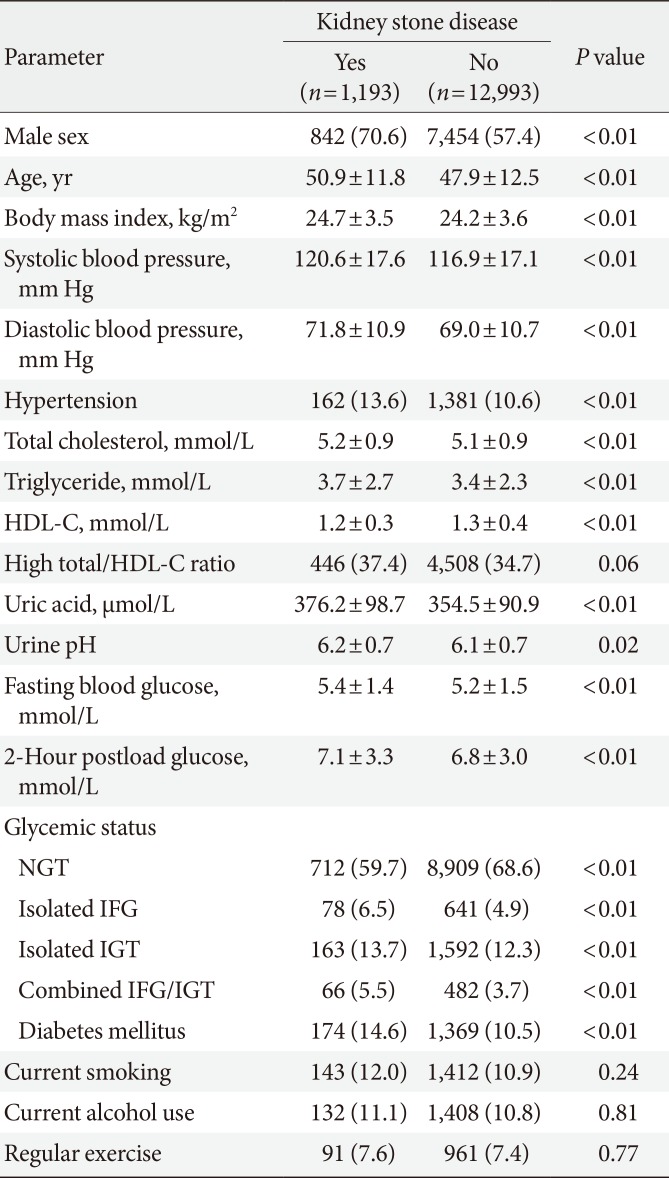
The overall prevalence of KSD was 8.4% (1,193/14,186). Table 1 shows a summary of the clinical characteristics of the study population. Males were predominant in the KSD group. Age, BMI, SBP, DBP, TC, TG, FPG, 2h PG, uric acid, and urine pH were all significantly higher than in the non-KSD group, while HDL-C was significantly lower in the KSD group. KSD subjects were more likely to have hypertension than non-KSD subjects. The distributions of the atherosclerotic index, current smoking status, current alcohol use, and regular exercise were similar in both groups.

Comparison of the clinical parameters of subjects with and without kidney stone disease
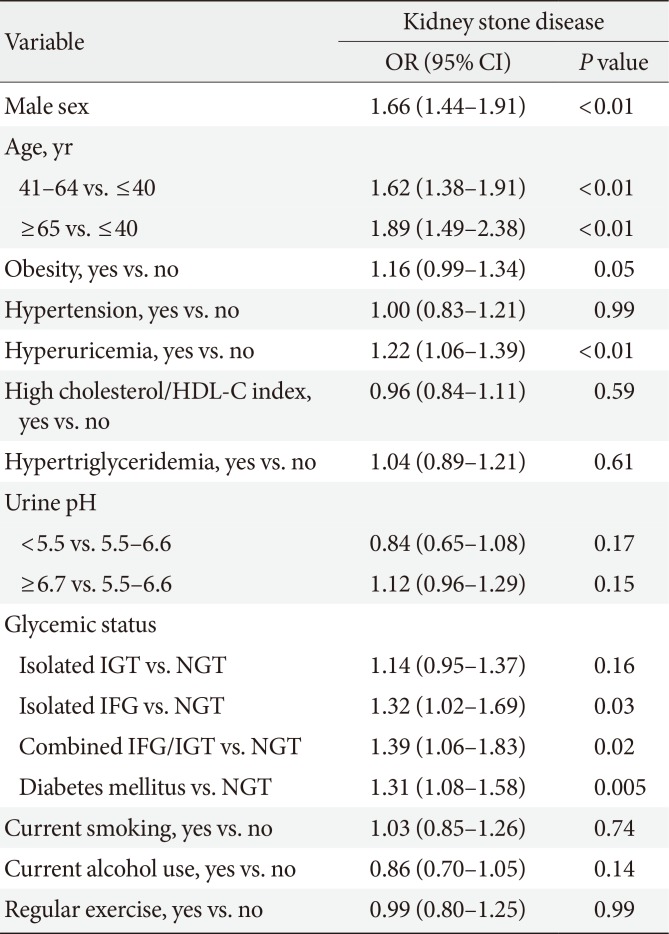
Table 2 presents the ORs and 95% CIs of the independent variables for predicting KSD from multiple logistic regression analyses. Isolated IFG, combined IFG/IGT, and DM were positively associated with KSD. However, after adjusting for other clinical variables, isolated IGT was not. Compared with the younger subjects (≤40 years), both the middle-aged (41 to 64 years) and elderly (≥65 years) groups had a higher risk of developing KSD. Other independently associated factors included the male gender and hyperuricemia.

Multiple logistic regression model for the relationship between glycemic status and kidney stone disease
Fig. 1 shows the comparisons of the KSD prevalence among subjects with different glycemic statuses. There was a significant incremental trend of an increasing KSD prevalence in subjects with NGT, isolated IGT, isolated IFG, and combined IFG/IGT to DM (P for trend <0.001). Based on post hoc analysis, subjects with isolated IFG, combined IFG/IGT, and DM had a significantly higher prevalence of KSD than the NGT group, but subjects with isolated IGT did not.
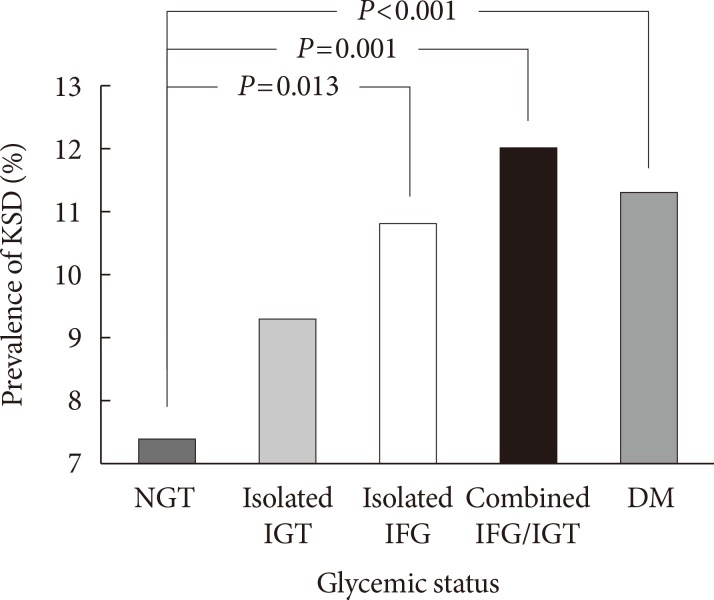
Prevalence of kidney stone disease (KSD) with different glycemic statuses. Significant differences were observed between the normal glucose tolerance (NGT) and diabetes mellitus (DM) groups (P<0.001), between the NGT and combined impaired glucose tolerance (IGT)/impaired fasting glucose (IFG) groups (P=0.001), and between the NGT and DM groups (P=0.013).
DISCUSSION
The positive association between DM and KSD has been well documented [29], but the relationship between pre-diabetes and KSD is still inconsistent. Some previous studies have found that IFG is independently associated with an increased risk of KSD [1213], while others did not [3561011]. As for the effect of IGT on KSD, no studies to date have been carried out examining this relationship. In addition to DM, the current study shows that combined IFG/IGT and isolated IFG, but not isolated IGT, are associated with an increased risk of KSD. To the best of our knowledge, this study was the first to examine the association between KSD and different glycemic statuses using fasting and postload plasma glucose measurements simultaneously.
One of the most well-known mechanisms of stone formation in hyperglycemic subjects is insulin resistance. Meanwhile, the severity of insulin resistance is higher in subjects with combined IFG/IGT and IFG than in subjects with IGT [19]. This may explain the different effects of combined IFG/IGT, isolated IFG and isolated IGT on KSD that were observed in this study. Insulin resistance could lead to decreased urinary ammonium excretion and lower urinary citrate excretion through a decrease in ammonia production and Na+/H+ antiport dysfunction [42021]. In addition, hyperglycemia-related glycosuria could cause an isonatric inhibition of proximal tubular sodium, glucose and calcium reabsorption, resulting in higher urinary uric acid and calcium excretion [222324].
Studies have reported conflicting evidence regarding the association between IFG and KSD. The results observed in this study were in accordance with two other Korean studies that revealed a significant association between IFG and KSD [1213]. However, other studies have reported an insignificant relationship [3561011]. One reason for the difference may be that none of these earlier studies considered postload blood glucose in the classification of glycemic status. Perhaps the IFG subjects in previous studies would have been classified as IGT or DM subjects if postload glucose had been considered, and the lack of these data could have resulted in an overestimation of the association between IFG and KSD. In addition, the different cutoff value for IFG, 6.1 mmol/L instead of 5.6 mmol/L, could also have led to an overstatement of the relationship. Another possible reason may be related to the use of different methods for selecting subjects and KSD components. In summary, this study was the first to adopt a detailed definition of glycemic status and then use these criteria to divide the subjects into additional groups. The results of this work may thus provide more robust evidence for the association between different glycemic statuses and KSD.
Some of our findings were consistent with those of previous studies reporting that male gender, increasing age and hyperuricemia were associated with an increase in KSD incidence [12526]. However, in contrast to other studies [2728], we did not observe a relationship between urine pH and KSD. The average urine pH of both the KSD (6.2±0.7) and non-KSD groups (6.1±0.7) in this study were higher than those reported in other studies (5.45±0.27 to 6.05±0.42) [2728], which might be the reason for the insignificant association between urine pH and KSD in this paper. Furthermore, the current study lacked the urine pH and biochemical data from the 24-hour urine collections. The subjects in this study were also on random outpatient diets, which may influence urine pH. As for the lack of association between obesity and KSD, the co-linearity effects of hyperglycemia, hyperuricemia, and hypertriglyceridemia may partially explain this insignificant relationship.
One distinguishing feature of this study was that the analysis included explicit categorizations of different glycemic statuses, comprising NGT, isolated IFG, isolated IGT, combined IFG/IGT, and DM. Meanwhile, the pure isolated IFG and isolated IGT categories have rarely been used in previous studies and are mostly used to cross-reference each other. Several limitations of this study should be mentioned. First, because it was a cross-sectional study performed as a health examination in a university hospital, rather than a longitudinal study, we could not confirm whether a causal relationship existed between glycemic control and the risk of KSD. Second, as mentioned previously, we did not have the biochemical data from the 24-hour urine collections, and the urine pH for this study was measured by dipstick urinalysis using a random spot urine sample. Third, the study was limited by a lack of data from the stone composition analyses. Therefore, we were not able to determine whether the different glycemic statuses were associated with certain urinary components or stone types. Fourth, this study did not include plasma insulin data, which kept us from presenting the insulin resistance index. Finally, the diagnosis was made by ultrasonography instead of non-contrast computed tomography, and this may have led us to an underestimation of the prevalence the KSD [29]. Nonetheless, the sensitivity of ultrasonography in the detection of kidney stones has been documented to be 96% [30]. The European Association of Urology also suggested ultrasonography as a primary diagnostic imaging tool in their 2015 urolithiasis guidelines.
In conclusion, isolated IFG, combined IFG/IGT, and DM, rather than isolated IGT, were associated with a higher risk of KSD in this study. In addition, subjects of the male gender who were at least forty and had hyperuricemia also exhibited a greater risk of developing KSD.
ACKNOWLEDGMENTS
I would like to take this opportunity to express gratitude to all of the department faculty members for their help and support. I would also like to express my gratitude to the one and all who, either directly or indirectly, have lent their support to this paper.
Notes
CONFLICTS OF INTEREST: No potential conflict of interest relevant to this article was reported.