Associations between Weight-Adjusted Waist Index and Abdominal Fat and Muscle Mass: Multi-Ethnic Study of Atherosclerosis
Article information
Abstract
Background
The weight-adjusted waist index (WWI) reflected body compositional changes with aging. This study was to investigate the association of WWI with abdominal fat and muscle mass in a diverse race/ethnic population.
Methods
Computed tomography (CT) data from 1,946 participants for abdominal fat and muscle areas from the Multi-Ethnic Study of Atherosclerosis (785 Whites, 252 Asians, 406 African American, and 503 Hispanics) were used. Among them, 595 participants underwent repeated CT. The WWI was calculated as waist circumference (cm) divided by the square root of body weight (kg). The associations of WWI with abdominal fat and muscle measures were examined, and longitudinal changes in abdominal composition measures were compared.
Results
In all race/ethnic groups, WWI was positively correlated with total abdominal fat area (TFA), subcutaneous fat area, and visceral fat area, but negatively correlated with total abdominal muscle area (TMA) and abdominal muscle radiodensity (P<0.001 for all). WWI showed a linear increase with aging regardless of race and there were no significant differences in the WWI distribution between Whites, Asians, and African Americans. In longitudinal analyses, over 38.6 months of follow-up, all abdominal fat measures increased but muscle measures decreased, along with increase in WWI. The more the WWI increased, the more the TFA increased and the more the TMA decreased.
Conclusion
WWI showed positive associations with abdominal fat mass and negative associations with abdominal muscle mass, which likely reflects the abdominal compositional changes with aging in a multi-ethnic population.
INTRODUCTION
Excess body fat, assessed regionally or generally, is recognized as a cause and predictor of various metabolic and cardiovascular diseases [1,2]. Therefore, measurement or assessment of body fat has been a critical issue in medical science [3,4]. On the other hand, cumulative evidence has emphasized the role of muscle mass in the development of several diseases [5]. Specifically, low muscle mass and/or strength has been shown to be an independent indicator of fragility, age-related disorders, and even mortality [6]. However, most anthropometric indices do not distinguish between muscle mass and fat mass and thus tend to be proportional to both [7,8]. This is one of the reasons for the seemingly paradoxical relationship between obesity and some health outcomes [9,10].
A newly proposed anthropometric index, weight-adjusted waist index (WWI), was notable for its ability to assess fat and muscle mass reciprocally. Specifically, in elderly individuals over 65 years, WWI was positively associated with total and abdominal fat measures, but negatively associated with appendicular skeletal muscle mass [11]. Furthermore, a linear positive association of WWI with mortality, as well as cardiometabolic morbidity was observed [12], which was not seen with body mass index (BMI) or waist circumference (WC). However, the associations were only validated in Korean elderly, an East Asian race. Given that there exists substantial difference of body composition by races or ethnic groups, we do not have answers whether the association of WWI with fat and muscle mass is also applicable to the other ethnic groups than East Asian, yet.
Given the aforementioned, the current analysis evaluated the associations between WWI and both abdominal fat and muscle mass measures in different racial and ethnic groups, as well as with the longitudinal changes in abdominal fat and muscle mass in the multi-ethnic population cohort.
METHODS
Study population
The Multi-Ethnic Study of Atherosclerosis (MESA) is a community-based longitudinal cohort study with 6,814 men and women aged 45 to 84 years at baseline, recruited from six United States communities. At this visit, it was comprised of 38% Caucasians, 28% African Americans, 22% Hispanics, and 12% Asians (primarily Chinese). The first examination began in July 2000, and the subsequent examinations were conducted regularly. The latest (6th) examination was from September 2016 to June 2018. Details of the study protocol and design have been published previously [13].
The components of the first examination included personal history, demographic data, socioeconomic status, medications and medical history, occupational and leisure-time physical activity, anthropometry, blood pressure measurement, phlebotomy, spot urine collection for microalbuminuria, and cardiac computed tomography (CT) for coronary calcification and magnetic resonance imaging scans for cardiac structure and function. Informed consent was obtained from all participants at each study clinic.
The abdominal body composition ancillary study consisted of a random subset of 1,975 MESA participants who underwent abdominal CT for measurement of aortic calcium during visit 2 and visit 3 examinations (2002 to 2005). These scans were then interrogated for different body composition measures to include visceral, subcutaneous, and intermuscular fat, as well as lean muscle mass in the abdomen (as described below). This data was used for cross-sectional analyses in the current study. Among the participants who underwent CT during second visit (visit 2), 595 underwent a follow-up CT scan during visit 4 (2005 to 2007), which was used for the longitudinal analyses in this study.
The MESA studies were approved by the Institutional Review Board of each study site and all participants provided written informed consent. The Institutional Review Board of Korea University Anam Hospital also approved this study (IRB number 2021AN0501).
Anthropometric index and variables from abdominal CT scans
Anthropometric measurements included height, body weight, WC, and hip circumference. BMI was calculated as weight (kg) divided by the square of the height (m2). WWI was calculated as WC (cm) divided by the square root of weight in kilograms (√kg).
In the MESA body composition ancillary study, abdominal slices at vertebral level L4/L5 from the abdominal CT were processed using Medical Image Processing, Analysis, and Visualization version 4.1.2 software (MIPAV, National Institutes of Health, Bethesda, MD, USA) that measured the areas of fat, muscle mass, and total tissue by a semiautomated method. The densities of all anatomical structures were measured and expressed in Hounsfield units (HU) for each tissue type. Fat tissue and skeletal muscle tissue were identified as being between −190 and −30 HU and between 0 and 100 HU, respectively [14]. Any densities other than these two HU ranges were labeled as undefined tissue type. Total abdominal fat area (TFA) was subdivided into subcutaneous fat area (SFA) and visceral fat area (VFA) according to the corresponding anatomical location. Muscle area was defined within their unique fascial planes as psoas, rectus abdominis, paraspinal muscle group, and oblique muscle group. Total abdominal muscle area (TMA) was subdivided into muscles of locomotion (psoas muscle) and muscles of stability (rectus abdominis, paraspinal muscle group, and oblique muscle group). Muscle density was the average HU within each muscle’s distinct fascial plane. Inter-rater and intra-rater reliability for total abdominal, subcutaneous, and visceral cavity areas were 0.99 for all measurements. Inter- and intra-rater reliability for all muscle groups ranged from 0.93 to 0.98.
Other variables
Sociodemographic and lifestyle information including age, sex, race, current occupation, family income, insurance status, marital status, detailed history of cigarette smoking and alcohol consumption was obtained from standardized questionnaires. Current and past medical history including medications, treatments, and medical conditions was also obtained. Diabetes mellitus was defined as fasting glucose ≥126 mg/dL or use of glucose-lowering agents. Hypertension was defined as systolic blood pressure ≥140 mm Hg or diastolic blood pressure ≥90 mm Hg or use of anti-hypertensive medications. Using the Typical Week Physical Activity Survey, participants self-reported their time spent in sedentary behavior and in physical activities.
Statistical analysis
Demographics, laboratory measures, and body composition measures using abdominal CT scans at baseline were presented as mean (standard deviation) or number (percentage). A Pearson correlation analysis was performed to investigate the linear relationship between WWI and both abdominal fat and muscle mass measures. The results are presented as correlation coefficients and corresponding 95% confidence intervals based on Fisher’s r-to-z transformation. To compare the distribution of WWI and BMI according to race, age and sex adjusted z-score for WWI and BMI were calculated by regressing WWI or BMI on age and sex, respectively and standardized residuals of the regression models. Density plot of age-sex or sex adjusted WWI z-score drawn by smooth curves that goes through the tops of the histogram bars were displayed according to race (Caucasian, Asian, African American, and Hispanic) and age (45–54, 55–64, 65–74, and 75–84 years). The difference in mean WWI by race and age was evaluated after adjusting for age and sex (separately) using analysis of covariance. Means of fat and muscle measures according to quartiles of WWI were compared by one-way analysis of variance and used Tukey’s method for post hoc analysis.
Five hundred and ninety-five participants underwent repeated abdominal CT during the 4th MESA examination. The mean interval between the 2nd and 4th examinations was 38.6±3.3 months. The longitudinal changes in the anthropometric index and abdominal fat and muscle area measures were assessed using the paired t-test. To evaluate the association between the change in anthropometric index and change in body composition measures, means of percentage changes in TFA or TMA were compared by quartiles of change in WWI or BMI using analysis of variance with adjustment for age.
Statistical significance was set at P<0.05. All statistical analyses were performed using the SAS software version 9.4 (SAS Institute Inc., Cary, NC, USA) and R version 4.0.2 (R Foundation for Statistical Computing, Vienna, Austria).
RESULTS
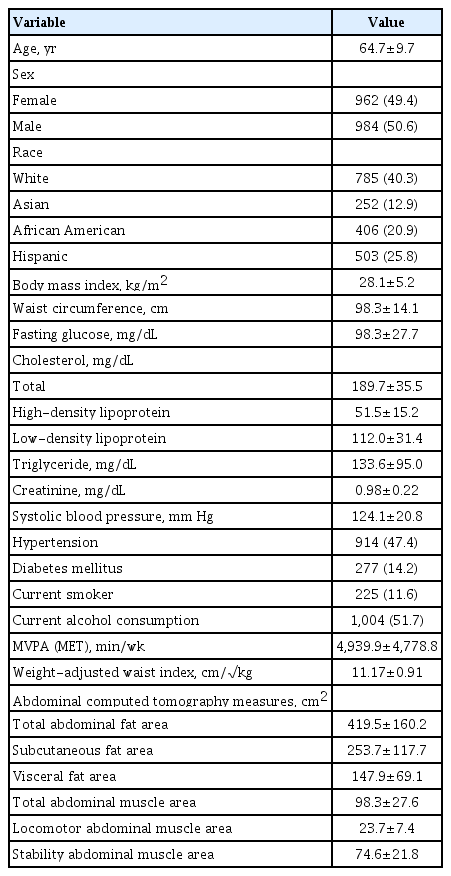
The baseline characteristics of all participants are shown in Table 1. The study participants comprised 785 Caucasians (40.3%), 252 Asians (12.9%), 406 African Americans (20.9%), and 503 Hispanics (25.8%), with mean age, BMI, and WC of 64.7 years, 28.1 kg/m2, and 98.3 cm, respectively. WWI values were approximately normally distributed with a mean of 11.17, standard deviation of 0.91 and range of 8.34 to 14.44 cm/√kg (Supplementary Fig. 1). WWI increased with age in both men and women, and this trend was consistent in all race/ethnic groups (Supplementary Table 1).
WWI is positively associated with abdominal fat area measures but negatively associated with abdominal muscle area measures in all race/ethnic groups
Correlation analyses showed that abdominal fat area measures, including TFA, SFA, and VFA, positively correlated with WWI, whereas all abdominal muscle area measures negatively correlated with WWI, regardless of race/ethnicity (P<0.001 for all analyses) (Supplementary Table 2). Total abdominal muscle radiodensity negatively correlated with WWI, which indicated that the fat component within abdominal muscles was positively associated with WWI.
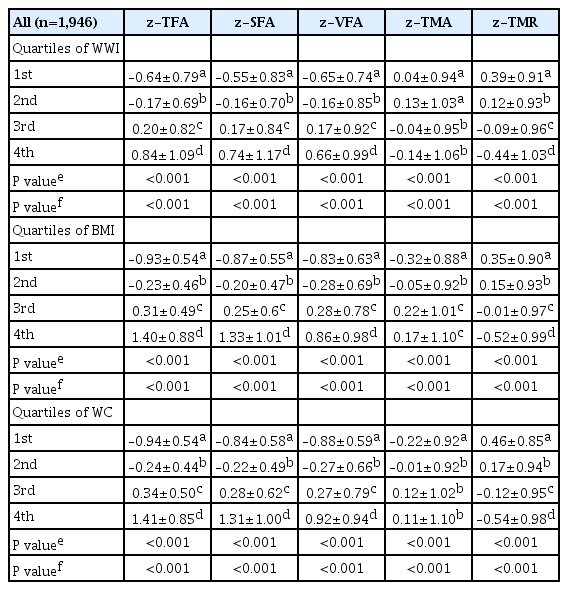
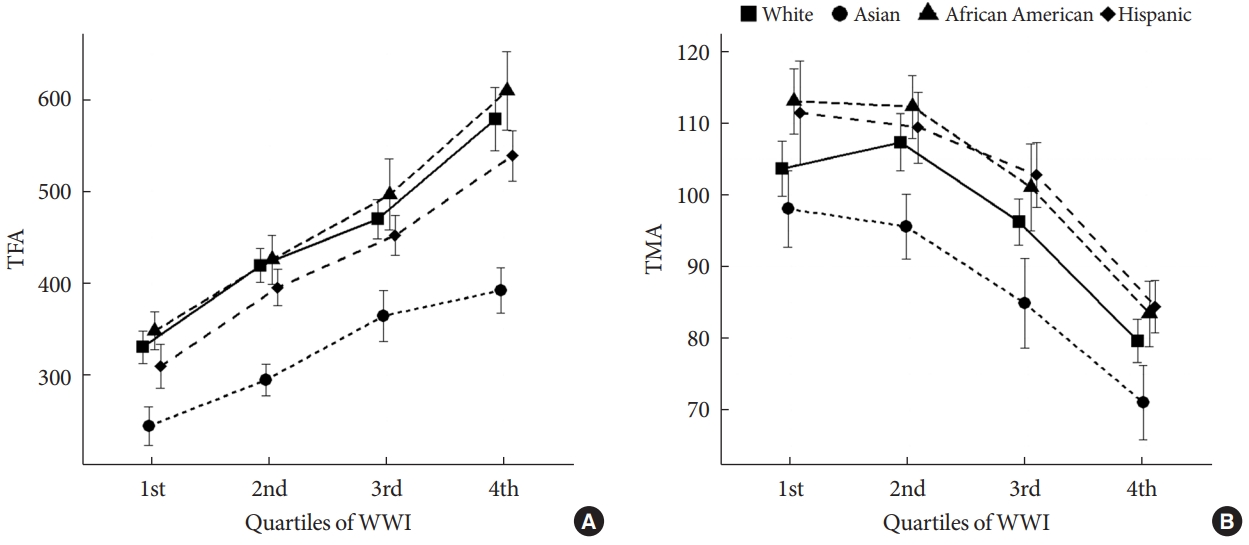
The association of WWI with abdominal fat and muscle area measures was examined by comparing the mean values and z-scores according to WWI quartiles (Table 2, Supplementary Table 3). The mean values of abdominal fat area z-scores showed increasing trends from the lowest quartile to the highest quartile of WWI, whereas those of muscle area z-scores showed decreasing trends with increasing quartiles of WWI. These results were consistent regardless of ethnicity (P for trends <0.001 for all ethnic groups), and age (Fig. 1). Fig. 2 is a representative figure showing the contrasting relationship between abdominal fat and muscle mass measures with WWI. In contrast, BMI or WC did not reflect the fat and muscle area measures differently. Not only fat area but also muscle area showed positive correlation with WC and BMI (Table 2).
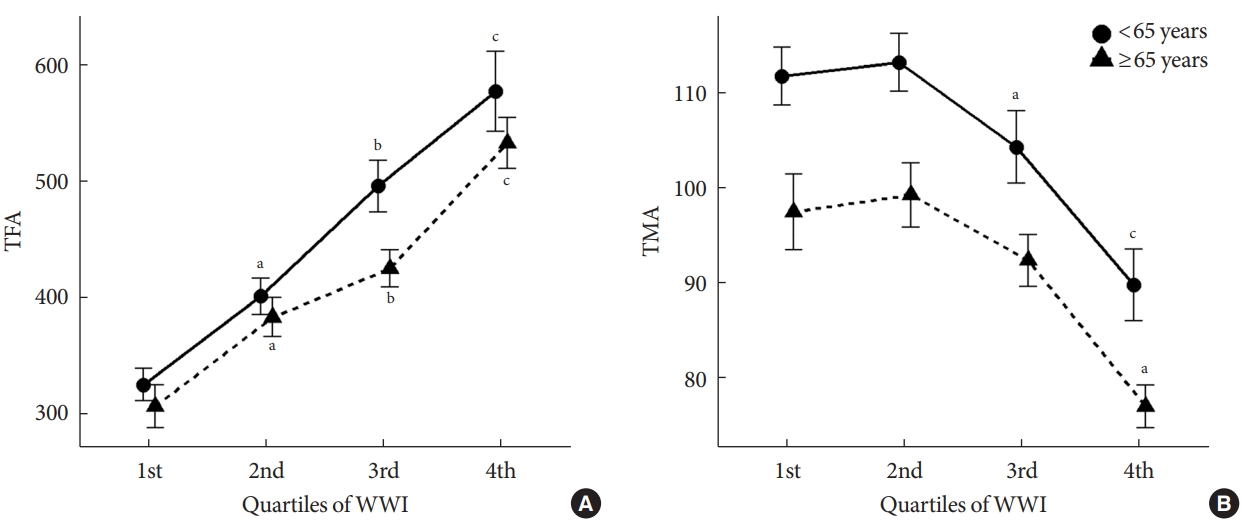
(A) Total abdominal fat area (TFA) and (B) total abdominal muscle area (TMA) by quartiles of weight-adjusted waist index (WWI) in adults older and younger than 65 years. aStatistically different from the 1st quartile group, bStatistically different from the 1st and 2nd quartile groups, cStatistically different from the 1st, 2nd, and 3rd quartile groups.
Age, not race/ethnicity, determines WWI
Given that the trend for increasing WWI with increasing age, we examined the distribution of WWI according to age in all participants in the MESA cohort. Fig. 3A shows the distribution curves by age groups and reveals that WWI is positively associated with age. Compared to the 45 to 54 years age group, mean WWI was significantly higher with increasing age groups (P=0.001 for 55–64 years group and P<0.001 for 65–74 and 75–84 years groups). This relationship was consistent in each ethnic group (Supplementary Fig. 2); however, there were no significant associations between BMI and age.
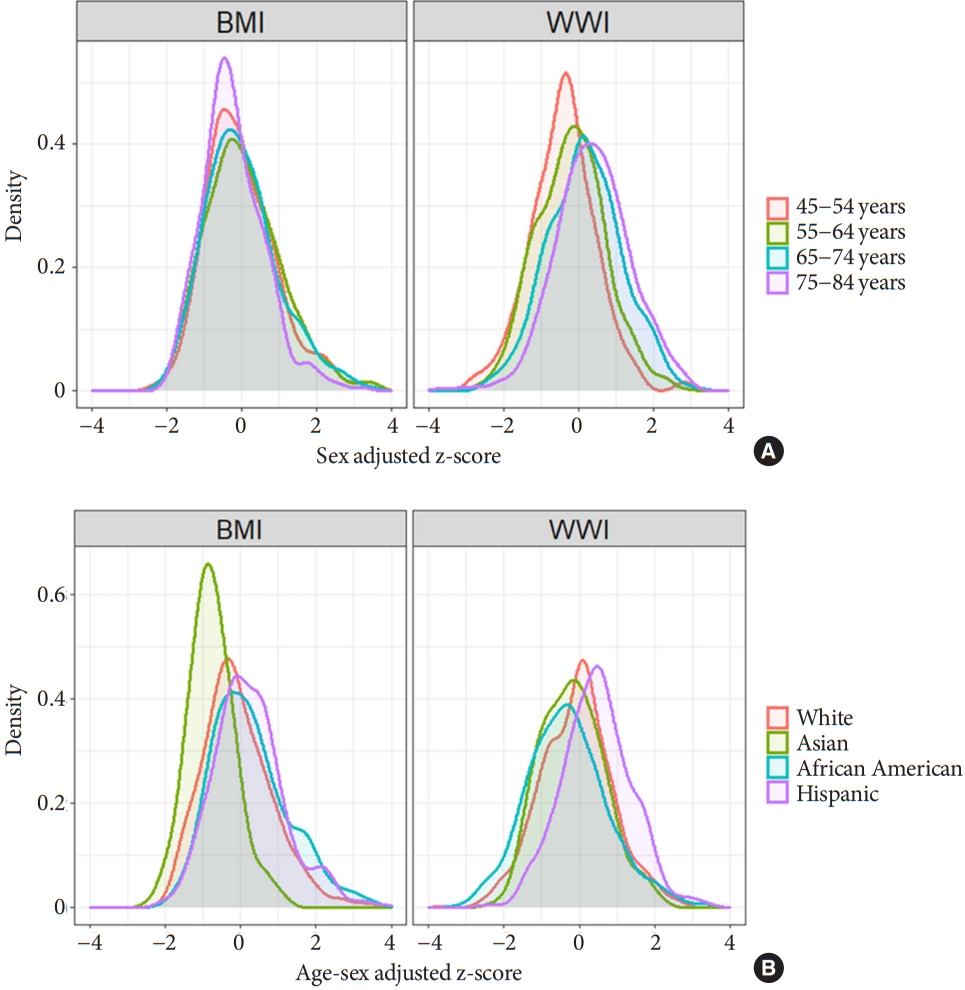
Distribution of body mass index (BMI) and weight-adjusted waist index (WWI) by (A) age and (B) race/ethnicity.
On the other hand, distribution of WWI was similar between ethnic groups. For example, WWI of Asians did not significantly deviate from that of Caucasians and African Americans (P=0.512, and P=0.720, respectively) (Fig. 3B). However, BMI of Asians was significantly lower than that of other ethnic groups (P<0.001 for all).
WWI reflects body compositional changes with aging
We examined the longitudinal changes in CT-derived fat and muscle area measures and their associations with anthropometric index. Over 38.6 months, the mean TFA and VFA increased, but the TMA decreased in all participants (Supplementary Table 4). Mean SFA increased significantly only in men, not in women. During the same period, BMI did not change, but the WC and WWI significantly increased. Increase in WWI was commonly observed in all age groups, but the direction of changes in BMI and WC differed with age (Supplementary Table 5).
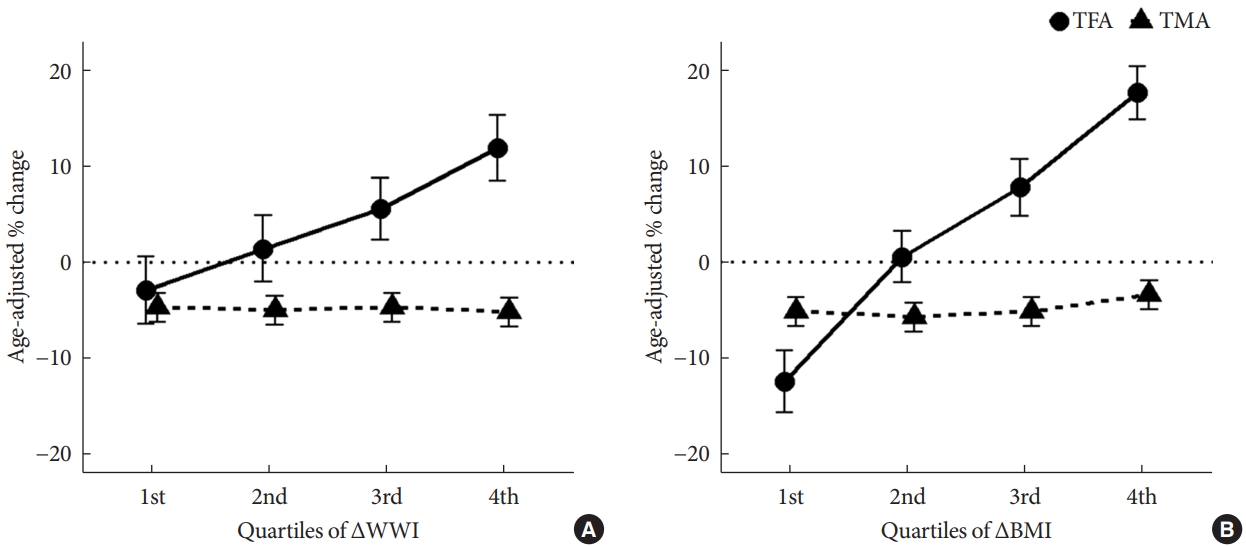
To examine whether longitudinal changes in WWI were associated with increasing fat mass and decreasing muscle area, we examined the percentage changes of TFA and TMA according to quartiles of changes in WWI (delta WWI) (Fig. 4). We found that as WWI increased, TFA increased (P<0.001) and TMA decreased, although changes in TMA were not statistically significant (P=0.963). In contrast, as BMI increased, both TFA and TMA increased (P<0.001 and P=0.056, respectively).
DISCUSSION
In this study, we found that WWI was positively associated with abdominal fat measures, but negatively with abdominal muscle mass measures, regardless of race/ethnicity. Also, we showed that WWI increased with age in all races, but there was a small difference in the mean values and distribution between races. Finally, we determined that WWI also reflects abdominal composition changes with aging, i.e., increase in abdominal fat mass and decrease in muscle mass. Collectively, WWI could be an indicator of fat and muscle composition changes related to aging commonly applicable to multiethnic groups.
As the role of muscle or lean mass in the development of age-related disorders has been elucidated, measurement of muscle mass has become increasingly important as a measure of body composition. However, estimation of muscle mass without a special device is difficult, and no anthropometric index so far has been sufficiently verified as an indicator of muscle mass [15,16]. Similar to a previous paper on WWI in Korean elderly people, the results presented above indicate that WWI was differentially associated with fat and muscle mass in a multi-ethnic population. However, this study is limited because the analyses were based solely on abdominal CT scan-derived measures, and not on the whole-body composition data. Although we found weaker associations of WWI with muscle mass measures compared to that of a previous Korean study, we showed the similar patterns with the previous study. These findings suggest that the WWI could serve as a body composition index, which is not limited to East Asians, and can be commonly applied in diverse populations.
Furthermore, we found that WWI was negatively associated with abdominal muscle radiodensity (represented by HU), indicating a positive association between WWI and fat infiltration in the muscles. Interestingly, the correlation of abdominal muscle radiodensity with WWI (r=−0.516) was higher than that with BMI (r=−0.242) or WC (r=−0.300) (data not shown in the results). Because abdominal muscle radiodensity has been found to be an indicator of myosteatosis, metabolic derangement such as insulin resistance and alterations in adipokines, as well as mortality in cancer patients [17-20], the high correlation of WWI with abdominal muscle mass radiodensity suggests WWI could be an indicator of diverse health outcomes. Although we were unable to assess the associations of WWI with other organ radiodensities, such as liver radiodensity, these associations should be tested in future studies for the broader applications of WWI as a health indicator.
Another significant finding of this study was that the racial difference of WWI distribution was small. BMI, a widely-used anthropometric index, revealed fundamental differences between races with different body shape or different fat distribution; hence, different standards are applied according to race [21,22]. For example, there are different BMI and WC cut-points for defining obesity in Asians compared to Caucasians [23,24]. In this multiethnic cohort, we also found certain differences by races (e.g., mean BMI was significantly lower in Asians than in Whites). However, in the case of WWI, there was no significant difference in the mean and distribution between Caucasians and Asians. This suggests that WWI could be a universal health index applicable to various races/ethnic groups. This finding can be explained partially by the fact that WWI reflects the ratio of fat and muscle mass, but not the absolute fat amount, and shows a direct proportional relationship with aging.
Regardless of race, WWI was observed to increase with age. In addition, the longitudinal increase in WWI reflected the age-related changes in abdominal fat and muscle composition. Since this is a short-term change spanning over an average of 38 months, a long-term study will be needed to establish an association that is more reliable.
The previous study on WWI only included elderly individuals over 65 years of age, and it was unclear whether the bidirectional association of WWI with fat and muscle mass measures would be reproducible in younger people. This study included 977 participants younger than 65 years (50.2% of total participants) and found that the associations of WWI with fat and muscle measures did not differ with age. Therefore, our data indicated that WWI could be generally applicable to adults of various races and ethnicities, although we still need more evidence with respect to younger adults and adolescents.
This study has several limitations. First, as mentioned earlier, we did not have relevant data regarding the overall body fat and appendicular muscle mass of participants. However, we assumed that the relationship between WWI and various muscle measures, including appendicular muscle mass, would be similar based on previous study results. Second, the number of Asians was relatively small in the current cohort data. Third, the association of WWI with health outcomes remains to be determined. Further studies will be needed to provide the relevant information regarding compatible cut-offs for WWI.
In conclusion, this study showed that WWI had a differential association with fat and muscle mass measures in a multi-ethnic population. Moreover, WWI was closely associated with age and age-related body compositional changes. Further investigation is needed for the validation of this index as a predictor of various health outcomes.
SUPPLEMENTARY MATERIALS
Supplementary materials related to this article can be found online at https://doi.org/10.4093/dmj.2021.0294.
Mean±standard deviation of weight-adjusted waist index according to age and race
Correlation coefficient (95% CI) between weight-adjusted waist index and body composition measures according to ethnicity
Mean values of muscle and fat measures by weight-adjusted waist index quartiles
A longitudinal analysis of body composition cohort (from 2nd exam to 4th exam)
Longitudinal changes of anthropometric index by age groups
(A) Distribution of weight-adjusted waist index (WWI) (mean±standard deviation, 11.17±0.91; median, 11.05 [interquartile range, 10.53 to 11.68]; range, 8.34 to 14.44). (B) quantile-quantile (Q-Q) plot.
Distribution of weight-adjusted waist index (WWI) by age in each ethnic group.
Notes
CONFLICTS OF INTEREST
No potential conflict of interest relevant to this article was reported.
AUTHOR CONTRIBUTIONS
Conception or design: N.H.K.
Acquisition, analysis, or interpretation of data: J.C., C.A.V., M.H.C., M.A.A., N.H.K.
Drafting the work or revising: J.Y.K., N.H.K.
Final approval of the manuscript: N.H.K.
FUNDING
None
Acknowledgements
The authors thank the all investigators, staffs, and participants of the MESA study.

