Association of Combined TCF7L2 and KCNQ1 Gene Polymorphisms with Diabetic Micro- and Macrovascular Complications in Type 2 Diabetes Mellitus
Article information

Abstract
Background
Vascular complications are the major morbid consequences of type 2 diabetes mellitus (T2DM). The transcription factor 7-like 2 (TCF7L2), potassium voltage-gated channel subfamily Q member 1 (KCNQ1), and inwardly-rectifying potassium channel, subfamily J, member 11 gene (KCNJ11) are common T2DM susceptibility genes in various populations. However, the associations between polymorphisms in these genes and diabetic complications are controversial. This study aimed to investigate the effects of combined gene-polymorphisms within TCF7L2, KCNQ1, and KCNJ11 on vascular complications in Thai subjects with T2DM.
Methods
We conducted a case-control study comprising 960 T2DM patients and 740 non-diabetes controls. Single nucleotide polymorphisms in TCF7L2, KCNQ1, and KCNJ11 were genotyped and evaluated for their association with diabetic vascular complications.
Results
The gene variants TCF7L2 rs290487-T, KCNQ1 rs2237892-C, and KCNQ1 rs2237897-C were associated with increased risk of T2DM. TCF7L2 rs7903146-C, TCF7L2 rs290487-C, KCNQ1 rs2237892-T, and KCNQ1 rs2237897-T revealed an association with hypertension. The specific combination of risk-alleles that have effects on T2DM and hypertension, TCF7L2 rs7903146-C, KCNQ1 rs2237892-C, and KCNQ1 rs2237897-T, as genetic risk score (GRS), pronounced significant association with coronary artery disease (CAD), cumulative nephropathy and CAD, and cumulative microvascular and macrovascular complications (respective odds ratios [ORs] with 95% confidence interval [95% CI], comparing between GRS 2–3 and GRS 5–6, were 7.31 [2.03 to 26.35], 3.92 [1.75 to 8.76], and 2.33 [1.13 to 4.79]).
Conclusion
This study demonstrated, for the first time, the effect conferred by specific combined genetic variants in TCF7L2 and KCNQ1 on diabetic vascular complications, predominantly with nephropathy and CAD. Such a specific pattern of gene variant combination may implicate in the progression of T2DM and life-threatening vascular complications.
Highlights
• Vascular complications are the life-threatening consequences of type 2 diabetes mellitus (T2DM).
• The SNPs in TCF7L2 (rs290487, rs7903146) and KCNQ1 (rs2237892, rs2237895, and rs2237897) revealed association with T2DM and hypertension (HT).
• Specific combination of two risk-alleles in KCNQ1, T2DM-risk rs2237892 (C) and HT-risk rs2237897 (T), associated with the risk of coronary artery disease (CAD) and cumulative nephropathy (DN) and CAD in subjects with T2DM.
• Furthermore, a combination of TCF7L2 HT-risk rs7903146 (C) with KCNQ1 rs2237892 (C) and rs223797 (T), pronounced association with greater effect compared to two risk-alleles.
• This was the first to report the effect conferred by a specific pattern of combination of risk-alleles for T2DM and HT on the risk of diabetic vascular complications.
INTRODUCTION
Type 2 diabetes mellitus (T2DM) is a leading cause of morbidity and mortality, arising substantial public health burden around the world. The predominant clinical outcomes of chronic T2DM are vascular complications that contribute to serious health problems, reducing the quality of life, and have a significant impact on healthcare budgets [1]. Diabetic vascular complications, partly arising from chronic hyperglycemia, can affect both microvascular and macrovascular system. Microvascular complications include retinopathy (leading to blindness and visual disability), nephropathy (leading to renal failure), and neuropathy (leading to incapability and amputation). Macrovascular complications comprise of coronary artery disease (CAD), peripheral arterial disease, and stroke [2]. Hypertension is the most common comorbidity in patients with T2DM, which is likely to aggravate the progression of both micro- and macrovascular complications [3]. Furthermore, several studies have revealed the common metabolic pathway shared by diabetes and hypertension during their development and progression, suggesting the involvement of common genetic and environmental factors in their etiology [4]. The global prevalence of diabetic vascular complications, in a recent observational study in 38 countries worldwide, was 18.8% and 12.7% for microvascular and macrovascular complications, respectively [5]. The prevalence of diabetic complications in Thai was 37% for diabetic nephropathy, 31.2% for diabetic retinopathy, 28.9% for cardiovascular disease (CVD), and 10.6% for the cerebrovascular disease [6].
The genetic susceptibility to T2DM has been widely investigated. Several single nucleotide polymorphisms (SNPs) in the transcription factor 7-like 2 gene (TCF7L2), the potassium voltage-gated channel subfamily Q member 1 gene (KCNQ1), and the inwardly-rectifying potassium channel, subfamily J, member 11 gene (KCNJ11) have reported to be associated with the development of T2DM and its vascular complications [7-18], with variable results among the different ethnic population. TCF7L2 is the transcriptional effector in the canonical Wnt-signaling pathway involving in the regulation of incretin hormone production, pancreatic β-cell development, vascular development, and may involve in insulin signaling [19,20]. A common T2DM-associated variant, TCF7L2 rs7903146, has also been associated with hypertension [21], and the development of diabetic retinopathy [7,8], nephropathy [9,10], and CAD [8]. KCNQ1 gene encodes a pore-forming subunit of voltage-gated potassium (K+) channel, also known as Kv7.1, which plays a physiological role in several tissues including the cardiovascular system, the pancreas, and the kidney [22]. Genetic variations within KCNQ1 are strongly associated with T2DM, insulin secretion, and impaired fasting blood glucose [23,24]. KCNQ1 SNPs have also been associated with hypertension [13], as well as an increased risk of diabetic nephropathy [12] and macrovascular disease [13]. The KCNJ11 encodes a protein Kir6.2 that is a pore-forming subunit of ATP-sensitive potassium channel (KATP). KATP channel is highly expressed in the pancreas and plays an important role in the regulation of insulin secretion in pancreatic β-cells [25,26]. Polymorphisms in KCNJ11 have been initially reported to be associated with T2DM [27] and subsequently with hypertension [17], CAD [16], and diabetic retinopathy [18].
Although the association of polymorphisms in TCF7L2, KCNQ1, and KCNJ11 genes with T2DM have consistently replicated in multiple ethnic groups, their association with vascular complications remains inconsistent [7-18]. The influence of single SNPs on the risk of diabetic complications generally has a modest effect, therefore the cumulative effect of multiple risk alleles as genetic risk score (GRS) may provide a better tool for the evaluation of the risk for T2DM-related complications. Several studies have reported that GRSs comprising diabetes-risk SNPs were associated with T2DM [28], hyperglycemia [29], and insulin secretion or insulin resistance [30,31], but not with diabetic complications. There is also evidence that SNPs in these T2DM-related genes have been associated with hypertension [13,17,21]. We speculated that a combination of risk-associated alleles for both T2DM and hypertension might better confer susceptibility to diabetic vascular complications. However, there were no studies regarding the effect of such a risk-variant combination on diabetic complications. The present study therefore aimed to investigate the effects of individual gene variants and GRS comprising diabetes and hypertension risk SNPs on various diabetic vascular complications.
METHODS
Study population
The study protocol was reviewed and approved by Khon Kaen University Ethics Committee for Human Research (Expedited Review: HE591430 and HE601094), in accordance with the Declaration of Helsinki, before the study was conducted. Leftover blood samples were collected from (1) community-based Thai subjects attending annual health check-up at Health Center 15, Bangkok; (2) hospital-based Thai subjects who visited for clinical investigation at Srinagarind Hospital, Faculty of Medicine, Khon Kaen University; and (3) Thai patients who attended for cardiovascular investigation at Queen Sirikit Heart Center of the Northeast, Faculty of Medicine, Khon Kaen University. Exclusion criteria: subjects with type 1 diabetes mellitus, gestational diabetes, or maturity-onset diabetes of young adults were excluded; those who have chronic diseases that affect the metabolic or biochemical parameters, such as hypothyroidism, hyperthyroidism, liver disease, kidney disease, and cancer were also excluded from the study. Based on the retrospective medical record and laboratory data, 1,700 samples collected from Thai subjects age ≥35 years who were enrolled, comprising 960 T2DM patients and 740 non-diabetic subjects. T2DM was defined for subjects who (1) had fasting plasma glucose (FPG) of ≥7.0 mmol/L; (2) had glycated hemoglobin (HbA1c) of ≥6.5%; and/or (3) were under anti-diabetic medication [32]. T2DM patients who had at least one complication were categorized as diabetes mellitus (DM) with complication subgroup. Definition and assessment for diabetic complications have detailed description in the Supplementary methods [33-36]. Among 960 DM patients, 383 were patients with diabetic complications. The non-diabetes (non-DM) group definition for individuals who had no history of T2DM medication, whose blood HbA1c content was less than 6.5%, and the FPG level was less than 7.0 mmol/L.
Biochemical parameters and demographic data
Hypertension was considered if the subject had systolic blood pressure (SBP) ≥140 mm Hg and diastolic blood pressure (DBP) ≥90 mm Hg or had a medical record and treatment of hypertension [37]. Obesity defined by body mass index (BMI) ≥25 kg/m2 [38]. The definition of metabolic syndrome (MetS), dyslipidemia (DL), hypertriglyceridemia (HTG), and low level of high-density lipoprotein cholesterol (HDL-C) followed the National Cholesterol Education Program Adult Treatment Panel III (NCEP ATP III) guideline. The MetS was defined upon presenting with three or more of the following conditions: (1) waist circumference ≥90 cm (male) or ≥80 cm (female); (2) serum triglyceride (TG) levels ≥1.7 mmol/L (HTG); (3) HDL-C <1.03 mmol/L (male) or <1.29 mmol/L (female) (low HDL-C); (4) SBP >130 mm Hg or DBP >85 mm Hg; and (5) FPG ≥6.1 mmol/L [39]. DL was defined by having one or more of the abnormal lipid profile (total cholesterol [TC] ≥5.17 mmol/L, TG ≥1.7 mmol/L, low-density lipoprotein cholesterol [LDL-C] >2.6 mmol/L, and HDL-C <1.03 mmol/L for male or <1.29 mmol/L for female).
SNPs selection
Interested SNPs were selected for the association study with T2DM, hypertension, and diabetic complications. According to the candidate gene studies, the original genome-wide association studies, and the replication studies in various ethnic groups, five common SNPs within three known functional genes, TCF7L2, KCNQ1, and KCNJ11, were selected for the present study. Except for TCF7L2 rs7903146, the minor allele frequency (MAF) of SNPs TCF7L2 rs290487, KCNQ1 (rs2237892 and rs2237897), and KCNJ11 rs5219, were greater than 5% in East Asian population, and these SNPs were also reported to be associated with T2DM in several populations. Although the MAF frequency of TCF7L2 rs7903146 was low in the East Asian population (Chinese and Japanese with MAF 0.02 and 0.03, respectively), two studies in Indian population have indicated that the MAF of TCF7L2 rs7903146 (T allele) was 14.2% [40] and 31% [41].
Genotyping
Genomic DNA extracted from peripheral blood leukocytes utilizing commercial DNA isolation kit (Qiagen, Hilden, Germany) according to the manufacturer’s protocol. For TCF7L2 rs290487 and KCNQ1 rs2237892, genotyping was performed using allele-specific polymerase chain reaction (AS-PCR) technique. Other SNPs were genotyped using polymerase chain reaction-restriction fragment length polymorphism (PCR-RFLP). All primers were designed using Primer-BLAST program (National Center for Biotechnology Information) (Supplementary Table 1). The PCR reaction was performed in a total volume of 25 μL mixture containing 100 ng of DNA template, 200 mM of each deoxynucleoside triphosphate (dNTP; Vivantis, Shah Alam, Malaysia), 1.0 mM of each primer (Integrated DNA Technologies, Coralville, IA, USA), and 0.5 U of Taq DNA polymerase (Invitrogen, Carlsbad, CA, USA). For PCR-RFLP, the DNA amplicon was further digested with restriction endonuclease (New England Biolabs, Ipswich, MA, USA). The analysis of DNA products was performed by electrophoresis on 2.5% agarose gels and then visualized under a UV transilluminator. The genotyping results were validated by DNA sequencing (1st BASE, Seri Kembangan, Malaysia) of 10% randomly selected DNA samples. All eight SNPs’ evaluations performed for the association with, T2DM, hypertension, and diabetic complications.
Statistical analysis
All of the statistical analysis was carried out using SPSS software version 17 (SPSS Inc., Chicago, IL, USA). The distributions of all SNP genotypes and alleles in the study population were analyzed for the concordance with the Hardy-Weinberg equilibrium (HWE) utilizing the HW calculator (http://www.oege.org/software/). The difference of continuous variables between two groups was analyzed using Student’s t-test and among three or more groups was by one-way analysis of variance (ANOVA). Clinical and biochemical parameters were reported as the mean±standard deviation (for continuous variables) or percentages (for categorical parameters). The individual or combined effect of multiple SNPs on the risk of diabetic complication was evaluated by logistic regression model and expressed as odds ratio (OR) with 95% confidence interval (95% CI), adjusted for covariates including age, sex, hypertension, DL, HbA1c, and BMI. Haplotype analysis was carried out using software programs “Haploview ver.4.2 (https://haploview.software.informer.com/4.2/)” and “Arlequin ver.3.5 (http://cmpg.unibe.ch/software/arlequin35/Arl35Downloads.html).” For all analyses, a two-sided P value of <0.05 considered as statistically significant. A permutation test was used to adjust for a significant threshold in multiple comparison testing. The statistical power for each SNP was estimated using Genetic Association Study (GAS) Power Calculator (http://csg.sph.umich.edu/abecasis/gas_power_calculator/index.html).
RESULT
Baseline demographic and clinical characteristics of the study population
A total number of 1,700 subjects enrolled, comprising 740 non-DM, 577 DM without complications, and 383 DM with complications. The baseline demographic and clinical characteristics of study subjects are presented in Table 1. The prevalence of male subjects was higher in DM (44.7%) than in the non-DM group (25.1%) (P<0.001). The percentages of subjects with hypertension, obesity, MetS, HTG, and low HDL-C were significantly greater in the T2DM group than in the non-DM group. The means of BMI, SBP, HbA1c, FPG, TG, TG/HDL-C ratio, blood urea nitrogen (BUN), creatinine, and uric acid were also significantly higher in T2DM patient than in non-DM group. Other parameters such as DBP, TC, HDL-C, LDL-C, non-HDL-C, and estimated glomerular filtration rate (eGFR), revealed significantly lower in T2DM patients than in non-DM. For the medication in T2DM patients, the proportion of patients who received treatment with anti-diabetic drugs was not different between T2DM patients without and with complications; with an exception for biguanides, the percentage of patients under treatment was higher in a group without complication than in those with complication. The proportion of patients using insulin was higher in patients with complications than in those without complications. The percentage of patients treated with antihypertensive drugs and anti-hyperlipidemic drugs were higher in patients with complications than in patients without complications (Supplementary Table 2).
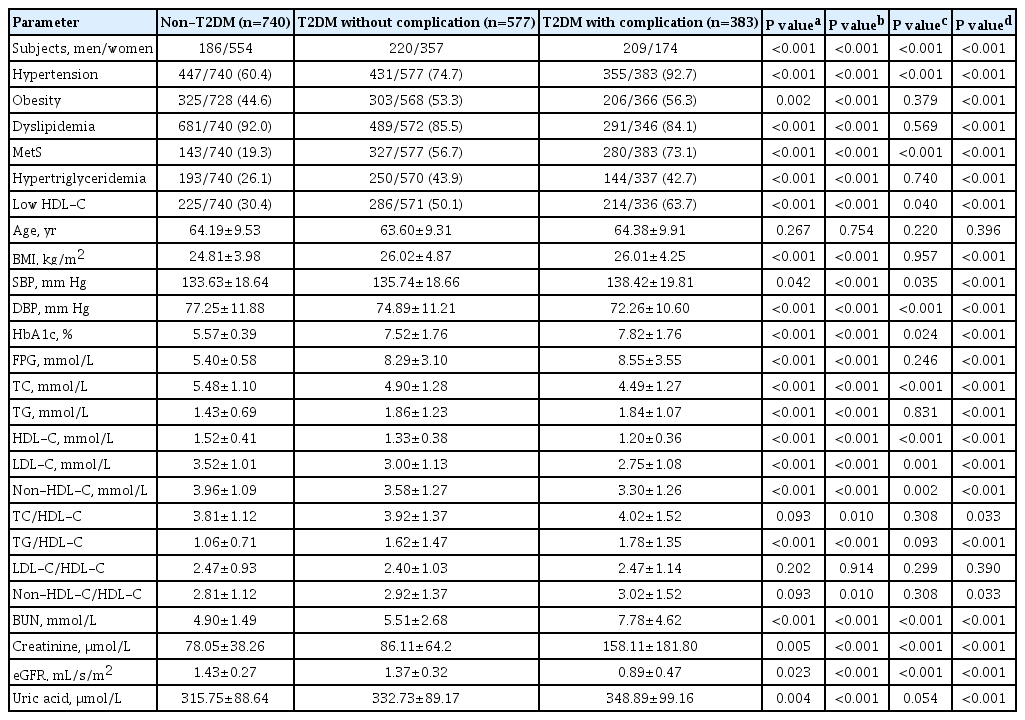
Demographic and clinical characteristics of the study population
Analysis of the association between SNPs and T2DM
All SNPs were first investigated for their relationship with T2DM. The genotype distribution for each of these gene variants was consistent with the HWE (P>0.05) in the study population. As shown in Table 2, the following SNPs were significantly associated with an increased risk of T2DM after adjusting for age, sex, hypertension, DL, and BMI. TCF7L2 rs290487 presented with OR 1.33, 95% CI 1.05 to 1.68, P=0.017 (recessive model, TT vs. CC+TC). KCNQ1 rs2237892 revealed an association with OR (95% CI) as: 1.65 (1.13 to 2.43), P=0.010 (CC vs. TT); 1.54 (1.06 to 2.23), P=0.024 (dominant model, CT+CC vs. TT); and 1.25 (1.01 to 1.54), P=0.037 (recessive model, CC vs. TT+CT). KCNQ1 rs2237897 had an association with OR (95% CI) as: 1.88 (1.22 to 2.90), P=0.004 (CC vs. TT); 1.76 (1.15 to 2.68), P=0.009 (dominant model, CC+CT vs. TT); and 1.26 (1.02 to 1.55), P=0.031 (recessive model, CC vs. TT+CT). There were no associations with T2DM for rs7903146 in TCF7L2 and rs5219 in KCNJ11.

Association between SNPs and type 2 diabetes mellitus in all subjects
Analysis of the association between SNPs and hypertension
Hypertension is the most common comorbidity of T2DM that may aggravate the development of micro- and macrovascular complications in T2DM patients [3]. The influence of hypertension on diabetic vascular complications firstly evaluated in all T2DM patients. In the present study, T2DM patient with hypertension had 4.32 times risk of progression with overall vascular complications (OR, 4.32; 95% CI, 2.75 to 6.79; P<0.001), 4.06 time of developing CAD (OR, 4.06; 95% CI, 1.88 to 8.75; P<0.001), and 7.43 time of developing nephropathy (OR, 7.43; 95% CI, 3.39 to 16.32; P<0.001), as compared with those without hypertension (Supplementary Tables 3 and 4).
To investigate the relationship of all five SNPs with hypertension, regardless of diabetes, all study population was categorized into hypertension and non-hypertension groups (Supplementary Table 5). Individual SNPs then went through evaluation, by which only TCF7L2 rs7903146 and rs290487 revealed an association with a risk of hypertension (Supplementary Table 6). The CC genotype of rs7903146, as compared with CT, revealed a significant association (OR, 1.56; 95% CI, 1.05 to 2.32; P=0.030), whereas C allele of rs290487 showed a marginal effect (OR, 1.29; 95% CI, 1.00 to 1.66; P=0.050; dominant model). Because the incidence of hypertension is likely to increase with age; thus, an analysis was conducted in an age group of 60 to 94 (mean 68.44 years). In these old age subjects, KCNQ1 rs2237892 and rs2237897 revealed a significant association with hypertension. Comparing with CC genotypes, TT genotypes of both rs2237892 and rs2237897 increased the risk of hypertension (OR, 1.75; 95% CI, 1.03 to 2.99; P=0.040) and (OR, 1.99; 95% CI, 1.08 to 3.67; P=0.027), respectively (Table 3). Association was also found for TCF7L2 rs290487 C allele (OR, 1.41; 95% CI, 1.04 to 1.90; P=0.026; dominant model).
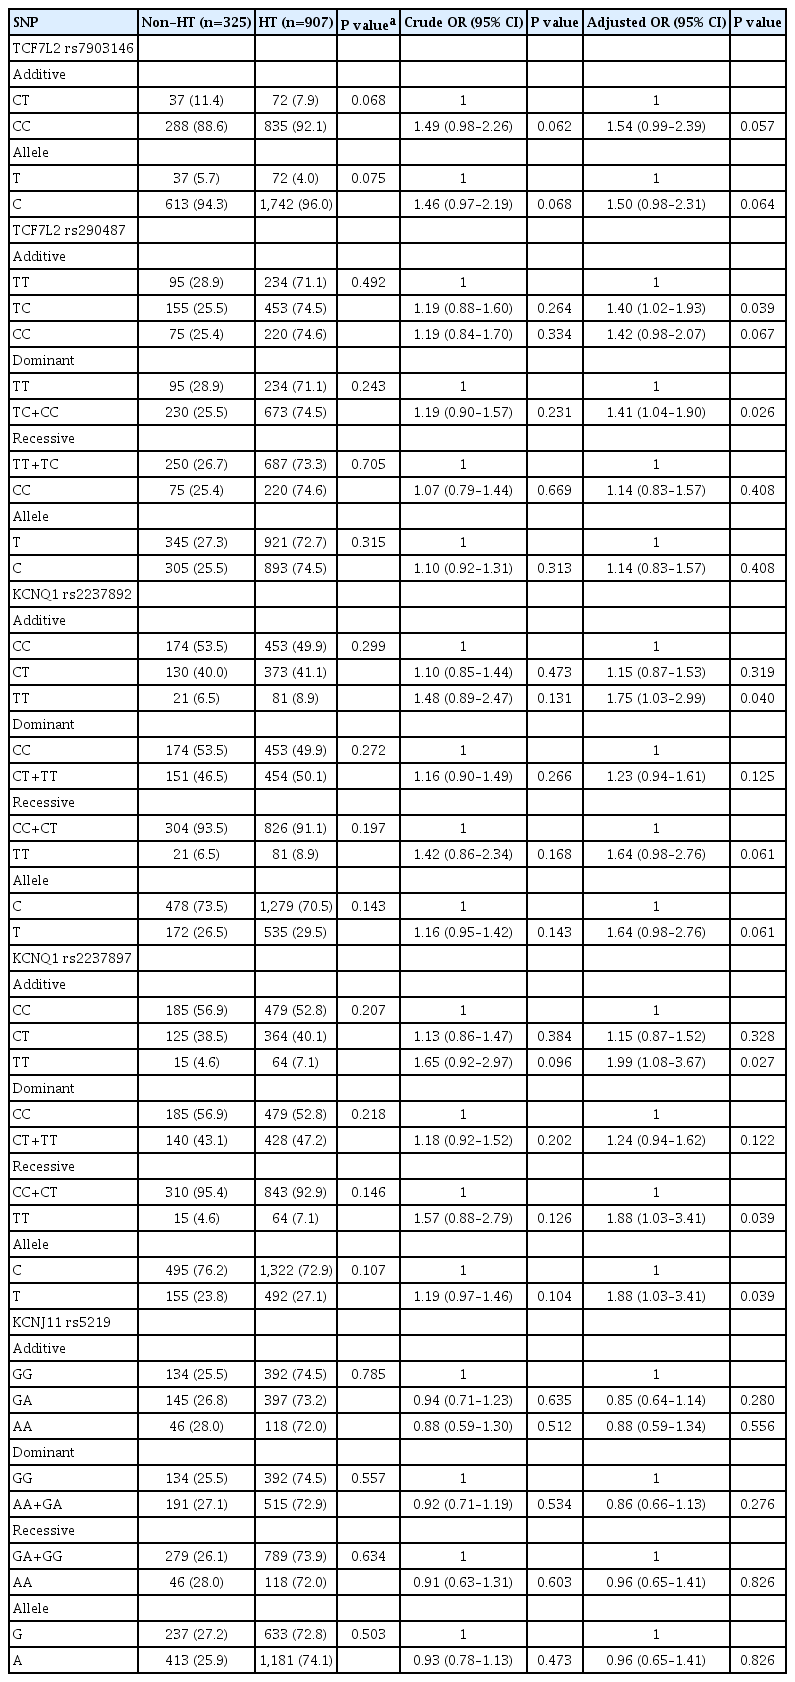
Association between SNPs and hypertension in old-age subjects
Analysis of the association between individual SNPs and diabetic complications
Of all T2DM patients (n=960), 383 subjects had cumulative (micro- and macro-) vascular complications, of which 239 patients had microvascular complications (12.0% retinopathy, 18.9% nephropathy, and 3.6% neuropathy), 121 had macrovascular complications (11.7% CAD and 3.5% Stroke), and 23 had both micro- and macrovascular complications (Supplementary Table 7). Among 960 T2DM patients, of all five SNPs analyzed, there were no associations for individual SNPs with the complications (Supplementary Table 8).
Combined effects of TCF7L2 and KCNQ1 risk alleles on diabetic complications
To evaluate the combined effect of T2DM susceptibility gene polymorphisms on diabetic complications, a GRS was formulated based on the summation of risk-contributing alleles from the studied SNPs that were associated with T2DM and hypertension. Based on the previous analysis, four SNPs (TCF7L2 rs7903146, TCF7L2 rs290487, KCNQ1 rs2237892, and KCNQ1 rs2237897) were selected for the construction of GRS. For each biallelic SNP, a risk score of 0 was defined for homozygous of non-risk alleles, score 1 for heterozygous of risk and non-risk alleles, and score 2 for homozygous of two risk alleles. For a combination of two or more SNPs, the GRS would be between 0 and 4 for combined two SNPs, and between 0 and 6 for combined three SNPs.
Diabetic nephropathy and CAD are two major complications in our study T2DM population and known to cause mortality in T2DM patients. They were mainly considered for the association study. A combination of any two risk-alleles was first investigated; the overall analyses are presented in Supplementary Tables 9-16. However, only combined two risk-alleles in KCNQ1 SNPs, rs2237892 (C) and rs2237897 (T), revealed the significant associations. The high-GRS group (GRS 3–4) was associated with increased risks of CAD (OR, 7.31; 95% CI, 2.03 to 26.35; P=0.002), cumulative nephropathy and/or CAD (OR, 3.49; 95% CI, 1.49 to 8.15; P=0.004), and borderline association with cumulative micro- and macrovascular complications (OR, 2.06; 95% CI, 0.97 to 4.39) as compared with a group of GRS 0–1 (Fig. 1). Haplotype analysis was performed for rs2237892 (C/T) and rs2237897 (C/T). In accordance with the combined effect of two risk-alleles, C-T haplotype was also significantly associated with CAD (OR, 5.64; 95% CI, 1.26 to 25.28; P=0.024), as compared with T-C haplotype (Supplementary Tables 17-19).
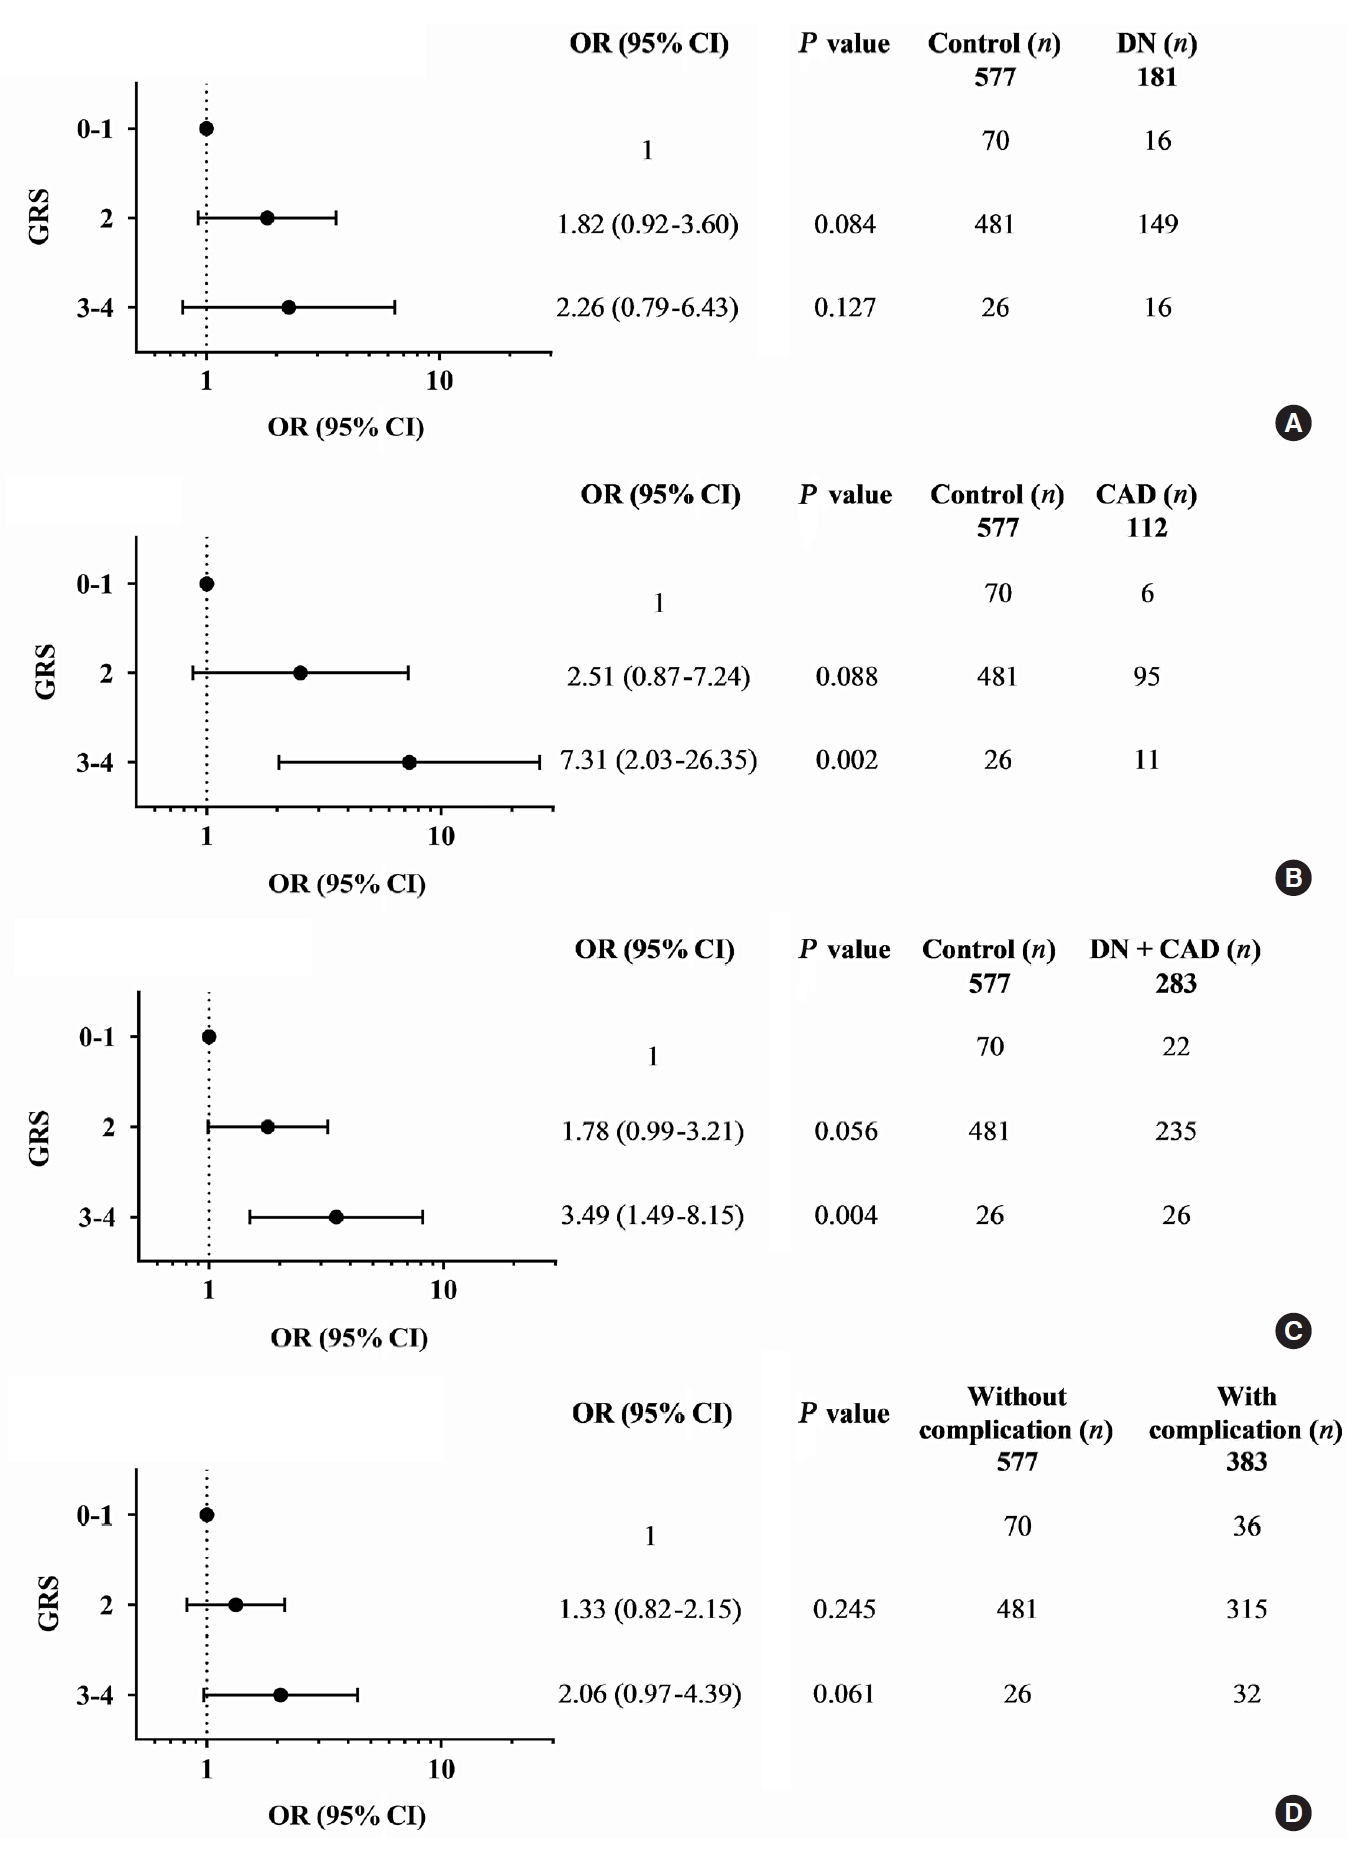
Adjusted odds ratios (ORs) and 95% confidence interval (CI) for the combined effect of KCNQ1 rs2237892 and rs2237897 risk alleles, as genetic risk score (GRS), on vascular complications in type 2 diabetes mellitus patients: (A) diabetic nephropathy (DN), (B) coronary artery disease (CAD), (C) cumulative DN and CAD, and (D) cumulative micro- and macrovascular complications; GRS 0–1 as reference; ORs adjusted for age, sex, hypertension, dyslipidemia, glycated hemoglobin, and body mass index.
A combination of multiple risk-alleles was subsequently investigated, from which a significant association was presented only for the combined three risk-alleles, TCF7L2 rs7903146 (C), KCNQ1 rs2237892 (C), and KCNQ1 rs223797 (T). As compared with a group of GRS 2–3, the high-GRS group (GRS 5–6) revealed significant association with CAD (OR, 6.90; 95% CI, 2.30 to 20.71; P=0.001), cumulative nephropathy and/or CAD (OR, 3.92; 95% CI, 1.75 to 8.76; P=0.001), and cumulative micro- and/or macrovascular complications (OR, 2.33; 95% CI, 1.13 to 4.79; P=0.022) (Fig. 2 and Supplementary Tables 9-16).
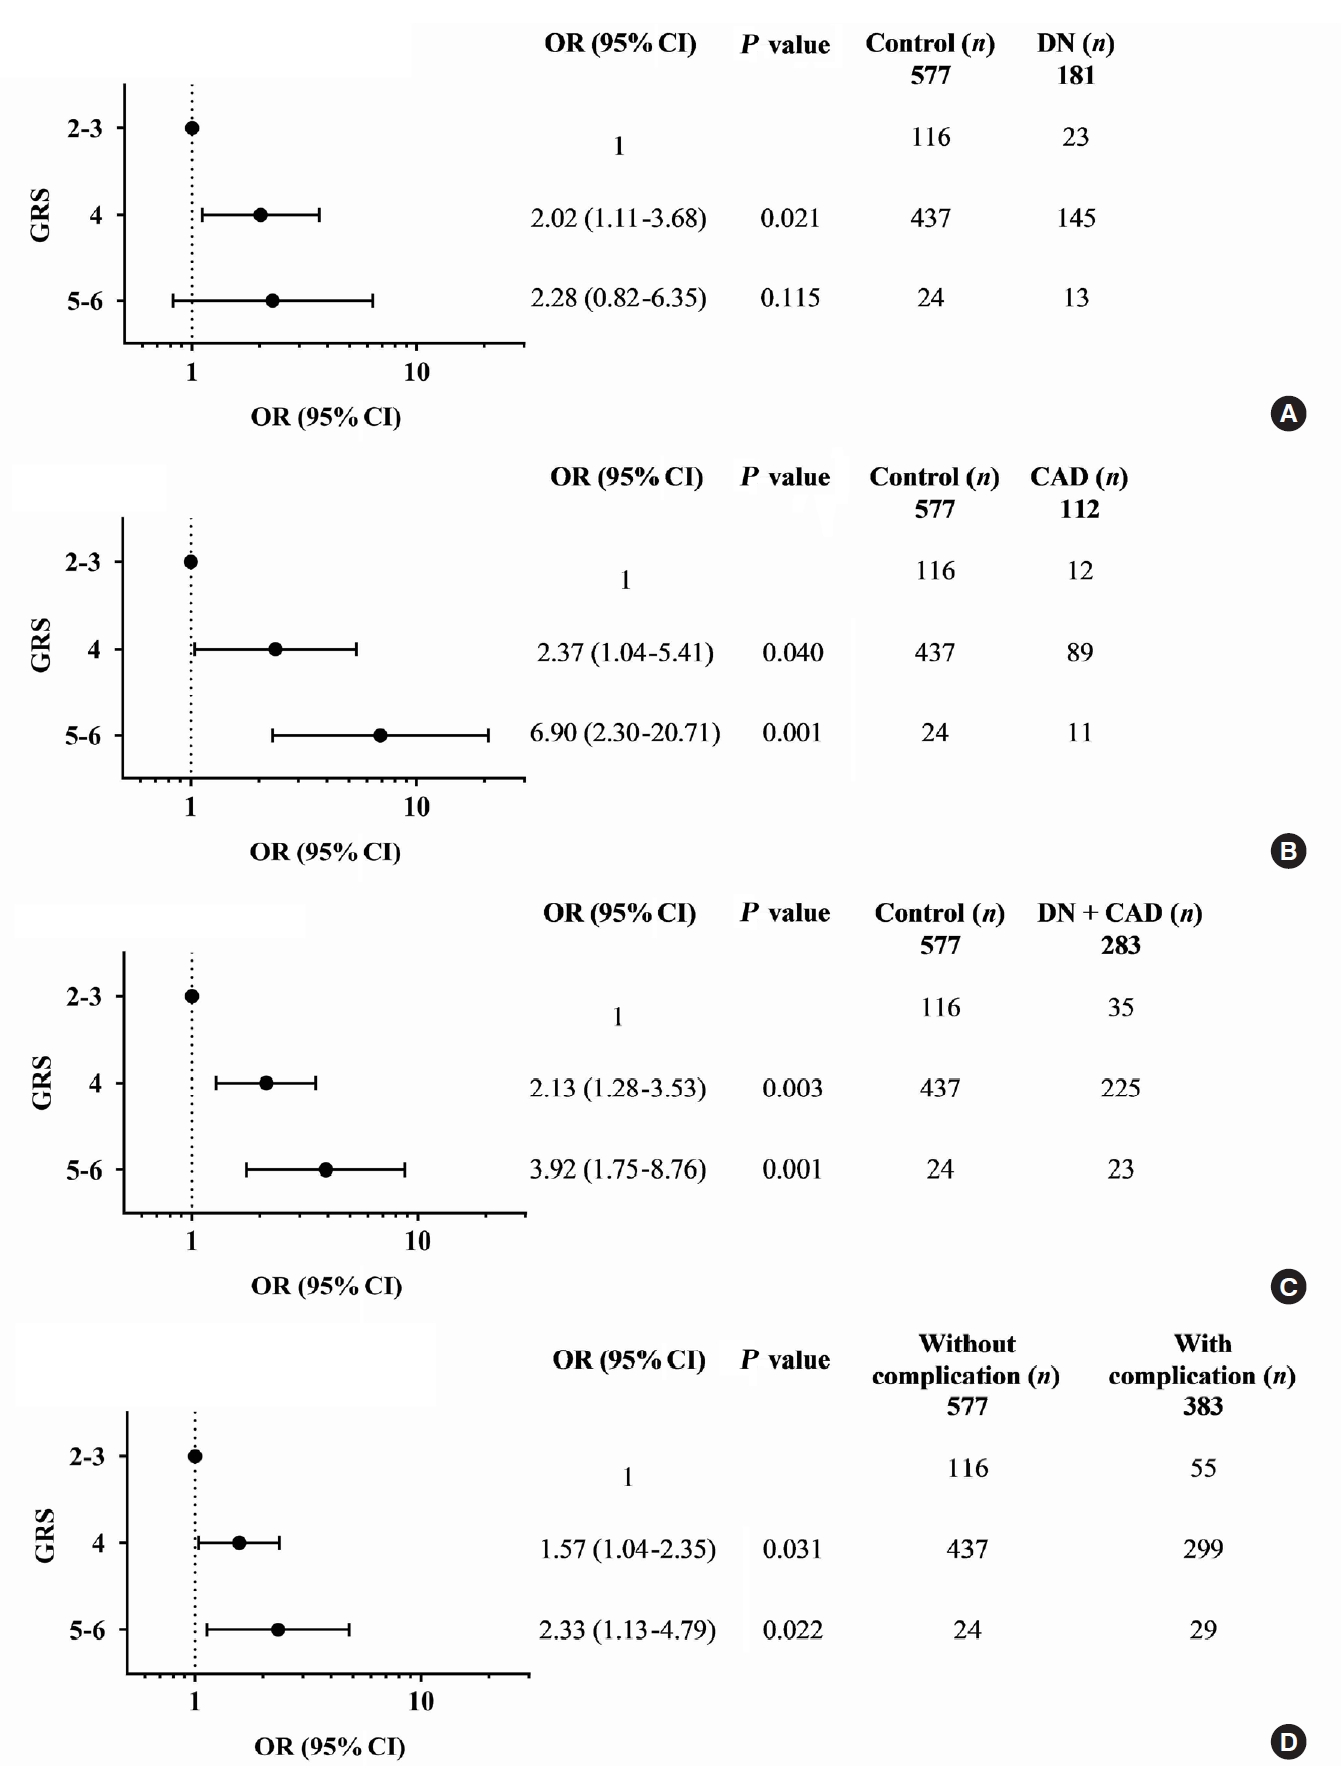
Adjusted odds ratios (ORs) and 95% confidence interval (CI) for the combined effect of TCF7L2 (rs7903146) and KCNQ1 (rs2237892 and rs2237897) risk alleles, as genetic risk score (GRS), on vascular complications in type 2 diabetes mellitus patients: (A) diabetic nephropathy (DN), (B) coronary artery disease (CAD), (C) cumulative DN and CAD, and (D) cumulative micro- and macrovascular complications; GRS 2–3 as reference; ORs adjusted for age, sex, hypertension, dyslipidemia, glycated hemoglobin, and body mass index.
The association between the combined risk alleles (GRS) and the parameters related to the severity of T2DM (blood level of HbA1c and FPG) and the kidney function (BUN, creatinine, and the magnitude of eGFR) was explored, which may be related to the outcomes of diabetic complications. Although GRS did not directly show significant relationship with the level of HbA1c or FPG, the level appeared to increase according to the increase of GRS. For the kidney function-related parameters, the trend toward an increasing level of BUN and creatinine, with the decrease of eGFR, was associated with the increase of GRS, significantly for combined two risk alleles (P trend <0.05) and significant only at creatinine level for combined three risk alleles (Supplementary Table 20).
DISCUSSION
The present study initially evaluated the individual effect of five SNPs in TCF7L2, KCNQ1, and KCNJ11 genes for their association with T2DM and its comorbidity, hypertension, in Thai subjects with T2DM and related complications. Of five SNPs, we found that only three SNPs (with effecting alleles): TCF7L2 rs290487 (T), KCNQ1 rs2237892 (C), and KCNQ1 rs2237897 (C), were significantly associated with risk of T2DM. We subsequently demonstrated that TCF7L2 rs7903146 (C) revealed an association with the risk of hypertension in all subjects; whereas TCF7L2 rs290487 (C), KCNQ1 rs2237892 (T), and KCNQ1 rs2237897 (T) were associated with risk of hypertension only in old-age subjects. With the speculation that combined T2DM and hypertension associated gene variants might confer susceptibility to diabetic vascular complications; we further demonstrated, however, that only specific combination of KCNQ1 rs2237892 (C) and rs2237897 (T) with TCF7L2 rs7903146 (C) increased the risk of T2DM related CAD, cumulative diabetic nephropathy and/or CAD, and cumulative micro- and/or macrovascular complication.
Several studies have published the association of common SNPs in TCF7L2 with T2DM. However, the results have been variable among different racial populations [8,42,43]. The previous studies in the Chinese [42] and the Japanese population [43] have reported a significant association between the T allele of TCF7L2 rs7903146 and T2DM risk, whilst no association found for TCF7L2 rs290487. In the present study, we found that only TCF7L2 rs290487 (T) was associated with risk of T2DM, but such association was not found for rs7903146. For the rs7903146, although the T allele revealed no association with T2DM in our study Thai population, the C allele was associated with an increased risk of hypertension. The difference in the association results conferred by TCF7L2 SNPs could be due to the difference in population characteristics as well as the difference in frequencies of the effecting allele among the various study population. For KCNQ1, in accordance with the previous study in both European [44] and Asian population [45], the present study also found that KCNQ1 rs2237892 (C) and rs2237897 (C) had a significant association with T2DM. There is evidence suggesting that the risk gene variants in KCNQ1 are gain-of-function polymorphisms that enhance T2DM risk. Such gain-of-function polymorphisms could result in increased KCNQ1 expression, which by mechanistic function of KCNQ1 (Kv7.1) could decrease insulin exocytosis and reduce insulin secretion [46].
Hypertension is the most common comorbidity of T2DM that plays a dominant role in the pathophysiology and progression of micro- and macrovascular complications [3]. Interestingly, the present study showed that the low-risk allele of the same SNP for T2DM appeared to act inversely as the high-risk allele for hypertension; as such TCF7L2 rs7903146 (C), TCF7L2 rs290487 (C), KCNQ1 rs2237892 (T), and KCNQ1 rs2237897 (T) revealed a significant association with risk for hypertension. The low-risk allele for T2DM in KCNQ1 (high-risk for hypertension) could reduce the expression of KCNQ1, as oppose to the gain-of-function allele, and result in increased insulin secretion. Similarly, there is an in vitro report showing that inhibition of KCNQ1 (Kv7.1) function in pancreatic β-cell line results in increased insulin secretion [47]. Reduced activity and expression of Kv7.1 have also resulted in an increase of vascular resistance and renin release with subsequent hypertension [48]. Insulin resistance and/or hyperinsulinemia may contribute to elevated blood pressure via several possible mechanisms; it may cause sodium retention, increased sympathetic activity, and alteration of tissue angiotensin II and aldosterone actions, which are the important causes of hypertension [49]. In addition, polymorphisms in the Wnt effector, TCF7L2 gene, have been associated with the prevalence and severity of CAD [50]. There is evidence showing that impaired TCF7L2 activity affects vascular smooth muscle cell differentiation and leads to vascular pathology-related atherosclerotic CAD [51].
T2DM and hypertension are common comorbidities that exacerbate the progression of diabetic complications in the context of progressive renal disease and accelerated CVD. In the present study, we investigated the effect of single SNP on diabetic complications and found no significant association between individual SNP and diabetic complications. However, a combination of risk-alleles that confer susceptibility to both T2DM and hypertension appeared to have a significant effect. As shown by a combination of two risk-alleles in KCNQ1, rs2237892 (C) and rs2237897 (T), which respectively related to T2DM and hypertension, revealed a significant association predominantly with CAD and with cumulative diabetic nephropathy and CAD. Additionally, the haplotype linking rs2237892 (C) with rs2237897 (T) also conferred a significant association with CAD. Such evidence of C-T haplotype association could support a specific combined effect of both alleles. In contrast, a combination of two risk-alleles in KCNQ1: rs2237892 (C) and rs2237897 (C), which both related only to T2DM, revealed no association with either microvascular or macrovascular complications. Furthermore, a combination of three risk-alleles, TCF7L2 rs7903146 (C), KCNQ1 rs2237892 (C), and KCNQ1 rs2237897 (T), pronounced the association with greater effect compared to a combination of only two risk-alleles, KCNQ1 rs2237892 (C) and KCNQ1 rs2237897 (T). This finding indicated the cumulative effect of gene variants that confer risk for both T2DM and hypertension on the progression of diabetic micro- and macrovascular complications. The development and progression of T2DM and its complications are complex. Age may be a contributing factor. However, in the present study, there were no differences in the average age among three groups of subjects. Among individuals with T2DM, during the diabetic progression, such genetic variation might be a driving factor that differentiates those with from those without complications. Our finding for the association of a specific pattern of combined risk alleles might be a part of such driving factor. Because this study explored in the limited sampling population, further replicative study in another larger group with more representative subjects may be of interest to confirm this finding in the general population.
The limitation of this study was due to the restricted accession of the patient medical history; so that we were unable to address the effect of others factors such as the onset and duration of T2DM, environmental factors (smoking and alcohol use), that may modify the outcome of genetic association.
In conclusion, to the best of our knowledge, this study demonstrated for the first time the combined effect of genetic variants in TCF7L2 (rs7903146) and KCNQ1 (rs2237892 and rs2237897) on the risk of both micro- and macrovascular complications, predominantly with nephropathy and CAD, in subjects with T2DM. Such an effect was conferred by a specific pattern of a combination of risk-alleles for both T2DM and hypertension.
Supplementary Materials
Supplementary materials related to this article can be found online at https://doi.org/10.4093/dmj.2020.0101.
Definition and assessment for diabetic complications
Primers for genotyping of SNPs in TCF7L2, KCNQ1, and KCNJ11 genes
Therapeutic drug treatment in patients with type 2 diabetes mellitus
Relationship between risk factors and diabetic vascular complications
Relationship between risk factors and vascular complications
Clinical and biochemical characteristics of the study population (categorized by hypertensive status)
Association between SNPs and hypertension in all subjects
Prevalence of diabetic complications in the study population
Association between individual SNPs and micro- and macrovascular complications in type 2 diabetes mellitus patients
Combined effect of two risk alleles on diabetic nephropathy in T2DM patients
Combined effect of three risk alleles on diabetic nephropathy in T2DM patients
Combined effect of two risk alleles on CAD in T2DM patients
Combined effect of three risk alleles on CAD in T2DM patients
Combined effect of two risk alleles on nephropathy and/or CAD in T2DM patients
Combined effect of three risk alleles on nephropathy and/or CAD in T2DM patients
Combined effect of two risk alleles on micro- and macrovascular complications in T2DM patients
Combined effect of three risk alleles on micro- and macrovascular complications in T2DM patients
Association of KCNQ1 haplotype and diabetic nephropathy in type 2 diabetes mellitus patients
Association of KCNQ1 haplotype and CAD in type 2 diabetes mellitus patients
Association of KCNQ1 haplotype and nephropathy and/or CAD in type 2 diabetes mellitus patients
Combined effect of risk alleles on the parameters related to the severity of type 2 diabetes mellitus in patients
Notes
CONFLICTS OF INTEREST
No potential conflict of interest relevant to this article was reported.
AUTHOR CONTRIBUTIONS
Conception or design: R.R., N.S., C.S.
Acquisition, analysis, or interpretation of data: R.R., N.S., C.S.
Drafting or revising the work: R.R., N.S., N.K., U.K., K.S., P.I., V.S., C.S.
Final approval of the manuscript: R.R., N.S., N.K., U.K., K.S., P.I., V.S., C.S.
FUNDING
The funding for this study was supported by the National Research Council of Thailand (NRCT). Rujikorn Rattanatham received support from the Postgraduate Scholarship, Faculty of Associated Medical Sciences; the Postgraduate Program in Biomedical Sciences, Graduate School; and the Cardiovascular Research Group (CVRG), Khon Kaen University.
Acknowledgements
The Faculty of Associated Medical Sciences, Khon Kaen University, provided all necessary facilities throughout the study. We would like to acknowledge Mr. Gurdeep Singh, for editing the MS via Publication Clinic KKU, Thailand.