Fetal Abdominal Obesity Detected At 24 to 28 Weeks of Gestation Persists Until Delivery Despite Management of Gestational Diabetes Mellitus
Article information

Abstract
Background
Fetal abdominal obesity (FAO) has been reported to be affected at gestational diabetes mellitus (GDM) diagnosis at 24 to 28 weeks of gestation in older and/or obese women. This study investigated whether the management of GDM improves FAO in GDM subjects near term.
Methods
Medical records of 7,099 singleton pregnant women delivering at CHA Gangnam Medical Center were reviewed retrospectively. GDM was diagnosed by 100-g oral glucose tolerance test after 50-g glucose challenge test based on Carpenter–Coustan criteria. GDM subjects were divided into four study groups according to maternal age and obesity. FAO was defined as ≥90th percentile of fetal abdominal overgrowth ratios (FAORs) of the ultrasonographically estimated gestational age (GA) of abdominal circumference per actual GA by the last menstruation period, biparietal diameter, or femur length, respectively.
Results
As compared with normal glucose tolerance (NGT) subjects near term, FAORs and odds ratio for FAO were significantly higher in old and/or obese women with GDM but not in young and nonobese women with GDM. For fetuses of GDM subjects with FAO at the time of GDM diagnosis, the odds ratio for exhibiting FAO near term and being large for GA at birth were 7.87 (95% confidence interval [CI], 4.38 to 14.15) and 10.96 (95% CI, 5.58 to 20.53) compared with fetuses of NGT subjects without FAO at GDM diagnosis.
Conclusion
Despite treatment, FAO detected at the time of GDM diagnosis persisted until delivery. Early diagnosis and treatment might be necessary to prevent near term FAO in high-risk older and/or obese women.
INTRODUCTION
Gestational diabetes mellitus (GDM), defined as glucose intolerance during pregnancy, increases in older and/or obese women [1-3], and along with maternal obesity, it accelerates fetal growth with resultant perinatal morbidities [4]. Large for gestational age (LGA) and macrosomia with birth weight ≥4 kg due to increased fetal adiposity is thus an important fetal complication of GDM [5-7]. Because the association between GDM and increased fetal adiposity has been known to be limited to late pregnancy [8-11] and at birth [12-14], treatment of GDM initiated even at ≥30 weeks’ gestation could reduce the risks of fetal overgrowth, shoulder dystocia, and cesarean delivery [15].
Management of GDM was reported to reduce the frequency of LGA and macrosomia by 50% [7] but did not normalize excess fetal adiposity [12]. In our previous study, we observed that GDM diagnosed at 24 to 28 weeks of gestation already affected fetal abdominal obesity (FAO) in older women with/without obesity but not in young women [3]. Furthermore, in their study, Sovio et al. [16] reported that FAO detected at 28 weeks of gestation in obese GDM patients was associated with about a fourfold increased risk of the infant being LGA at birth. Thus, it still remains unclear whether appropriate treatment of GDM could modify the risk of fetal obesity and pregnancy outcome in this high-risk population. In the present study, we thus tried to determine whether FAO detected at 24 to 28 weeks of gestation persists until delivery despite appropriate treatment of GDM.
METHODS
Subjects and data collection
We retrospectively reviewed the medical records of 7,099 of 7,820 singleton pregnant women who were followed up and delivered at the CHA Gangnam Medical Center from January 1, 2012, to April 31, 2015 [3]. Data collection was approved by the Institutional Review Board (IRB) of CHA Gangnam Medical Center with a waiver of informed consent for the retrospective chart review (IRB No. GCI-18-10). Data on maternal age at pregnancy, maternal anthropometry, and biochemical test results were obtained from the medical records. We also collected fetal biometry data at the time of 50-g glucose challenge test (GCT) and near term together with the gestational ages (GAs) when the ultrasound scans were performed. Body mass index (BMI) was calculated as body weight (kg)/(height [m])2.
A diagnosis of GDM was made shortly after screening, usually within 1 week. Therefore, we use the phrase “at the time of GDM diagnosis” to describe the fetal biometry performed on the same day of the 50-g GCT in comparison with “near term.” We also abbreviate this phrase to “at diagnosis.”
Diagnosis of GDM
As described previously [3], all pregnant women were recommended to undergo screening with a 50-g GCT irrespective of fasting at 24 to 28 weeks of gestation as well as undergo a 3-hour 100-g oral glucose tolerance test (OGTT) with measurement of glycosylated hemoglobin (HbA1c) after more than 8 hours of fasting if the 50-g GCT result was ≥140 mg/dL. The diagnosis of GDM and normal glucose tolerance (NGT) were based on Carpenter–Coustan criteria. Of 7,820 subjects initially enrolled and followed up at the outpatient clinic, 250 had impaired glucose tolerance and 384 had GDM (Fig. 1) [3].

Study flow gram. GCT, glucose challenge test; PIH, pregnancy induced hypertension; OGTT, oral glucose tolerance test; NGT, normal glucose tolerance; GDM, gestational diabetes mellitus; IGT, impaired glucose tolerance.
Treatment of GDM
GDM subjects received education on adequate dietary management and appropriate exercise for blood glucose control. The glycemic target during pregnancy was 70 to 90 mg/dL for fasting glucose and ≤140 mg/dL 1 hour after a meal. We measured plasma glucose every 2 or 3 weeks with glycated albumin, and HbA1c was measured every 6 to 8 weeks. When the fasting plasma glucose was higher than 100 mg/dL after dietary management and exercise, long-acting insulin was initiated once at bedtime. If both fasting and postprandial glucose levels were outside the target, a mixed insulin of ultra-short-acting insulin with intermediate-acting insulin was injected twice a day. All patients adhered to insulin treatment and responded well, except for three GDM subjects who moved to another hospital after recommendation of insulin therapy. They were also recommended to perform self-capillary glucose monitoring two to four times a day.
Fetal biometry
We collected fetal biometry data from 5,388 pregnant women who were scanned on the same day of the 50-g GCT at diagnosis and 5,154 women who were scanned near term. Among them, 4,737 subjects had fetal biometry data scanned at both times. In 87% of these women, gestational dating was confirmed by fetal ultrasonography performed before 14 weeks of gestation. Biparietal diameter (BPD), femur length (FL), and abdominal circumference (AC) were measured three times via ultrasonography (GE Healthcare, Chicago, IL, USA) by one of the three experienced sonographers, and the mean values were converted to each estimated GA (i.e., GA-BPD, GA-FL, and GA-AC) according to the Japanese fetal growth chart [17,18]. We calculated fetal abdominal overgrowth ratios (FAORs) as GA-AC/GA-LMP (actual GA measured by the last menstruation period near term) to correct for the variations in the ultrasound scan timing and GA-AC/GA-BPD or GA-AC/GA-FL to detect overgrowth of the abdomen relative to the head and femur growth, respectively. We defined the presence of FAO as FAOR ≥90th percentile of the total subjects with fetal biometry (GA-AC/GA-LMP ≥1.08, GA-AC/GA-BPD ≥1.07, and GA-AC/GA-FL ≥1.07, respectively, at the time of diagnosis of GDM; GA-AC/GA-LMP ≥1.13, GA-AC/GA-BPD ≥1.10, and GA-AC/GA-FL ≥1.10, respectively, near term). The estimated fetal weight was calculated using the Shinozuka formula [19]. We defined LGA at birth as ≥90th percentile of GA-matched birth weight according to the report of Committee of the Korean Society of Neonatology by Lee et al. [20]. Macrosomia was defined as an infant birth weight ≥4 kg.
Biochemical analysis
We measured plasma glucose using the hexokinase method (Quailigentglu, Sekisui, Japan), glycated albumin using a glycol-albumin assay kit (LUCICARGA-L; Asahi Kasei Pharma Co., Tokyo, Japan), and HbA1c via high-performance liquid chromatography (G8 Elution Buffer; Tosoh, Tokyo, Japan).
Subgroup analysis of GDM subjects according to maternal age and prepregnancy BMI
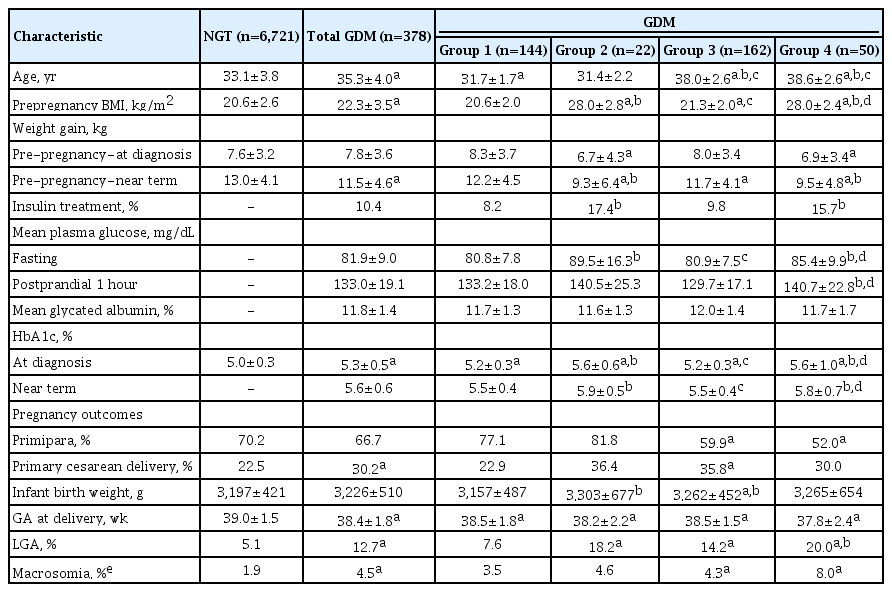
A total of 378 GDM subjects were divided into four study groups based on maternal age and prepregnancy BMI: group 1 (age <35 years and BMI <25 kg/m2 [n=144]), group 2 (age <35 years and BMI ≥25 kg/m2 [n=22]), group 3 (age ≥35 years and BMI <25 kg/m2 [n=162]), and group 4 (age ≥35 years and BMI ≥25 kg/m2 [n=50]). We compared the clinical data between 378 GDM and 6,721 NGT subjects. We also compared GDM subgroup data with each other as well as with those of NGT subjects.
The odds ratios for exhibiting FAO near term in total GDM and subgroups of GDM in comparison with the NGT were calculated. In addition, the odds ratio for appearance, disappearance, and persistence of FAO between the time of diagnosis of GDM and near term was calculated in the GDM and subgroups of GDM subjects.
Subgroup analysis of the NGT and GDM subjects according to presence or absence of FAO near term
A total of 4,737 subjects who had fetal biometry data scanned both simultaneously with the 50-g GCT and near term were divided into the following four study groups based on the presence or absence of FAO near term: NGT without FAO (n=4,059), NGT with FAO (n=416), GDM without FAO (n=217), and GDM with FAO (n=45). We performed a comparison of clinical and biochemical parameters of mothers and pregnancy outcomes between the study groups.
We also investigated the odds ratio for exhibiting FAO near term, being LGA at birth, and macrosomia in the NGT with FAO and GDM with and without FAO at the time of GDM diagnosis relative to the fetus of NGT subjects without FAO at diagnosis.
Statistical analyses
Descriptive statistics were used to summarize the clinical and biochemical characteristics of participants as mean with standard deviation. We investigated the univariate association in the NGT and total GDM or subgroup of GDM subjects using two-sample t-tests. Categorical and continuous pregnancy outcomes were compared using a test of proportions and two-sample t-tests, respectively. Fetal biometry data and FAORs were described as the mean and standard deviation, and twosample t-tests were used for the comparison. Logistic regression analysis models were used to estimate the odds of FAO in the total GDM or subgroup of GDM versus NGT subjects. To reduce potential bias because of the limited number of cases in the group 2 GDM, exact logistic regression was performed for the group-specific analysis. In the subgroup analysis, two-sample t-tests and the test of proportions were used according to the presence or absence of FAO near term. Another set of logistic regression analysis models was implemented to estimate the odds of exhibiting FAO near term, being LGA at birth, and macrosomia in the NGT subjects with FAO, GDM subjects with and without FAO versus NGT subjects without FAO at diagnosis. The prevalence of FAO near term, LGA, and macrosomia were compared by test of proportions. We assessed correlations using Pearson’s correlation coefficient. Finally, we examined the association between FAORs and related factors by fitting multiple linear regression models. All analyses were conducted using STATA version 15.1 (StataCorp LP, College Station, TX, USA). The level of significance for the analyses was 0.05.
RESULTS
Clinical and biochemical characteristics and pregnancy outcomes of the NGT and GDM subjects
Maternal age and prepregnancy BMI were significantly higher in patients with GDM, but weight gain until near term was significantly smaller in these subjects as compared with NGT subjects. Mean fasting plasma glucose levels measured during GDM management and HbA1c measured at diagnosis and near term were significantly higher in the obese group 2 and 4 GDM than in the nonobese group 1 and 3 GDM. There was a significantly higher frequency of insulin treatment in the obese group 2 and 4 compared with the young and nonobese group 1 GDM (17.4% and 15.7% vs. 8.2%, P<0.05). However, mean glycated albumin levels measured during GDM management were not significantly different among all GDM subgroups. The prevalence of LGA at birth (12.0% vs. 5.1%, P<0.05), macrosomia (4.5% vs. 1.9%, P<0.05), and primary cesarean delivery rates (30.2% vs. 22.5%, P<0.05) were significantly higher in the GDM patients than in the NGT subjects. In the subgroup analysis, as compared with NGT subjects, all GDM subgroups had a higher prevalence of LGA at birth and macrosomia, but young and nonobese group 1 GDM did not (Table 1).
Clinical characteristics and pregnancy outcomes in the subjects with NGT, GDM, and subgroups of GDM according to maternal age and prepregnancy BMI
Fetal biometry of the NGT and GDM subjects
Although the estimated fetal weight was not significantly different between the fetuses of the NGT and GDM subjects, the GA-AC and all FAORs were significantly higher in the total GDM subjects than those in the NGT near term. In the subgroup analysis, all FAORs were significantly higher in the old group 3 and 4 GDM patients than in the NGT subjects, but not in group 1 GDM (Table 2). These results revealed that fetal abdominal overgrowth in the older and/or obese GDM subjects observed at the time of GDM diagnosis persisted near term despite GDM treatment.
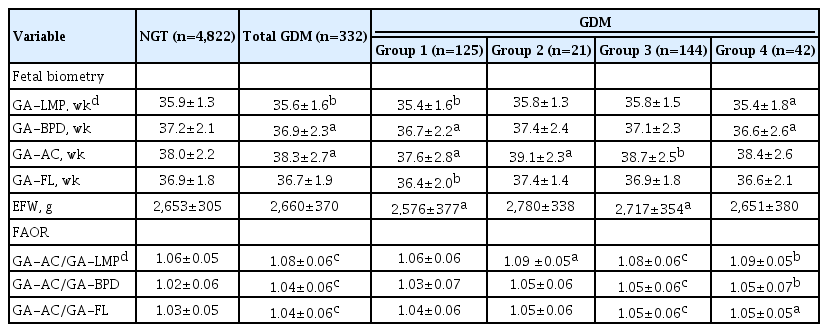
Results of fetal biometry and FAORs in subjects with NGT, GDM, and GDM subgroups according to maternal age and prepregnancy BMI
Odds ratio for exhibiting FAO near term in subjects with GDM and subgroups of GDM
Relative to the NGT group, the odds ratio for exhibiting FAO near term in the GDM subjects was 2.12 (95% confidence interval [CI], 1.57 to 2.85), as indicated by the FAOR of GA-AC/GA-LMP, 2.08 (95% CI, 1.54 to 2.81) by GA-AC/GA-BPD, and 1.69 (95% CI, 1.23 to 2.31) by GA-AC/GA-FL. In the group 3 GDM, the odds for FAO near term by all FAORs were significantly higher than those in the NGT subjects (Table 3). We calculated the odds ratios for the changes in FAO status between the time of GDM diagnosis and near term in subjects with GDM and subgroups of GDM in comparison with the NGT group. In the old group 3 and 4 GDM, odds ratios for the persistence of FAO were 4.41 (95% CI, 2.33 to 8.36) and 6.73 (95% CI, 2.62 to 17.27), respectively (Supplementary Table 1). These results show that FAO near term in the old GDM groups already existed at the time of GDM diagnosis.
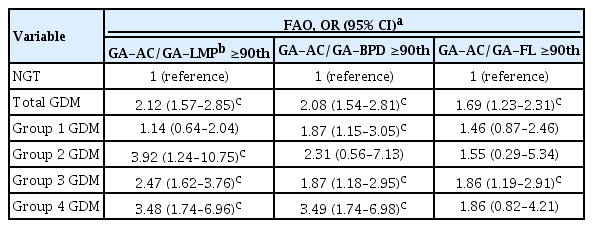
ORs for FAO by each FAOR near term in the GDM subjects in comparison with the NGT subjects
Odds ratios for exhibiting FAO near term, being LGA at birth, and macrosomia
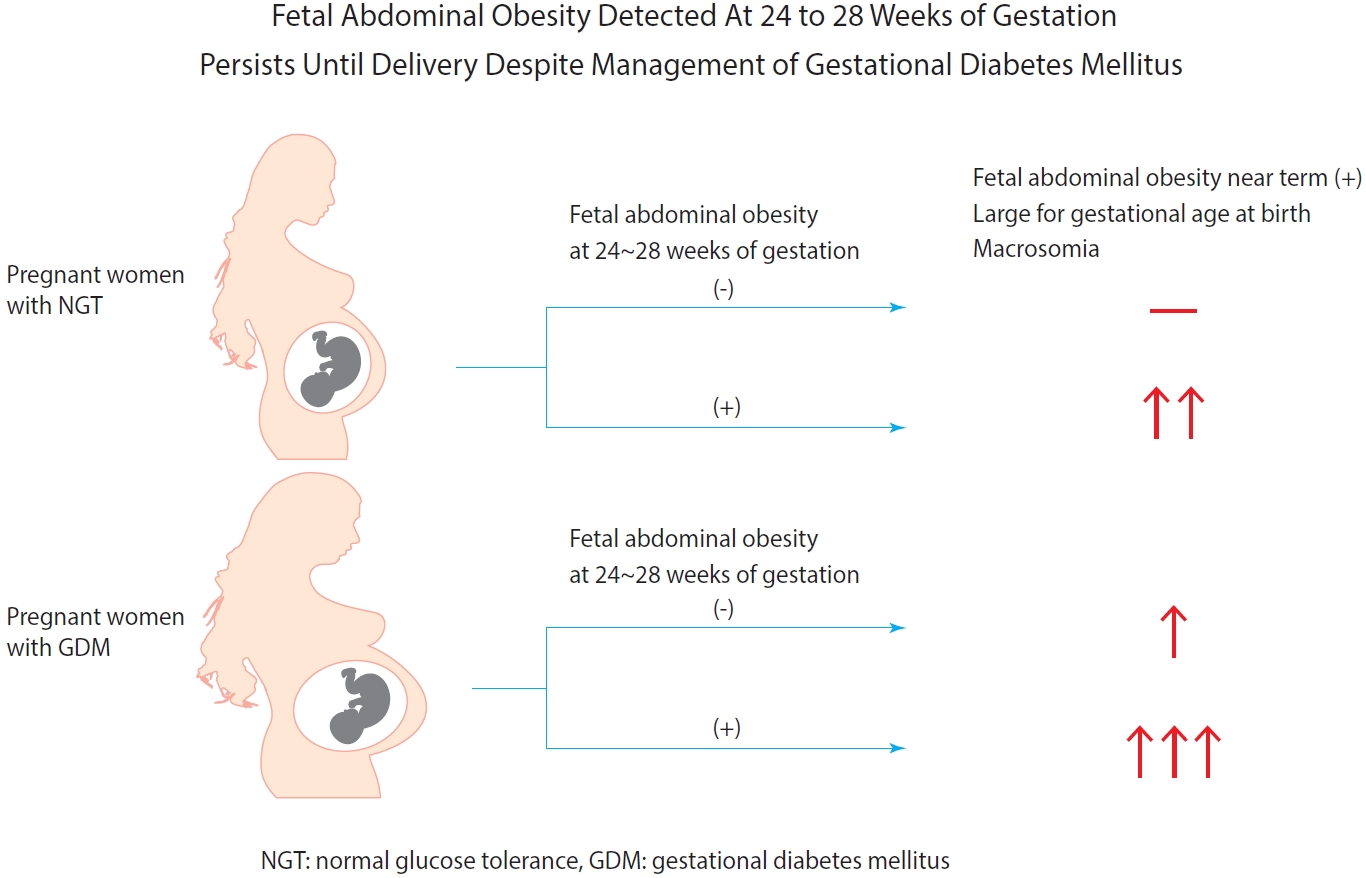
In the NGT subjects, the presence of FAO at diagnosis increased the odds ratio for exhibiting FAO near term to 4.65 (95% CI, 3.64 to 5.94) relative to the subjects without FAO at diagnosis. In the GDM subjects, although the prevalence of FAO near term in the fetuses without FAO at diagnosis was 12.2% (26/213), the prevalence of FAO near term in fetuses with FAO at diagnosis increased markedly to 38.8% (19/49). Relative to the NGT subjects without FAO at diagnosis, the presence of GDM alone increased the odds ratio for FAO near term to 1.73 (95% CI, 1.13 to 2.65), but the presence of GDM with FAO at diagnosis increased the odds ratio up to 7.87 (95% CI, 4.38 to 14.15). However, in subjects with FAO at diagnosis, we observed no significant difference in the prevalence or odds ratio for FAO near term between the NGT and GDM subjects.
In the fetuses of the NGT group, the odds ratio for being LGA at birth and having macrosomia were fourfold higher in subjects with FAO than in those without FAO at diagnosis. In the fetuses of GDM subjects, the odds ratio for LGA were more than threefold higher in subjects with FAO than in those without FAO at diagnosis, but the odds ratio for macrosomia was not different between the two groups. Taken together, the presence of FAO in the fetus at diagnosis increased the odds ratio for LGA at birth to 4.56 (95% CI, 3.35 to 6.21) in the NGT group, and when the presence of GDM was combined with FAO at diagnosis, the odds ratio increased up to 10.96 (95% CI, 5.58 to 20.53) (Table 4, Supplementary Figure 1, and Supplementary Table 2).

ORs for FAO near term (+), LGA, and macrosomia in the NGT and GDM subjects by the presence or absence of FAO at the time of diagnosis of GDM
Clinical characteristics of GDM and NGT subjects based on presence or absence of FAO near term
Table 5 lists both the clinical and biochemical features of the subjects with FAO near term. In both the NGT and GDM groups with FAO near term, maternal age, prepregnancy BMI, infant birth weight, frequency of LGA at birth. and macrosomia were significantly higher than those of the NGT and GDM subjects without FAO. However, in the NGT subjects only, primary cesarean delivery rate and weight gain from prepregnancy to the time of GDM diagnosis were significantly higher in the group with FAO than in those without FAO. Among the GDM subjects, HbA1c measured at diagnosis but not near term, FPG on 100-g OGTT, mean fasting glucose, and insulin treatment frequency were significantly higher in the group with FAO than in those without FAO, but mean glycated albumin levels did not differ between the two groups.

Clinical characteristics and pregnancy outcomes in NGT and GDM subjects with/without FAO near term
Clinical factors associated with FAORs measured near term
Maternal age, prepregnancy BMI, weight gain until the time of diagnosis of GDM but not until near term from prepregnancy, HbA1c measured at the time of GDM diagnosis and near term, mean fasting glucose, and postprandial glucose levels exhibited significant positive correlations with FAORs (Supplementary Table 3). Multiple linear regression analyses showed that maternal age, prepregnancy BMI, and weight gain from prepregnancy to the time of diagnosis of GDM were significant independent predictors of FAORs near term. HbA1c measured at diagnosis showed a significant association with only FAOR of GA-AC/GA-FL (Supplementary Table 4).
DISCUSSION
The critical timing for screening, diagnosis, and management of GDM remains unclear. The rationale for the current recommendation for identifying women with GDM at 24 to 28 weeks of gestation and initiating its treatment thereafter is that the association between GDM and fetal overgrowth is limited to late pregnancy [8-11]. In our previous study, we reported that GDM diagnosed at 24 to 28 weeks of gestation already affected fetal abdominal growth in older mothers with/without obesity but not in young women [3]. Thus, we aimed to investigate whether FAO detected at 24 to 28 weeks of gestation persists until delivery or improves with the management of GDM initiated at 24 to 28 weeks of gestation.
In this study, FAORs and odds ratios for FAO in the GDM subjects were significantly higher near term as compared with NGT subjects. Subgroup analysis showed that subjects in old group 3 (age ≥35 years and BMI <25 kg/m2) and group 4 (age ≥35 years and BMI ≥25 kg/m2) had definitely higher FAORs and odds ratios for FAO than the NGT subjects, but young and nonobese group 1 GDM did not. FAO observed near term in these old GDM subjects was thought to already exist at the time of GDM diagnosis. From the above results, we concluded that fetal abdominal overgrowth detected at 24 to 28 weeks of gestation in the old and/or obese GDM patients persist until near term.
Furthermore, the prevalence of FAO near term and being LGA at birth were more than threefold higher in GDM subjects with FAO than in those without FAO at diagnosis, despite GDM treatment. In addition, the odds ratio for being LGA at birth was 10.96 and 2.72 in the GDM subjects with FAO and without FAO at diagnosis. The above results were concordant with Sovio et al.’s [16] report that FAO detected at 28 weeks’ gestation in the infants of obese GDM patients was associated with about a 4-fold risk of being LGA at birth.
Although the mean fasting glucose level measured during the management of GDM was significantly higher in GDM with FAO than in GDM without FAO near term, higher insulin therapy rates and HbA1c levels measured at diagnosis indicate that those subjects had more severe glucose intolerance at the time of diagnosis of GDM. Also, higher mean glucose levels in the obese group 2 and 4 GDM could be explained with the same reason. In addition, mean glycated albumin levels measured during management of GDM were all within 11% to 13% and were not different among the subgroups of GDM. These results provide evidence that all subgroups of GDM were under comparable and appropriate glucose control.
Overall, our findings suggest that the routine diagnosis of GDM and the start of its appropriate treatment at 24 to 28 weeks of gestation is good enough for GDM patients without FAO at 24 to 28 weeks’ gestation, but it might be too late for preventing near term FAO and thereby improving pregnancy outcomes in GDM patients already affected with FAO at 24 to 28 weeks of gestation.
Maternal obesity synergistically increases the risk of GDM-induced FAO and macrosomia [16,21,22]. In the Hyperglycemia and Adverse Pregnancy Outcome study, both GDM and maternal obesity were independently associated with adverse pregnancy outcomes, and their combination had a greater additive impact as compared with either one alone [4]. However, in our studies, the additive effect of obesity on GDM was not so significant, even though these discrepancies might be attributable to the differences in the study population’s ethnicity and the ethnicity-dependent variation in the definition of obesity [23,24]. In our previous study, we found that maternal hyperglycemia and older maternal age with/without obesity but not obesity alone were independent risk factors for FAO at 24 to 28 weeks of gestation [3]. In this study, although the odds ratios for FAO near term and LGA in the fetuses of subjects with GDM alone were 1.73 and 2.72, respectively, the odds ratios increased up to 7.88 and 10.96 in the fetuses of the subjects with both GDM and FAO at diagnosis. Thus, the presence of FAO at 24 to 28 weeks’ gestation is a very important factor that influences neonatal outcome. Overall, these findings suggest that persistent near term FAO in GDM subjects with FAO at diagnosis, despite treatment, might be mainly attributable to another independent risk factor for FAO, namely, maternal old age with or without obesity [3,16,25].
Measuring AC by fetal ultrasound can be used as a reliable marker of fetal adiposity [16]. In our study, we calculated FAOR as an indicator of FAO with the estimated GAs instead of the percentile values of fetal parts measured via ultrasonography. FAO, defined as ≥90th percentile of FAOR, is a more sensitive index for the detection of fetal asymmetric overgrowth than LGA or macrosomia. As shown in Supplementary Table 2, the prevalence of LGA at birth in the NGT and GDM groups was lower than the prevalence of FAO near term, which suggests that some infants have relative abdominal overgrowth but appropriate body weight for GA at birth. This finding is consistent with the report by Catalano et al. [12] indicating that infants of women with GDM have increased body fat despite having an average weight for GA.
In the subjects with FAO at diagnosis, GDM did not increase the odds ratio for FAO near term or LGA at birth, even though the presence of FAO itself at diagnosis was associated with a greater than 4-fold increase in the odds ratio in both the NGT and GDM groups. In addition, the prevalence of macrosomia did not increase in the GDM subjects with FAO as compared with the NGT with FAO at diagnosis. Management of GDM is thought to suppress the development of near term FAO, LGA at birth, and macrosomia but could not reverse FAO, which was already affected at diagnosis. In our study population, the overall prevalence of LGA and macrosomia was not high in comparison with other reports [6,7,26]. However, symmetric LGA is less likely to be associated with hyperinsulinemia than asymmetric LGA exhibiting abdominal overgrowth. Efforts to reduce FAO are thought to be much more important to prevent metabolically affected infants. Planned pregnancy is necessary for high-risk older and/or obese women, along with preconception care to maintain normal glucose tolerance and appropriate body weight for healthy pregnancy.
The primary cesarean delivery rates of 22.5% and 30.2% in our NGT and GDM groups, respectively, were comparable with those reported by Kim et al. [26]. Despite the lower prevalence of LGA at birth and macrosomia in our study subjects, a comparable cesarean delivery rate might be related to the high proportion of pregnancy that results from assisted reproductive technology.
In the current study, maternal age, weight gain from prepregnancy to the time of GDM diagnosis but not from the time of GDM diagnosis to near term, and prepregnant BMI were independent predictors for FAORs measured near term. Fetal hyperinsulinemia and the resultant fetal fat deposition have been observed as early as 14 weeks of gestation [27]. A positive correlation between blood glucose level [28] and HbA1c [29] during the first trimester and the prevalence of neonatal macrosomia has been reported. Early GDM screening in the first trimester of pregnancy and initiation of appropriate therapy in high-risk women was found to significantly improve pregnancy outcomes [19,30]. However, despite early screening, diagnosis, and current best practice management of GDM, poor pregnancy outcomes, including macrosomia, was not significantly improved in early-onset GDM as compared with late-onset GDM [23,31]. Therefore, further studies are needed to determine whether early screening, diagnosis, and initiation of GDM treatment during the first trimester of pregnancy could modify the risk of developing FAO among high-risk older women with/without obesity. In addition, studies should investigate whether these efforts could improve pregnancy outcomes.
The limitations of this study include the single-center, retrospective, and uncontrolled observational study design. Because of the retrospective nature of this study, we did not evaluate interobserver variability on the assessment via ultrasonography. However, there were no differences in the ultrasound scanners used, and all pregnant women scanned were randomly assigned to one of three sonographers. The strengths of this study include the relatively large sample size of patients with the same ethnicity and clinical management, following the same protocol throughout the study period.
In summary, FAO detected at 24 to 28 weeks of gestation in high-risk older GDM subjects with/without maternal obesity persisted until delivery, despite appropriate treatment. Among GDM subjects, FAO detected at the time of GDM diagnosis was associated with markedly increased odds ratios of 7.87 and 10.96 for FAO near term and being LGA at birth, respectively, in comparison with the NGT subjects without FAO at diagnosis.
These findings suggest that although the current GDM screening, diagnosis, and treatment strategy at 24 to 28 weeks of gestation might be effective for younger and nonobese women, early GDM screening, diagnosis, and the best appropriate management starting from the first trimester well before the onset of FAO might be necessary for the high-risk older and obese GDM mothers to prevent near term FAO and improve pregnancy outcomes.
Supplementary Materials
Supplementary materials related to this article can be found online at https://doi.org/10.4093/dmj.2020.0078.
Estimated odds ratios for the changes in FAO status between the time of diagnosis of GDM and near term in the subjects with GDM and subgroups of GDM in comparison with the NGT subjects
Prevalence of FAO near term, LGA, and macrosomia in the NGT and GDM subjects depending on the presence or absence of FAO at the time of diagnosis of GDM
Correlations between FAORs near term and main clinical characteristics in all subjects
Predictors of FAORs near term by multiple linear regression analysis in all subjects
Odds ratios for FAO near term (+), LGA, and macrosomia in the NGT and GDM subjects by the presence or absence of FAO at the time of diagnosis of GDM
Notes
CONFLICTS OF INTEREST
No potential conflict of interest relevant to this article was reported.
AUTHOR CONTRIBUTIONS
Concept of design: Y.L.K.
Acquisition, analysis, or interpretation of data: W.K., S.K.P., Y.L.K.
Drafting the work or revising: W.K., S.K.P., Y.L.K.
Final approval of the manuscript: Y.L.K.
FUNDING
None
Acknowledgements
The authors would like to express sincere gratitude to Prof. WS Park of Samsung Medical Center, Sungkyunkwan University, for his advice on writing the manuscript.