Enhancer-Gene Interaction Analyses Identified the Epidermal Growth Factor Receptor as a Susceptibility Gene for Type 2 Diabetes Mellitus
Article information

Abstract
Background
Genetic interactions are known to play an important role in the missing heritability problem for type 2 diabetes mellitus (T2DM). Interactions between enhancers and their target genes play important roles in gene regulation and disease pathogenesis. In the present study, we aimed to identify genetic interactions between enhancers and their target genes associated with T2DM.
Methods
We performed genetic interaction analyses of enhancers and protein-coding genes for T2DM in 2,696 T2DM patients and 3,548 controls of European ancestry. A linear regression model was used to identify single nucleotide polymorphism (SNP) pairs that could affect the expression of the protein-coding genes. Differential expression analyses were used to identify differentially expressed susceptibility genes in diabetic and nondiabetic subjects.
Results
We identified one SNP pair, rs4947941×rs7785013, significantly associated with T2DM (combined P=4.84×10⁻¹⁰). The SNP rs4947941 was annotated as an enhancer, and rs7785013 was located in the epidermal growth factor receptor (EGFR) gene. This SNP pair was significantly associated with EGFR expression in the pancreas (P=0.033), and the minor allele “A” of rs7785013 decreased EGFR gene expression and the risk of T2DM with an increase in the dosage of “T” of rs4947941. EGFR expression was significantly upregulated in T2DM patients, which was consistent with the effect of rs4947941×rs7785013 on T2DM and EGFR expression. A functional validation study using the Mouse Genome Informatics (MGI) database showed that EGFR was associated with diabetes-relevant phenotypes.
Conclusion
Genetic interaction analyses of enhancers and protein-coding genes suggested that EGFR may be a novel susceptibility gene for T2DM.
INTRODUCTION
Type 2 diabetes mellitus (T2DM) is a metabolic disorder characterized by insulin resistance and hyperglycemia. There is compelling evidence that genetic factors have a strong influence on the risk of T2DM [1]. Over the last decade, catalyzed by the ability to perform genome-wide association studies (GWASs) with ever larger samples, more than 400 robust susceptibility variants for T2DM have been identified [2345], together with associated credible sets. The majority of these studies searched for simple additive, cumulative, and independent effects, primarily based on single-locus analyses. The joint effect of identified variants explains approximately 10% of observed T2DM heritability [56].
Multiple hypotheses have been put forward to explain the well-known “missing heritability” problem, which refers to a phenomenon whereby single genetic variations cannot account for much of the heritability of phenotypes. These include epigenetics, rarer variants with larger effects, and limitations of GWASs [7]. Genetic interactions can affect heritability calculations, and lack of knowledge of genetic interactions is believed to be an important cause of the missing heritability [8]. Studies have identified several epistatic mechanisms at the onset of T2DM. For instance, interactions among RAS-related genes were associated with T2DM susceptibility in a Chinese population, although the main effects of the individual loci may not be observed [9]. However, interaction analyses using single nucleotide polymorphisms (SNPs) in the whole genome usually suffer from the problem of very stringent significance [10]. To solve this problem, the majority of previous hypothesis-driven studies have restricted the search for interactions on the basis of existing biological knowledge, such as candidate genes and protein–protein interactions, or statistical features, such as marginal effects and known GWAS hits [10]. However, focusing only on interactions of SNPs with known associated loci or candidate genes may miss SNP interactions that expose no association individually but in combination contribute to disease susceptibility [11]. Therefore, it is important to solve the low power of the genome-wide epistasis analyses problem with a method that does not depend on known related loci.
A major goal in human genetics research is to understand genetic contributions to complex diseases, specifically the molecular mechanisms by which common DNA variants influence disease etiology. The functional relevance of most discovered loci, including those that have been the most reproducibly associated, remains unclear. Readily available data from the Encyclopedia of DNA Elements (ENCODE) [12] and the Roadmap Epigenomics Project [13] have made it possible to investigate regulatory elements in noncoding regions. A number of studies demonstrated that disease- and trait-associated genetic variants were enriched in regulatory elements, mostly enhancers [14]. Distant enhancers located at considerable genomic distances from gene promoters can be brought into close spatial proximity through specific chromosomal interactions, which are essential for the control of spatiotemporal gene expression [15]. Direct interactions between enhancers and promoters are central to dominant models of enhancer function [15]. In strong support of these models, the interaction between enhancers and their target genes can induce gene transcription, even in the absence of a key transcriptional activator [16]. Considering the important roles of enhancers in genetic predisposition to diseases, analyzing genomic interactions between genes and surrounding enhancers is a great knowledge-based method to solve the low power of the genome-wide epistasis analysis problem.
In this study, we performed genetic interaction analyses of protein-coding genes and surrounding enhancers to identify variations that may play a role in the risk of T2DM. By considering statistically interacting SNPs, we identified a novel susceptibility gene, the epidermal growth factor receptor (EGFR), for T2DM. Our results provide new insights into the genetic architecture of T2DM.
METHODS
Subjects
The basic characteristics of the samples used in this project are presented in Table 1. The discovery data were obtained from the Gene Environment Association Studies (GENEVA [17], http://www.genevastudy.org/). We used a subset of GENEVA data on diabetic and nondiabetic subjects from a case-control study of T2DM nested within cohorts of the Nurses' Health Study (https://www.nurseshealthstudy.org) and the Health Professionals' Follow-up Study (https://sites.sph.harvard.edu/hpfs/), two well-characterized cohort studies, which include stored blood and DNA samples, as well as detailed information on dietary and lifestyle variables of the participants. The samples were genotyped using the Affymetrix Genome-Wide Human SNP Array 6.0 (Thermo Fisher Scientific, Waltham, MA, USA).
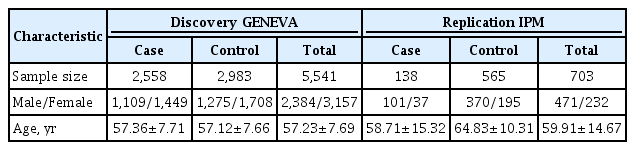
Basic characteristics of subjects
All the subjects in this study were reported to be of European ancestry. After selection, 2,558 diabetic and 2,983 nondiabetic subjects were available for analyses (dbGaP: phs000091.v2.p1). A replication sample was derived from the Biobank Program of the Institute of Personalized Medicine (IPM) at Mount Sinai Medical Center. The primary sample consisted of 2,867 self-identified African-Americans, European-Americans, and Hispanics. The samples were genotyped using the Affymetrix 6.0 chip. All the individuals included in the replication study were reported to be of European ancestry. After selection, 138 diabetic and 565 nondiabetic subjects were available for analyses (dbGaP: phs000388.v1.p1).
Acquisition of SNP pairs and SNP pruning
SNP pairs were selected between the protein-coding genes and enhancers around each gene. We used gene annotations from GENCODEv19 (https://www.gencodegenes.org). Only genes annotated from chromosome 1–22 were used, which resulted in a total of 19,430 coding genes. The SNPs of the protein-coding genes were limited to SNPs within 2 kb regions around the genes. Enhancers were identified by the presence of active epigenetic histone modifications, such as H3K4me1, H3K4me3, and H3K27ac. To annotate the enhancer regions, we used publicly available ChIP-seq datasets on pancreatic islets from the Roadmap Project (http://www.roadmapepigenomics.org/). Enhancer regions located within 2 kb of the transcription start sites of the protein-coding genes were removed. The SNPs intersected with at least one broad peak of H3K4me1, H3K4me3, and H3K27ac in pancreatic islets annotated as enhancers. Enhancers were further assigned to genes within 250 kb of the gene.
We filtered individuals in the discovery and replication data by an initial scan of individual relatedness. We estimated the genetic relationship matrix of all individuals from all the autosomal SNPs in the GENEVA and IPM data separately, using a tool for genome-wide complex trait analysis [18] and excluded one of each pair of individuals with an estimated genetic relationship of more than 0.025. Using this approach, 633 and 117 individuals were removed from the GENEVA and IPM datasets, respectively, to achieve unrelatedness. Quality control in the discovery data was then performed using the whole genome association analysis toolset, PLINK [19], according to the following criteria: individual missing rate <5%, SNP call rate >99%, minor allele frequency (MAF) >5%, and Hardy-Weinberg equilibrium P>0.001. A pruned subset of SNPs was further generated using 0.6 (r2) as the pairwise linkage disequilibrium (LD) threshold.
SNP×SNP interaction analyses
For each protein-coding gene, we first carried out interaction analyses of the SNPs of the gene and SNPs of the surrounding enhancers in the discovery sample. After SNP quality control and LD-based SNP pruning, 13,642 protein-coding genes with usable SNPs were used in the analysis. Finally, 1,576,465 SNP pairs of protein-coding genes and surrounding enhancers were included in the interaction analyses. The number of enhancers of protein-coding genes ranged from 1 to 99. We then performed SNP×SNP interaction analyses in PLINK for the selected SNP pairs in the discovery dataset, which fits a logistic regression model in the following equation: Y=β0+β1×SNP1+β2×SNP2+β3×SNP1×SNP2+β4×Cov1+ … +βn+3×Covn+e.
The odds ratios (ORs) for the interaction were represented by the term exp(β3). Sex, age, and the first 10 principal components were used as potential covariates in the interaction analyses. The principal components were measured using genome-wide complex trait analysis software [18]. To test for associations in the replication samples, we selected SNP pairs significantly associated with T2DM (P<5×10⁻⁵).
As any imbalance between the number of diabetic and nondiabetic subjects in the replication data would affect the results, we used boosting corrections to deal with the imbalance in the replication dataset in accordance with the method of Bosco [20]. First, we divided the nondiabetic group into five overlapping subgroups, each of which was the same size as the diabetic group. We then combined each nondiabetic subgroup with the diabetic group to form a balanced pair and selected a set of phenotype-associated SNPs (P<0.01), which were considered dominant SNPs for simplicity. We assigned each subgroup confidence scores according to the frequencies of dominant loci and obtained each sample's confidence score by averaging the confidence scores of all the subgroups where it appeared. Finally, we normalized the confidence score of the sample and performed weighted logistic regression.
We used METAL software [21] to combine the results of the SNP×SNP analyses from the different populations using a sample-size weighted model. After adjusting for multiple comparisons by the Bonferroni correction, the significance threshold was set at P<3.17×10⁻⁸ (0.05/1,576,465). We also conducted genetic association analyses of the identified SNPs and T2DM in two samples using the same covariate adjustments as in the epistasis analyses to check whether the individual SNPs involved main effects.
Functional annotation
We further annotated the regions surrounding identified SNP pairs using Hi-C interaction data and topologically associating domain (TAD) data. The Hi-C interaction data in multiple available cell lines were downloaded from the 4DGenome Database [22]. TADs in the GM12878 cell line were downloaded from the Gene Expression Omnibus (GEO) data GSE63525 (https://www.ncbi.nlm.nih.gov/geo/query/acc.cgi?acc=GSE63525) [23], and the DNA sequences physically interacted with each other more frequently within a TAD [242526]. To check whether the identified SNPs pairs were located in the same TAD-like domain in human pancreatic islets [27], we used TAD-like domains identified using promoter capture Hi-C in pancreatic islets via a directionality index score [25].
Differential expression analyses
We examined whether the interaction effect of the identified SNP pairs affected the expression of their target genes using a linear regression model and data on the expression levels of target genes in pancreas samples from subjects in the GTEx Pilot Project [28].
To check whether the identified susceptibility genes were differentially expressed in diabetic and nondiabetic subjects, we used four GEO datasets, GSE76894, GSE25724, GSE12643, and GSE9006. GSE76894 included the gene expression profiles of 84 nondiabetic and 19 T2DM islets isolated from pancreases unsuitable for transplantation [29]. The organ donors were obtained in Pisa with the approval of the local ethics committees. We then performed a microarray analysis of the GSE25724 dataset to evaluate differences in the transcriptomes of the T2DM and nondiabetic human islet samples. Human islets were isolated from seven nondiabetic and six T2DM organ donors by collagenase digestion, followed by density gradient purification [30]. In the GSE12643 dataset, transcript levels in myotubes from 10 obese patients with T2DM and 10 healthy control subjects matched according to age and body mass index were examined [31]. In the GSE9006 dataset, to evaluate differences in the transcriptome, gene expression profiles of peripheral blood mononuclear cells from 24 healthy volunteers, 43 newly diagnosed type 1 diabetes mellitus patients, and 12 newly diagnosed T2DM patients were analyzed [32]. Only gene expression profiles from healthy and T2DM subjects were included in the study. In each GEO dataset, we performed differential expression analyses of the identified susceptibility genes using publicly available preprocessed series matrix files.
RESULTS
SNP×SNP interaction analyses
We first carried out interaction analyses of the discovery sample and selected the top 65 SNP pairs significantly associated with T2DM (P<5×10⁻⁵) to test for associations in the replication sample (Supplementary Table 1) [33]. Combining the results from the two datasets, only one SNP pair, rs4947941×rs7785013, was significantly associated with T2DM after multiple testing corrections (combined P=4.84×10⁻¹⁰) (Table 2). Rs4947941 and rs7785013 were in relatively low LD with each other, with an r2 of 0.011 and 0.005 in GENEVA and IPM, respectively. The directions of the effect of this SNP pair were congruent in the two datasets. The interaction OR was estimated to be 0.91 (95% confidence interval [CI], 0.88 to 0.95) in the discovery data and 0.78 (95% CI, 0.70 to 0.86) in the replication data. This indicated that the effect of the minor allele of SNP rs4947941 (T-allele, MAFGENEVA=0.443, MAFIPM=0.424) decreased 0.91-fold (interaction OR value) and 0.78-fold in T2DM patients for each copy of the minor allele of rs7785013 (A-allele, MAFGENEVA=0.158, MAFIPM=0.137). However, the single SNP association analysis of these two SNPs revealed no significant association in either sample (P>0.05) (Table 2).

The interaction SNP pairs identified for type 2 diabetes mellitus
Next, we checked whether the effect of the minor allele “A” of rs7785013 on T2DM differed among individuals carrying different genotypes of rs4947941 using the ORs. As shown in Fig. 1, in the GENEVA dataset, the minor allele “A” of rs7785013 was increased 1.10-fold in T2DM subjects carrying “CC” of rs4947941 and decreased 0.99-fold and 0.93-fold in T2DM subjects carrying “TC” and “TT” of rs4947941, respectively. Consistent with these findings, in the replication data derived from the IPM, the minor allele “A” of rs7785013 was increased 1.30-fold in T2DM subjects carrying “CC” of rs4947941 and decreased 0.97-fold and 0.81-fold in T2DM subjects carrying “TC” and “TT” of rs4947941, respectively. Therefore, the minor allele “A” of rs7785013 reduced the risk of T2DM with an increase in the dosage of “T” of rs4947941.
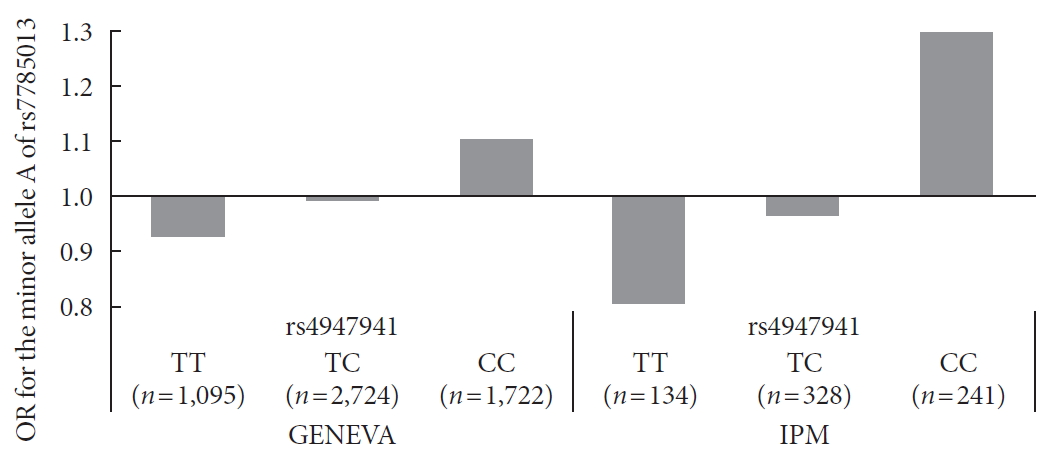
Association of the minor allele “A” of rs7785013 with type 2 diabetes mellitus in subjects carrying different genotypes of rs4947941 in the Gene Environment Association Studies (GENEVA) and Institute of Personalized Medicine (IPM) datasets. The odds ratios (ORs) of the association analyses results are shown in the y-axis. TT, subjects carrying “TT” of rs4947941; TC, subjects carrying “TC” of rs4947941; CC, subjects carrying “CC” of rs4947941.
Functional annotation
The SNP rs4947941 was located in RP11-745C15.2 and overlapped with many enhancer marks, including H3k4me1, H3k4me3, and H3k27ac (Fig. 2). The SNP rs7785013 was located in the intron region of the protein-coding EGFR. The published Hi-C datasets showed that the rs4947941 frequently interacted with the EGFR. Thus, the region surrounding rs4947941 tended to be closer in space to the EGFR (Fig. 2). The TAD annotation results showed that these two SNPs were located in the same TAD region in the GM12878 cell line (Chr7: 54830000-55330000) (Fig. 2) and TAD-like domain in human pancreatic islets (Chr7: 54824893-55497476).
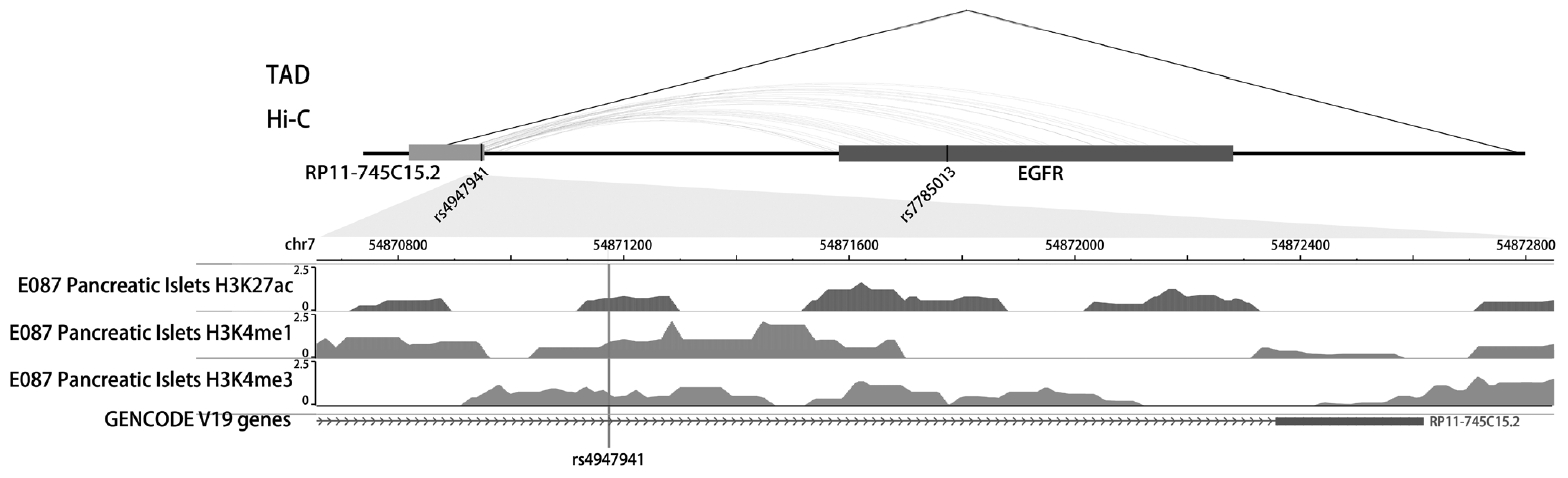
Epigenetic annotation for the region surrounding rs4947941 and rs7785013. The topologically associating domain (TAD) data in the GM12878 cell line were downloaded from the Gene Expression Omnibus (GEO) data, GSE63525. TAD-like domains were identified using promoter capture Hi-C in human pancreatic islets. Chromatin interaction data in multiple cell lines were downloaded from the 4DGenome Database. Active histone modifications, including H3k4me1, H3k4me3, and H3k27ac, in pancreatic islets were obtained from the Roadmap Project using the WashU EpiGenome Browser. EGFR, epidermal growth factor receptor.
Differential expression analyses
Analyses of the interaction effect of rs4947941×rs7785013 on EGFR expression showed that this SNP pair was significantly associated with EGFR expression in the pancreas (P=0.033). As shown in Fig. 3, the minor allele “A” of rs7785013 was positively associated with the EGFR expression in subjects carrying “CC” and “TC” of rs4947941 but negatively associated with EGFR expression in subjects carrying “TT” of rs4947941. Therefore, the minor allele “A” of rs7785013 decreased the gene expression of the EGFR with an increasing dosage of “T” of rs4947941.
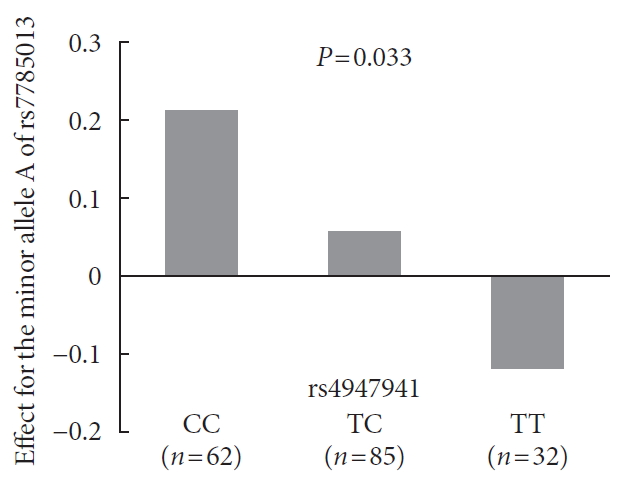
Association of the minor allele “A” of rs7785013 with the expression of the epidermal growth factor receptor (EGFR) in the pancreas of subjects carrying different genotypes of rs4947941 in the GTEx Pilot Project. The beta values of the association analyses results are shown in the y-axis. CC, subjects carrying “CC” of rs4947941; TC, subjects carrying “TC” of rs4947941; TT, subjects carrying “TT” of rs4947941.
In a one-tailed t-test, we examined whether the EGFR was differentially expressed in diabetic and nondiabetic subjects in the four GEO datasets. The results showed that EGFR was significantly up-regulated in diabetic samples in GSE76894 (P=9.8×10⁻⁴) (Fig. 4A), GSE25724 (P=5.9×10⁻³) (Fig. 4B), GSE12643 (P=0.047) (Fig. 4C), and GSE9006 (P=0.047) (Fig. 4D). It is worth noting that these results were consistent with the effect of the SNP interaction on T2DM and EGFR expression.

The results of the differential expression analyses of the epidermal growth factor receptor (EGFR) in diabetic and nondiabetic subjects in the (A) GSE76894, (B) GSE25724, (C) GSE12643, and (D) GSE9006 datasets.
Functional validation in the Mouse Genome Informatics database
To investigate the function of the EGFR, we used the Mouse Genome Informatics (MGI) database [343536], which contains integrated genetic, genomic, and biological data aimed at facilitating the study of human health and disease. The results revealed that the EGFR was involved in multiple phenotypes associated with T2DM, including disorganized pancreatic islets, abnormal pancreatic beta cell morphology, abnormal pancreas morphology, and a small pancreas in murine models (http://www.informatics.jax.org/marker/phenotypes/MGI:95294) [37].
DISCUSSION
As noted earlier, multiple hypotheses have been put forward to explain the well-known “missing heritability” problem. Epigenetics and rarer variants with larger effects are among the reasons advanced to explain the limitations of GWASs [7]. In the previous studies, we reported a method that integrating epigenetic features for predicting SNPs associated with T2DM and other complex disorders [3839]. In this study, considering the important role of the interaction between an enhancer and its target gene in gene regulation and disease pathogenesis, we performed genetic interaction analyses of variants between enhancers and protein-coding genes to identify susceptibility loci associated with T2DM.
We identified one significant interaction pair, rs4947941×rs7785013, which was associated with T2DM after multiple testing corrections. Previous GWASs have not reported the relationships between these two SNPs and T2DM or other disorders. In the present study, rs4947941 overlapped with many enhancer marks, and rs7785013 was located in the intron region of the EGFR. The annotation results showed that these two SNPs were located in the same TAD region. Furthermore, the region surrounding rs4947941 tended to be closer in space to the EGFR. Thus, the EGFR may serve as a susceptibility gene for T2DM.
The EGFR encodes a type of transmembrane glycoprotein, which is a member of the protein kinase superfamily. Prior to the GWAS catalog [40], no previous GWASs reported the relationship between EGFR polymorphisms and T2DM. In the present study, we detected associations between all EGFR polymorphisms and T2DM in two GWAS datasets, and no significant association results were obtained after multiple testing corrections (Supplementary Table 2) [33]. A previous study revealed that inhibition of EGFR tyrosine kinase activity ameliorated insulin resistance [41]. In the present study, differential expression analyses using four GEO datasets confirmed that EGFR may be a novel gene for the risk of T2DM. Furthermore, the EGFR was significantly up-regulated in diabetic samples.
In parallel with our study, recent research integrated epigenomics and TAD data and discovered T2DM-associated enhancer-promoter SNP pairs from imputed data where neither SNP achieved independent genome-wide significance [42]. Manduchi et al. [42] reported that one enhancer-promoter SNP pair, rs7991210-rs3742250, was significantly associated with T2DM in pancreatic islets after main effect filtering (combined P=2.16×10⁻⁹). In our data, we attempted to validate this epistasis effect of the SNP pair, rs7991210-rs3742250. As the promoter SNP, rs3742250, was not included in the discovery data, we used two other SNPs that were in LD with rs3742250 (D′>0.75) as surrogates using Phase 3 data from the 1000 Genomes project as a reference panel [43]. Combining the results of the two datasets, we found that these two SNP pairs were significantly associated with T2DM (P<0.05) (Supplementary Table 3) [33]. In addition, our approach did not restrict the analysis to the promoter region of the gene. Lee et al. [44] detected dynamic enhancer contacts throughout the gene bodies that tracked with elongating RNA polymerase II and the leading edge of RNA synthesis. Thus, we considered all enhancer-gene interactions, an approach that could yield more interesting results.
Some limitations of the current study should be addressed. The genetic susceptibility and etiology of T2DM may differ among populations of distinct ancestral origin. In the present study, most of the genotype data in the dbGaP database were based on Europeans, and only subjects who reported European ancestry were included in the epistasis analyses. Further studies are recommended to investigate the association between the rs4947941–rs7785013 interaction and T2DM in different ethnic groups. The sample size may be an additional limitation. We identified only one significant SNP pair for T2DM after multiple corrections, which was far fewer than we excepted. It is possible that the sample size was not large enough to obtain an accurate estimate. The Bonferroni correction employed to reduce type I errors may have increased the probability of false negatives. Consequently, a further study with a larger sample size is needed to validate our results.
In summary, we performed genetic interaction analyses of enhancers and protein-coding genes for T2DM. We identified one SNP pair, rs4947941×rs7785013, that was significantly associated with T2DM. Further annotation, differential expression, and functional validation studies suggested that the EGFR may be a susceptibility gene for T2DM.
SUPPLEMENTARY MATERIALS
Supplementary materials related to this article can be found online at https://doi.org/10.4093/dmj.2019.0204.
Supplementary Table 1
Top 65 associated SNP pairs
Supplementary Table 2
The association between all EGFR polymorphisms and T2DM
Supplementary Table 3
The interaction effects of the previously identified SNP pairs
Notes
CONFLICTS OF INTEREST
No potential conflict of interest relevant to this article was reported.
AUTHOR CONTRIBUTIONS
Conception or design: Y.Y., S.Y., J.M.D., W.C., Y.G.
Acquisition, analysis, or interpretation of data: S.Y., J.M.D.
Drafting the work or revising: S.Y., Y.G.
Final approval of the manuscript: Y.Y., S.Y., J.M.D., W.C., Y.G.
FUNDING
This study was supported by the National Natural Science Foundation of China (31871264, 81872490), Innovative Talent Promotion Plan of Shaanxi Province for Young Sci-Tech New Star (2018KJXX-010), Natural Science Foundation of Zhejiang Province (LGF18C060002, LWY20H060001), Major Science and Technology Projects in Xiaoshan District (2018224), Natural Science Basic Research Program Shaanxi Province (2018JQ3058) and the Fundamental Research Fund for Central Universities. This study was also supported by the High Performance Computing Platform of Xi’an Jiaotong University and the China Scholarship Council.
ACKNOWLEDGMENTS
We acknowledge use of data from the GENEVA consortium and IPM Biobank Project. In performing the current study, we did not collaborate with the investigators of these projects. Therefore, our study does not necessarily reflect their opinions. The datasets were obtained through dbGaP authorized access (accession numbers: phs000091.v2.p1 and phs000388.v1.p1).