Associations among Obesity Degree, Glycemic Status, and Risk of Heart Failure in 9,720,220 Korean Adults
Article information

Abstract
Background
Recent studies suggest an association between diabetes and increased risk of heart failure (HF). However, the associations among obesity status, glycemic status, and risk of HF are not known. In this study, we analyzed whether the risk of HF increases in participants according to baseline glycemic status and whether this increased risk is associated with obesity status.
Methods
We analyzed the risk of HF according to baseline glycemic status (normoglycemia, impaired fasting glucose [IFG], and diabetes) in 9,720,220 Koreans who underwent Korean National Health Screening in 2009 without HF at baseline with a median follow-up period of 6.3 years. The participants were divided into five and six groups according to baseline body mass index (BMI) and waist circumference, respectively.
Results
Participants with IFG and those with diabetes showed a 1.08- and 1.86-fold increased risk of HF, respectively, compared to normoglycemic participants. Compared to the normal weight group (BMI, 18.5 to 22.9 kg/m2), the underweight group (BMI <18.5 kg/m2) showed a 1.7-fold increased risk of HF, and those with BMI ≥30 kg/m2 showed a 1.1-fold increased risk of HF, suggesting a J-shaped association with BMI. When similar analyses were performed for different glycemic statuses, the J-shaped association between BMI and HF risk was consistently observed in both groups with and without diabetes.
Conclusion
Participants with IFG and diabetes showed a significantly increased HF risk compared to normoglycemic participants. This increased risk of HF was mostly prominent in underweight and class II obese participants than in participants with normal weight.
INTRODUCTION
The prevalence of diabetes is markedly increasing globally [1]. Diabetic complications can be divided into macro- and microvascular complications, and it is well known that poor glucose control increases the risk of developing diabetic complications [2 3]. As most diabetic complications are caused by atherosclerotic changes to the vasculature, comprehensive interventions of multiple cardiovascular risk factors beyond glucose control, such as dyslipidemia, hypertension, and obesity, are important for the prevention of these vascular complications [4].
Epidemiologic and clinical data have shown that, in addition to conventional cardiovascular diseases such as ischemic heart disease and ischemic stroke, heart failure (HF) is a major contributor to cardiovascular mortality in patients with diabetes [5 6]. The prevalence of HF in patients with diabetes is high, and the prognosis is worse in patients with HF who have diabetes than in patients who do not have diabetes [6 7 8]. Recent cardiovascular outcome trials of novel anti-diabetic agents have shown the importance of decrease in hospitalization due to HF in the reduction of cardiovascular mortality in patients with diabetes [9 10 11]. These results have led physicians to be alert about the danger of HF in patients with diabetes in order to prevent mortality in these patients.
Obesity is a risk factor for cardiovascular diseases, including HF [12 13]. Obesity increases the risk of HF, and the prevalence of obesity in patients with HF is known to be high [14 15]. However, once a diagnosis of HF is confirmed, the prognosis is known to be better in obese patients than in their leaner counterparts, according to the “obesity paradox” [14].
Various epidemiological data suggest that prediabetes is also associated with a high risk of HF, not just diabetes [16 17]. In other studies, subjects with metabolic syndrome showed an increased risk of HF [18]. Similar to diabetes, prediabetes is known to be a relevant predictor of prognosis in patients with HF [19 20]. However, few studies have analyzed the risk of HF across the glycemic spectrum.
In this study, we aimed to analyze the prevalence and risk of HF in a large number of participants in the Korean National Health Screening (KNHS) dataset. In addition, we analyzed the risk of HF across the glycemic spectrum from normoglycemia to diabetes and in relation with obesity status.
METHODS
The NHIS database and NHIS health checkup data
Nearly all (97.2%) of the Korean population, approximately 50 million) Koreans are covered by the National Health Insurance Service (NHIS), which is a nonprofit, single-payer organization of the Korean government. The NHIS maintains patients' demographic information, examinations, claims for disease diagnosis codes of the International Classification of Diseases (ICD-10), and treatment that can be used to produce a population-based cohort [21]. Insured Korean adults over the age of 40 years and employees over the age of 20 years undergo regular health checkups provided by the NHIS every 1 or 2 years. The KNHS databases obtained through these checkups provide a variety of information including anthropometric measurements, health questionnaire results, and laboratory findings.
There are two kinds of KNHS and NHIS database that are provided to the researchers. One is customized research database, which is composed of data from all Koreans, and the other is sample research database, which is composed of data from selected 1 million Koreans. This study was performed with customized research database, and these databases included all data available regarding our customized variables and years of follow-up. Our analyses were performed after NHIS' approval for the use of its database for the research (research number NHIS-2019-1-249).
Our study protocol was approved by the Institutional Review Board (IRB) of the Kangbuk Samsung Hospital (KBSMC 2019-01-034). The requirement for informed consent was waived by the IRB as the data released to the researchers were de-identified.
Measurements
Body weight (kg) and height (cm) were measured using an electronic scale, and waist circumference (WC; cm) was measured at the middle point between the rib cage and iliac crest by trained examiners. All blood samples were collected after fasting, and blood pressure was measured using a sphygmomanometer after 5 minutes of rest. Baseline health behaviors such as income, smoking, alcohol consumption, and exercise were confirmed through standardized questionnaires. Body mass index (BMI) was calculated as body weight (kg) divided by height (m) squared.
Participants were divided into three groups according to smoking status (never smokers, ex-smokers, and current smokers) and three groups according to alcohol consumption status (non-drinkers, drinking less than 30 g/day, and drinking equal to or more than 30 g/day). Physical activity was defined as engaging in regular exercise (either of the following intensity levels): physical activity with high intensity for more than 20 minutes per session ≥3 days per week and physical activity with moderate intensity for more than 30 minutes per session ≥5 days per week. Low income was defined as being in the lowest 25% of income distribution among the whole population.
Study design and definition of diseases
All participants who underwent KNHS from January 2009 to December 2009 (n=10,505,818) were initially enrolled in the study. Participants younger than 20 years (n=15,327) and those with missing data for baseline characteristics and covariates (n=561,049) were subsequently excluded. Participants who had pre-existing HF at baseline (n=209,242) were also excluded from the study, resulting in a total of 9,720,200 participants. Development and the risk of HF were assessed using the claims records of the NHIS until the end of 2015 for these participants (Supplementary Fig. 1). The diagnosis of HF was defined by ICD-10 code I50 and hospitalization.
The risk of HF was analyzed in groups categorized by baseline glycemic status assessed by fasting blood glucose (FBG). Impaired fasting glucose (IFG) was defined as FBG of 100 to 125 mg/dL, and diabetes was defined as FBG ≥126 mg/dL or ICD-10 code E11 to 14 with a claim for anti-diabetic medication [22]. Newly developed diabetes is defined by FBG ≥126 mg/dL in KNHS in 2009 and no claim for ICD-10 code E11–14 or anti-diabetic medication before 2009. The duration of claims for the above codes with anti-diabetic medication prescription ahead of 2009 was defined as the duration of diabetes.
In addition, the risk of HF was analyzed according to baseline obesity status. The BMI of the participants was divided into five levels according to the classification of obesity of Korean Society for the Study of Obesity: underweight, normal, pre-obese, obese class I and ≥ obese class II (BMI<18.5, 18.5 to 22.9, 23.0 to 24.9, 25.0 to 29.9, and ≥30.0 kg/m2) [23]. Furthermore, the incidence rates (IRs, per 1,000 person-years) and hazard ratios (HRs) of newly diagnosed HF were calculated according to BMI levels, using a reference range of 18.5 to 22.9 kg/m2, which is recommended normal range in Asians [23 24]. In addition, the WC of the participants was divided into six levels (men/women: <80.0/75.0, 80.0/75.0 to 84.9/79.9, 85.0/80.0 to 89.9/84.9, 90.0/85.0 to 94.9/89.9, 95.0/90.0 to 99.9/94.9, and ≥100.0/95.0 cm), and the IRs (per 1,000 person-years) and HRs of newly diagnosed HF were calculated according to WC levels, using a reference range of 85.0 to 89.9 cm for men and 80.0 to 84.9 cm for women, which is a recommended cutoff for abdominal obesity in Koreans [25].
For subgroup analyses, the analyses were performed in the absence and presence of various diseases. The diagnosis of hypertension or hyperlipidemia was confirmed using laboratory data (systolic blood pressure ≥140 mm Hg and diastolic blood pressure ≥90 mm Hg; total cholesterol levels ≥240 mg/dL) or 10th International Statistical Classification of Diseases and Related Health Problems (ICD-10) code (I10 to 15; or E78) with a claim for medication for the individual disease. Ischemic heart disease was defined by the claims of ICD-10 codes I21 to 25 and ischemic stroke was defined by ICD-10 codes I63 or I64. Cancer was defined as patient registration in the NHIS with ICD-10 code C, and chronic obstructive pulmonary disease was defined as ICD-10 codes J41 to 44. Chronic kidney disease (CKD) was defined as an estimated glomerular filtration rate of <60 mL/min/1.73 m2 by the Modification of Diet in Renal Disease method [26].
Statistical analysis
Comparisons of the continuous variables between participants with and without diabetes at baseline were performed using the Student's t-test. Comparisons of the categorical variables among the groups were performed using the chi-square test.
HRs were assessed using the Cox proportional hazards model with 95% confidence intervals (CIs) by analyzing the risk of HF according to baseline glycemic status and obesity status assessed based on BMI or WC. We conducted multivariable adjustments for age, sex, smoking, alcohol drinking, regular exercise, low income, hypertension, dyslipidemia and CKD that could affect the outcome, and further adjustments for insulin injection, number of oral hypoglycemic agents, and duration of diabetes in patients with diabetes. In addition, we performed subgroup analyses using the Cox proportional hazards model with P for interaction according to the presence or absence of the underlying diseases.
P values less than 0.05 were considered statistically significant. SAS version 9.3 (SAS Institute Inc., Cary, NC, USA) was used for all statistical analyses.
RESULTS
General characteristics of the participants are presented in Supplementary Table 1. Of the participants, 8.5% had diabetes, and 22.6% had IFG at baseline. Participants who had diabetes at baseline were older and more obese than those who did not have diabetes. Most metabolic parameters were significantly worse in those who had diabetes than in those who did not (Supplementary Table 1). Among those who had diabetes, 34.6% had newly developed diabetes, 34.2% had diabetes for less than 5 years, and 31.2% had diabetes for more than 5 years.
When the risk of HF was analyzed according to baseline glycemic status, participants who had diabetes showed a 1.86-fold increased risk of HF compared to those who did not have diabetes (Table 1). Those with IFG showed a 1.08-fold increased risk of HF compared to those who did not have diabetes after adjustment for confounding factors.

Hazard ratio (95% confidence interval) for heart failure according to glycemic status
The risk of HF was analyzed according to obesity degree, with both BMI and WC (Table 2). Participants who were in pre-obese range and class I obesity (BMI 23.0 to 24.9 and 25.0 to 29.9 kg/m2) showed a lower risk of HF than the reference group. Those who had more than class II obesity (BMI ≥30.0 kg/m2) showed a significantly increased risk of HF compared to those who had normal BMI. Interestingly, participants who were underweight (BMI <18.5 kg/m2) showed a significantly increased risk of HF compared to the normal BMI groups and an even higher risk than those who were obese, suggesting a J-shaped relationship (Table 2).

Risk for heart failure according to obesity degree
When similar analyses were performed according to different abdominal obesity degrees by WC, the risk of HF showed a significantly linear increment according to the increasing degree of abdominal obesity, which differed from the results of the analyses performed according to BMI degree (Model 2, Table 2). However, when the variables related with diabetes, such as anti-diabetic medication and duration of diabetes, were included in the model, similar trend of J-shaped relationship was observed (Model 3, Table 2).
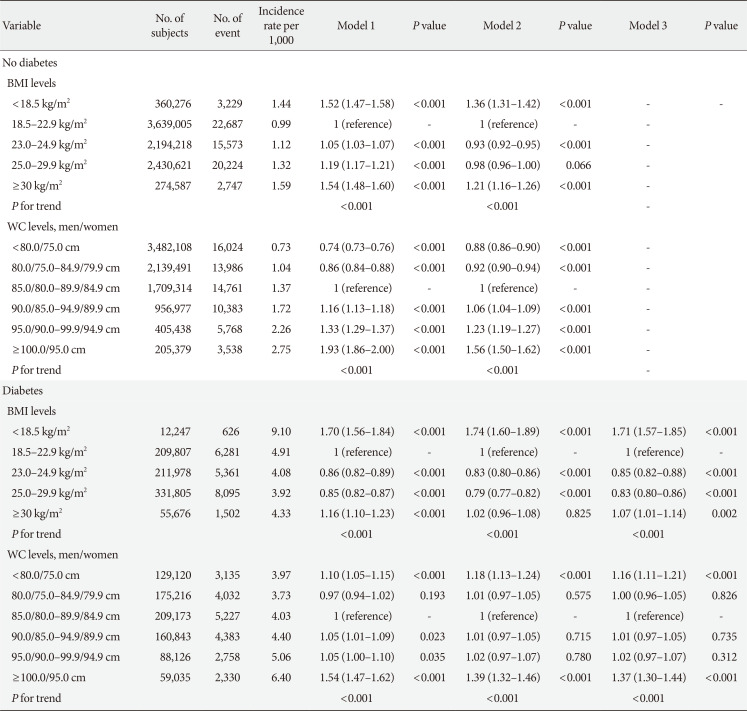
The risk of HF was analyzed according to different obesity degrees and according to the presence or absence of diabetes (Table 3). In participants who did not have diabetes, a trend for J-shaped relationship was observed with BMI increase and HF risk, and a linear relationship was observed with increasing degree of abdominal obesity. When the analyses were performed in those with diabetes, a trend for J-shaped relationship was observed between BMI increase and HF risk. However, a J-shaped relationship was observed between increasing WC degree and HF risk, different from the results in those who did not have diabetes (Table 3). When these analyses were performed after separating the participants into five groups comprising normoglycemia, IFG, and three groups with diabetes (newly diagnosed, less than 5 years, longer than 5 years), the linear relationship between HF risk and WC was only observed in the normoglycemia and IFG groups, and those in the three groups of diabetes showed J-shaped relationship between HF risk and WC (Supplementary Table 2).

Hazard ratio (95% confidence interval) for heart failure in different obesity degree according to presence or absence of diabetes
HF risks in underweight subjects (BMI <18.5 kg/m2) were analyzed with not underweight counterparts (BMI ≥18.5 kg/m2) as the reference in various subgroups and presence or absence of diabetes (Supplementary Table 3). In those without diabetes, underweight participants showed significantly increased HF risk compared with their not underweight counterparts (HR>1.00), and these risks were higher if the subjects were older, had abdominal obesity or CKD, were women, had hypertension, dyslipidemia, stroke or heart disease. However, HF risk was lower in underweight smokers than their not underweight counterparts. In those with diabetes, HF risks were higher in underweight participants who were younger, and who did not have CKD compared to their counterparts.
When the glycemic status and obesity degree by BMI were analyzed in the same model, the risk of HF showed a J-shaped curve, with the highest risk in underweight participants with the longest diabetes duration, and the J-shaped curve repeated in each group of different glycemic statuses (Fig. 1).

Risk for heart failure in different glycemic status and obesity degree with normoglycemia and normal body weight as the reference. IR, incidence rate; HR, hazard ratio; CI, confidence interval.
DISCUSSION
In this nationwide population-based study, participants who had prediabetes showed an 8% and those who had diabetes showed an 86% increased risk of HF compared to those who were normoglycemic at baseline. The risk of HF showed a J-shaped relationship with obesity status; those who had more than class II obesity and were underweight showed a significantly increased risk of HF compared to the normal and overweight groups assessed by BMI. These results bring attention to the increased risk of HF in patients with prediabetes, not just in those with diabetes, and that these increased risks show a J-shaped relationship with obesity, with increased risk in those with severe obesity and underweight patients.
In this study, participants with diabetes showed a significant 1.86-fold increased risk of HF compared to those with normoglycemia at baseline. In a retrospective cohort study that analyzed data from a third-party database of 8,231 patients with diabetes and 8,845 matched non-diabetic subjects and no HF at baseline who were followed up for 6 years, the incidence of HF was 30.9 per 1,000 person-years in subjects with diabetes and 12.4 per 1,000 person-years in subjects without diabetes [27]. Another study found a similar result with almost a 2-fold increased risk of HF in patients with diabetes compared to that in those without diabetes [28]. In reverse, the prevalence of diabetes is high among patients hospitalized with HF, showing 25% to 40% in patients with HF depending on the population studied, suggesting diabetes as a relevant risk factor for HF [20].
The mechanism for the increased risk of HF in patients with diabetes is complex. Hypertrophy of the diabetic heart is the consequence of myocardial triglyceride deposition [29]. In addition, hyperinsulinemia and insulin resistance, the well-known pathophysiologic cause of type 2 diabetes mellitus, is also thought to directly promote myocardial hypertrophy [30 31]. Deposition of advanced glycation end products constitutes a driving factor for microvascular damage in diabetes and is associated with cardiomyocyte stiffness and myocardial collagen deposition [32 33]. Apart from these structural changes, alterations in myocardial energy metabolism from glucose as the main fuel to a shift toward fatty acid oxidation is a hallmark of the diabetic heart [34]. The aggravating factor of the diabetic heart is that the occurrence of insulin resistance in the diabetic heart aggravates the limitation in energy supply of a failing heart that usually relies more on the oxidation of glucose as fuel due to the suppression of the fatty acid oxidation machinery [35]. Therefore, patients with a diabetic heart with severe insulin resistance will have worse prognosis than that in patients with HF without diabetes.
In this study, the HF risk was significantly increased in participants with IFG compared to those with normoglycemia. Various epidemiologic data have shown that prediabetes is associated with a high risk of HF and suggest an age-adjusted hazard ratio between 1.2 and 1.7 in different populations of patients with IFG [16 17]. In another study, metabolic syndrome, another high risk group for diabetes, was associated with an increased risk of HF, with two-thirds of patients developing HF [18]. Although the results of previous studies and ours show that the risk of HF in prediabetic participants is lower than in participants with diabetes, these results suggest that a disturbance in normal glucose metabolism would increase the risk of HF.
In our study, obesity status assessed by BMI showed a J-shaped relationship with HF risk, with increased risk in both who were underweight and in more than class II obesity range compared to those with normal body weight. Interestingly, the subjects in pre-obese range and class I obesity showed lower risk of HF compared with the subjects with normal weight. It is well known that obesity increases the risk of HF [36]. Overall, approximately 38% of patients with HF are obese [15]. However, previous studies show similar results with our study in that subjects in pre-obese and class I obesity range showed better outcomes than those who are of normal weight or under-weight [37 38]. Although the exact mechanism behind the association between obesity and HF are not known, increased blood volume caused by an increased amount of lean mass with subsequently increased cardiac output and increased pro-inflammatory milieu caused by increased fat mass with subsequent cardiac dysfunction in obese subjects is thought to be the main mechanism [35]. In contrast, increased skeletal muscle mass seen in obese individuals may actually also exact protective effects related to better outcomes in HF [39]. Recent studies suggest lowering inflammatory response via reduction of adipose tissue, increasing lean mass of good quality and focusing on cardiorespiratory fitness as the better ways to improve outcomes and lower mortality in patients with HF, and possibly to prevent HF in high risk patients, rather than focusing on numerical reduction of BMI [36].
The strength of our study is that we confirmed the relationship between obesity status and HF risk based on different glycemic statuses for the first time. A J-shaped association between HF risk and obesity status assessed by BMI was observed, in those with and without diabetes. However, obesity status assessed by WC showed a different relationship with HF in those with and without diabetes, such that in those without diabetes, abdominal obesity status showed a linear relationship with HF risk, but this relationship was not observed in those with diabetes, showing a similarly J-shaped relationship to that observed with obesity status assessed by BMI. These results suggest that in those without diabetes, direct relationship between insulin resistance or ectopic fat accumulation reflected by abdominal obesity and HF risk, existed, as previously reported [40 41]. However, in those with diabetes, these relationships would not have been observed because of the effect of other factors that influence development of HF, which suggests that diabetes itself is a stronger risk factor for HF development than abdominal obesity. The explanation for consistently increased HF risk in underweight diabetes patients could be due to low lean mass in these patients [39]. Further research is needed to better clarify the mechanisms for these observations.
Despite these strengths, our study has limitations. First, the glycemic status of the participants was only assessed based on FBG, and glycated hemoglobin measurements were not available in this dataset. Therefore, there might be some participants who have a prediabetic status other than IFG with increased postprandial hyperglycemia and not categorized as having IFG or diabetes. However, the presence of diabetes could be relatively correctly assessed with the inclusion of the ICD-10 code for diabetes. Second, as the diagnosis of diabetes was dependent on FBG in KNHS and claims for ICD-10 code with anti-diabetic medications, those who were diagnosed as diabetes and not taking any anti-diabetic medication in whom FBG were not in diabetic range in KNHS, could have been missed in this study. Third, the development of HF was only assessed based on the I50 ICD-10 code with hospitalization, and no other assessment tools such as cardiac echocardiography. Therefore, there might be some participants with subclinical HF who could have been missed from the detection, and the actual incidence of HF could have been underestimated. In addition, we could not differentiate between HF with reduced ejection fraction (HFrEF) or systolic HF and HF with preserved ejection fraction (HFpEF) or diastolic HF. These two forms of HF have very different pathophysiologic mechanisms, which are highlighted by the fact that beneficial therapeutic strategies in HFrEF have failed to improve outcomes in HFpEF [42 43]. Fourth, the body composition of the participants could not be assessed, which could have contributed to inaccurate assessment of the effect of obesity status on HF development, reaching the suggestion of “obesity paradox” in the relationship between obesity and HF. Lastly, a few of the anti-diabetic medications are known to influence body weight and HF risk. However, we could not include the specific anti-diabetic medications prescribed in the analyses. Notwithstanding the limitations, our study has meaning in that this was the first nationwide population-based study that analyzed the relationships among glycemic status, obesity status, and the development of HF.
In conclusion, in this study that analyzed a large nationwide population-based database, participants with prediabetes and diabetes showed a significantly increased risk of HF, and this increased risk showed a J-shaped relationship with obesity status assessed with BMI, suggesting the “obesity paradox.” Further studies on the role of specific components of body composition on the development of HF in various ethnic groups are warranted to clarify the specific mechanism of and relationships among obesity, glycemic status, and HF risk.
ACKNOWLEDGMENTS
We sincerely thank the Korean National Health Insurance Corporation for organizing and providing the excellent cohort database based on nationwide population.
Notes
CONFLICTS OF INTEREST: No potential conflict of interest relevant to this article was reported.
AUTHOR CONTRIBUTIONS:
Conception or design: E.J.R., W.Y.L.
Acquisition, analysis, or interpretation of data: E.J.R., K.D.H., Y.G.P., W.Y.L.
Drafting the work or revising: E.J.R., W.Y.L.
Final approval of the manuscript: H.K., S.E.P., Y.H.K.
References
SUPPLEMENTARY MATERIALS
Supplementary materials related to this article can be found online at https://doi.org/10.4093/dmj.2019.0104.
Supplementary Table 1
General characteristics of the participants according to presence and absence of diabetes
Supplementary Table 2
Risk for heart failure according to glycemic status and obesity degreea
Supplementary Table 3
Subgroup analyses of heart failure risk in underweight subjects (BMI <18.5 kg/m2) compared with not underweighted counterparts (BMI ≥18.5 kg/m2 as the reference) according to presence and absence of diabetes in various conditions
Supplementary Fig. 1
Selection of the study participants. ICD, International Classification of Diseases; F/U, follow-up.