Inhibition of Ceramide Accumulation in Podocytes by Myriocin Prevents Diabetic Nephropathy
Article information

Abstract
Background
Ceramides are associated with metabolic complications including diabetic nephropathy in patients with diabetes. Recent studies have reported that podocytes play a pivotal role in the progression of diabetic nephropathy. Also, mitochondrial dysfunction is known to be an early event in podocyte injury. Thus, we tested the hypothesis that ceramide accumulation in podocytes induces mitochondrial damage through reactive oxygen species (ROS) production in patients with diabetic nephropathy.
Methods
We used Otsuka Long Evans Tokushima Fatty (OLETF) rats and high-fat diet (HFD)-fed mice. We fed the animals either a control- or a myriocin-containing diet to evaluate the effects of the ceramide. Also, we assessed the effects of ceramide on intracellular ROS generation and on podocyte autophagy in cultured podocytes.
Results
OLETF rats and HFD-fed mice showed albuminuria, histologic features of diabetic nephropathy, and podocyte injury, whereas myriocin treatment effectively treated these abnormalities. Cultured podocytes exposed to agents predicted to be risk factors (high glucose, high free fatty acid, and angiotensin II in combination [GFA]) showed an increase in ceramide accumulation and ROS generation in podocyte mitochondria. Pretreatment with myriocin reversed GFA-induced mitochondrial ROS generation and prevented cell death. Myriocin-pretreated cells were protected from GFA-induced disruption of mitochondrial integrity.
Conclusion
We showed that mitochondrial ceramide accumulation may result in podocyte damage through ROS production. Therefore, this signaling pathway could become a pharmacological target to abate the development of diabetic kidney disease.
INTRODUCTION
The prevalence of diabetic nephropathy is increasing in parallel with the incidence of diabetes mellitus [1]. Diabetic nephropathy is a significant health problem worldwide and a leading cause of end-stage renal disease, accounting for approximately 50% of its cases in the developed world [2]. The pathogenesis of diabetic nephropathy is complex and multifactorial and includes a combination of hemodynamic and metabolic abnormalities that collectively contribute to kidney damage and result in albuminuria and reductions in the glomerular filtration rate. Intrarenal hemodynamic abnormalities in association with activation of the renin-angiotensin system and hyperglycemia-associated generation of reactive oxygen species (ROS) are two factors leading to diabetic nephropathy [345]. However, because of the lack of comprehensive understanding of the pathogenesis of diabetic nephropathy, its pharmacological management remains challenging. Evidence is emerging that renal lipid metabolism may play a direct role in diabetic nephropathy progression [67].
Ceramides are a family of sphingolipids that differ in their fatty acyl moiety and are intermediates in the sphingolipid synthesis pathway [8]. Evidence from various studies revealed that ceramide is an important mediator of inflammation [9], and it is associated with insulin resistance and metabolic disorders in various animal models as well as in humans. Furthermore, it has been reported that plasma ceramides are elevated in obese patients with type 2 diabetes mellitus [10]. Most ceramide studies have focused on insulin resistance in the liver, muscle, and adipose tissue; only few have associated increased ceramide levels with renal injury, and most reports on diabetic nephropathy have used extrapolated data from plasma ceramide levels [111213].
Ceramides can be generated by hydrolysis of sphingomyelin or can be produced by de novo synthesis [14]. Serine palmitoyltransferase (SPT) is the initial, rate-limiting enzyme of de novo ceramide synthesis. Administration of myriocin, a selective SPT inhibitor, prevents homocysteine-induced ceramide formation in the renal cortex and attenuates glomerular injury [15].
Podocytes are highly specialized epithelial cells that line the outer surface of the glomerular basement membrane [16]. The glomerular podocyte density is the best predictor of albuminuria and diabetic nephropathy progression [17]. Podocytes are characterized by a prominent nucleus, a well-developed Golgi system and endoplasmic reticulum, and large numbers of mitochondria. Podocyte mitochondria play a primary role in maintaining energy homeostasis [18] and mitochondrial dysfunction is involved in podocyte injury [1920]. Also, podocyte injury leads to progression of diabetic nephropathy [21].
Studies have indicated the possibility of glomerular ceramide and metabolites such as sphingosine accumulations contributing to the podocytopenia seen in patients with diabetic nephropathy [1222]. But how ceramide causes podocyte damage and whether myriocin has a protective effect in animal models of diabetic nephropathy remain unanswered questions. Therefore, we conducted experiments in animal models of diabetic nephropathy and immortalized mouse podocytes to test the hypothesis that mitochondrial ceramide accumulation in podocytes induces cell damage and albuminuria.
METHODS
Animals
The Institutional Animal Care and Use Committee of the Asan Institute for Life Sciences (Seoul, Korea) approved all experiment protocols and animals used (2009-12-010). We purchased 8-week-old male C57BL/6N mice from Central Lab Animal (Seoul, Korea) and fed them a normal chow diet (12% energy from fat) or a high-fat diet (HFD; 60% energy from fat; Research Diets, New Brunswick, NJ, USA) for 8 weeks. We obtained 8-week-old male Otsuka Long Evans Tokushima Fatty (OLETF) and Long Evans Tokushima Otsuka (LETO) rats from Otsuka Pharmaceutical (Osaka, Japan).
Administration of myriocin
We treated OLETF rats for 4 weeks (starting at 18 weeks of age) and HFD-fed mice for 8 weeks (starting at 8 weeks of age) with myriocin (2S,3R,4R,6E)-2-amino-3,4-dihydroxy-2-(hydroxymethyl)-14-oxo-6-eicosenoic acid (0.3 mg/kg/day; Sigma, St. Louis, MO, USA), added to powdered, standard mouse chow.
Urinary albumin excretion rate
We placed all OLETF rats at 22 weeks and C57BL/6N mice at 16 weeks of age in individual metabolic cages for 24 hours urine collections to measure urinary albumin excretion rates. We used an enzyme-linked immunosorbent assay (ELISA; Immunology Consultants Laboratory, Portland, OR, USA) to measure the urinary albumin excretion rates.
Electron microscopy
Kidney tissues were cut into 1 mm3 fragments. We washed kidney tissue or cultured cell samples in fresh 0.1 M phosphate buffer (pH 7.4) and fixed them in 2.5% glutaraldehyde in the same buffer for 4 hours at room temperature (RT). We then washed the tissues three times in fresh 0.1 M phosphate buffer (pH 7.4) for 10 minutes and fixed them in 1% OsO4 for 1 hour at RT and washed three times in 0.1 M phosphate buffer (10 minutes each). We embedded the samples in Epon according to standard techniques after dehydration with ethyl alcohol and propylene oxide. Ultrathin sections (60 nm) were cut from the blocks using a Reichart-Jung Ultratome E with a diamond knife. The sections were collected and stained with uranyl acetate followed by lead citrate, and we visualized them using a Hitachi H-7100 Transmission Electron Microscope (TEM) system (Hitachi, Tokyo, Japan).
Immunohistochemistry
Kidney specimens were fixed in Bouin's solution. Immunostaining was performed in paraffin-embedded sections using an avidin-biotin immunoperoxidase technique with monoclonal antibodies against desmin (1:50; Dako, Glostrup, Denmark). The sections were incubated overnight at 4℃ with primary antibodies, washed with phosphate buffer saline, and then incubated with secondary antibodies (biotinylated anti-mouse immunoglobulin G [IgG] and avidin-biotin-peroxidase complex; Vector Labs, Burlingame, CA, USA) for 1 hour at RT. The reaction was developed using diaminobenzidine tetrahydrochloride (Sigma) and counterstained with hematoxylin.
Ceramide measurements
We used both a liquid chromatography-tandem mass spectrometry system equipped with 1290 HPLC (Agilent, Santa Clara, CA, USA) Qtrap 5500 (AB Sciex, Framingham, MA, USA), and a reverse phase column (Pursuit 5 C18 150×2.0 mm). The separation gradient for ceramide used a mobile phase A (5 mM ammonium formate/MeOH/tetrahydrofuran; 500/200/300) and a mobile phase B (5 mM ammonium formate/MeOH/tetrahydrofuran; 100/200/700) and proceeded at 200 µL/min and 35℃ as follows: 50% of A for 0 minute, 50% of A for 5 minutes, 30% of A for 8 minutes, 30% of A for 15 minutes, 10% of A for 22 minutes, 10% of A for 25 minutes, 50% of A for 25.1 minutes, and then 50% of A for 30 minutes. The separation gradient for phosphatidylcholine (PC) used a mobile phase A (10 mM ammonium acetate in MeOH/isopropanol/H2O; 900/50/50) and a mobile phase B (10 mM ammonium acetate in MeOH/isopropanol/H2O; 940/50/10) and proceeded at 400 µL/min and 35℃ as follows: 50% of A for 0 minute, 50% of A for 5 minutes, 20% of A for 10 minutes, 20% of A for 27 minutes, 50% of A for 27.1 minutes, and then 50% of A for 30 minutes. We used the selected reaction monitoring mode in positive ion mode and used the extracted ion chromatogram corresponding to the specific transition for each lipid for quantification. The calibration range for sphingolipids was 0.1 to 1,000 nM (r2≥0.99). We used the peak area ratio of each lipid/internal standard for relative comparisons among PCs.
Podocyte culture
We cultured cells in RPMI 1640 (Welgene, Daegu, Korea) supplemented with 10% heat-inactivated fetal bovine serum (FBS), 100 U/mL penicillin, and 100 mg/mL streptomycin in the presence of 50 U/mL recombinant murine interferon-γ (PeproTech, Rocky Hill, NJ, USA) at 33℃ in 5% CO2/95% air (permissive conditions). We achieved differentiation into podocytes by culturing cells with 10% FBS in the absence of interferon-γ at 37℃ (non-permissive conditions). Cells were then maintained under non-permissive conditions for 10 to 14 days. We confirmed the differentiation of podocytes under light microscopy by detection of synaptopodin, a podocyte differentiation marker [23]. After starving differentiated podocytes in Dulbecco's Modified Eagle Medium without FBS for 24 hours, we treated the cells with high glucose (25 mM), high free fatty acid (FFA) (200 µM linoleic acid), and angiotensin II (1 µM) (GFA) in combination or the same amount of mannitol for the indicated times in serum-free medium. We used podocytes between passages 15 and 20 in all experiments.
Cell viability assay
We harvested cells and plated them onto 96-well plates at 1×10³ cells/well maintained at 37℃ in a humidified incubator. After starving in media without FBS for 24 hours, cells were treated with GFA. At the indicated time points, we added 10 µL of cell counting kit 8 (CCK-8) solution (Dojindo Molecular Tech, Gaithersburg, MD, USA) into wells in triplicate and incubated them for 1 hour. We then calculated the number of viable cells in each well by measuring absorbance at 450 nm in a Spectramax 450PC (Molecular Devices, Sunnyvale, CA, USA).
ELISA for apoptosis
We measured the levels of cytosolic histone-bound DNA fragmen-ts using a Cell Death ELISA kit (Roche Diagnostics, Mannheim, Germany), as described by the manufacturer.
Mitochondrial ROS production measurement
We measured mitochondrial-specific ROS generation using the MitoSOX Red fluorescent dye (Molecular Probes, Eugene, OR, USA) as described by the manufacturer. We grew cells on glass coverslips (Marienfeld, Lauda-Königshafen, Germany) and loaded them with MitoSOX Red (5 µmol/L) for 30 minutes at 37℃. We measured the cell fluorescence using confocal microscopy at 510 nm and emission at 580 nm.
Analysis of fluorescence intensity
We determined the integrated fluorescence intensity by manually segmenting each cell in the image and then computing the average fluorescence intensity. We subtracted the background intensity in an area without cells and normalized the resulting data by the fluorescence of the calibration standard. We averaged fluorescence intensity values for 10 randomly selected cells in two different image fields to represent one sample. The experiment was repeated five times, and the data were averaged [24].
Statistical analysis
All values are presented as mean±standard error of the mean. We assessed comparisons between two groups using Mann-Whitney tests or unpaired two-tailed t-tests. We analyzed data from more than two groups using one-way or repeated measure analysis of variance. We performed all statistical analyzes using the SPSS-PC15 software (SPSS Inc., Chicago, IL, USA). Differences were considered statistically significant at P<0.05.
RESULTS
Myriocin prevented albuminuria and podocyte injury in OLETF rats
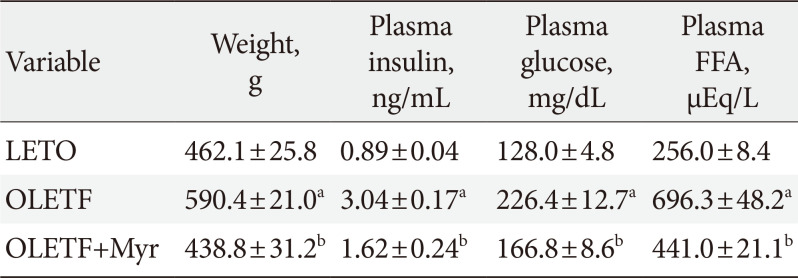
First, we examined the effect of myriocin on known animal models of diabetic nephropathy. In agreement with previous studies [25], the OLETF rats were more obese than the control LETO rats (Table 1). Plasma insulin, FFA, and glucose were also increased in OLETF rats compared with their levels in control LETO rats (Table 1). Also, OLETF rats at 22 weeks had significantly increased urinary albumin excretion and ceramide concentration of kidney cortex (Fig. 1A and B). Treatment with myriocin (0.3 mg/kg/day) from 18 to 22 weeks of age modestly reduced the increases in body weight, fasting plasma blood glucose, FFA, and insulin levels, as previously published (Table 1) [26]. These results suggest that the insulin resistance of OLETF rats was improved by myriocin. Also, treatment with myriocin significantly decreased the albuminuria and ceramide concentration of kidney cortex in the rats as compared with the levels in untreated rats (Fig. 1A and B). Moreover, in periodic acid-Schiff (PAS) staining, we observed diffuse mesangial thickening with glomerular basement membrane thickening in OLETF rats (a finding consistent with diabetic nephropathy), and treatment with myriocin reverted these changes (Fig. 1C). Immunostaining for desmin (a marker for podocyte injury) was significantly increased in the OLETF rats compared with that in the LETO rats, whereas it was notably decreased in the OLETF rats treated with myriocin compared with the level in their untreated counterparts (Fig. 1C).

Effect of myriocin on body weight, fasting glucose, plasma insulin, and FFA levels in rats at 22 weeks of age

Myriocin prevented albuminuria and podocyte injury in Otsuka Long Evans Tokushima Fatty (OLETF) rats. OLETF rats at 18 weeks of age were treated with myriocin for 4 weeks. (A) Twenty-four hours urinary albumin excretion. Data are presented as mean±standard error of the mean (n=7). (B) Kidney cortex ceramide concentration determined by liquid chromatography tandem mass spectrometry (LC-MS/MS) (n=5). (C) Representative images of immunostaining for periodic acid-Schiff (PAS) and desmin, a marker of podocyte injury and epithelial-mesenchymal transition. Scale bars, 50 µm (n=3). Con, control. aP<0.050.01 vs. Long Evans Tokushima Otsuka (LETO) rats, bP<0.050.05 vs. untreated OLETF rats.
Myriocin prevented albuminuria and podocyte injury in HFD-fed mice
HFD feeding induces various systemic metabolic alterations in mice, including hyperglycemia and dyslipidemia. Moreover, these alterations are similar to those observed in patients with type 2 diabetes mellitus [27]. Renal injury induced by HFD feeding in mice is similar to diabetic nephropathy in humans [28]. So, we examined the effect of myriocin on HFD-fed mice. HFD-fed mice showed a significant increase in body weight compared with the control group mice, and treatment with myriocin reduced the body weight difference between the treated mice and the control mice (Table 2). Also, treatment with myriocin attenuated the metabolic complications such as the increased plasma insulin, glucose, and FFA levels in HFD-fed mice compared with the levels in untreated mice (Table 2). Next, HFD-fed mice exhibited an increase in urinary albumin excretion and kidney cortex ceramide levels (Fig. 2A and B). Additionally, it showed glomerular hypertrophy and basement membrane thickening on histology (consistent with nephropathy) (Fig. 2C) compared with the control mice. Treatment with myriocin restored the albuminuria and ceramide concentration (Fig. 2A and B), and reverted the histological changes induced by the HFD (Fig. 2C). Nephrin is a crucial podocyte protein that functions as an adhesion molecule and a structural component of the slit diaphragm [29]. Nephrin staining is decreased in patients with diabetes mellitus, correlating with broadening of the foot process [30]. In HFD-fed mice, nephrin staining was less intense that that in control mice. Treatment with myriocin reverted these changes as compared with those in untreated mice (Fig. 2D). In all, HFD-fed mice showed podocyte damage and increased albuminuria, whereas decrease in ceramide level by myriocin prevented podocyte injury.

Effect of myriocin on body weight, fasting glucose, plasma insulin, and FFA levels in mice at 16 weeks of age

Treatment with myriocin prevented albuminuria and podocyte injury in high-fat diet (HFD)-fed mice. (A) Twenty-four hours urinary albumin excretion (n=7). Data are presented as mean±standard error of the mean. (B) Kidney cortex ceramide concentration determined by liquid chromatography tandem mass spectrometry (LC-MS/MS) (n=5). (C) Representative images of immunostaining for periodic acid-Schiff (PAS) and desmin. Scale bars, 50 µm (n=3). (D) The panels show representative images of the immunofluorescence analysis of glomeruli from control, HFD diet, and HFD-fed treated myriocin (HFD+Myr) mice. Myriocin restored the nephrin expression in HFD-fed mice. Green fluorescence denotes nephrin in the glomeruli, and blue fluorescence (DAPI) is indicative of the presence of a nucleus (×300). Con, control. aP<0.050.01 vs. control diet mice, bP<0.050.05 vs. untreated HFD-fed mice.
Combined exposure to high glucose, FFA, and angiotensin II increased the ceramide level and induced podocyte apoptosis in in vitro experiments
We mimicked a diabetic milieu in vitro and examined the effects of putative pathogenic factors on cultured podocytes. Exposure of the cells to GFA reproducibly decreased cell viability and induced cellular apoptosis within 4 hours of culture (Fig. 3A and B). GFA treatment significantly increased ceramide generation in cultured podocytes as compared with the levels in untreated podocytes (Fig. 3C). Pretreatment with myriocin prevented GFA-induced increases in ceramide production and cell death (Fig. 3C and D).
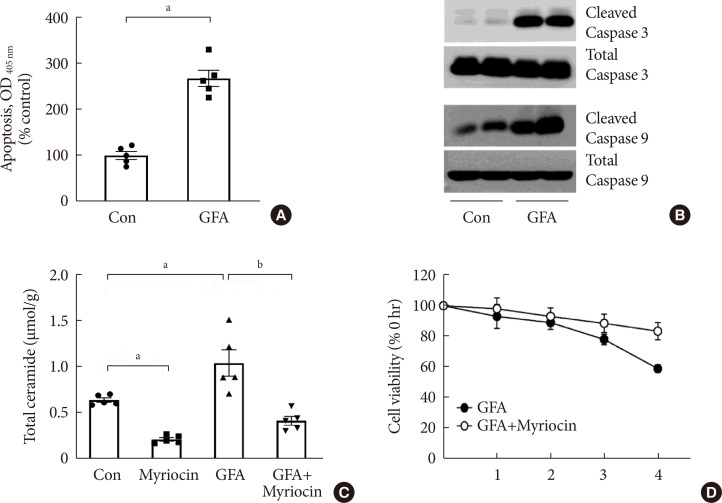
Glucose, free fatty acid, and angiotensin II (GFA) treatment induced podocyte apoptosis. Myriocin pretreatment prevented GFA-induced ceramide accumulation and alleviated the deleterious effects of GFA. (A) Apoptosis was determined at 4 hours using a Cell Death enzyme-linked immunosorbent assay (ELISA) kit (n=5). (B) Representative immunoblots for cleaved caspase-3 and caspase-9 (n=5). (C) Ceramide concentration determined by liquid chromatography tandem mass spectrometry (LC-MS/MS) (n=5). (D) Cell viability measured by the cell counting kit 8 (CCK-8) method (n=5). Data are presented as mean±standard error of the mean. Con, control; OD, optical density. aP<0.050.05 vs. untreated cells, bP<0.050.01 vs. GFA-treated cells.
GFA increased ceramide generation and ROS production in mitochondria of podocytes, and treatment with myriocin reverted these changes
Ceramide induces mitochondrial ROS production, which likely explains some of the harmful effects of ceramide accumulation [31]. Thus, we checked the changes of ceramide accumulation and mitochondrial ROS production in podocytes over time. We monitored the levels of MitoSOX, an indicator of mitochondrial superoxide anion (O2−) production, to examine the time-dependent changes in mitochondrial ROS production. Cultured podocytes treated with GFA showed an increase in MitoSOX staining that first appeared at 60 minutes and peaked at 90 minutes to 2 hours. A time-course analysis of immunofluorescence staining for ceramide revealed a similar pattern to that of mitochondrial ROS in these cells (Fig. 4A). Interestingly, we observed that production of ceramide and ROS reached its peak 2 hours after treatment with GFA in podocytes, and this happened before the increase of apoptosis. Also, treatment with GFA showed an increase in ceramide and ROS production as compared with the levels in untreated cells, and inhibition of ceramide production by myriocin inhibited the production of ROS.

Myriocin decreased mitochondrial reactive oxygen species production through decreased ceramide accumulation and prevented glucose, free fatty acid, and angiotensin II (GFA)-induced mitochondrial morphological alterations. (A) Immunofluorescence corresponding to MitoSOX (red), ceramide (green), and nucleus (blue). Scale bars, 50 µm (n=3). (B) Transmission Electron Microscope (TEM) of podocyte mitochondria. Scale bars, 1 µm. We pretreated podocytes for 24 hours with or without 1 µM myriocin in serum-free medium and then incubated them with GFA for 4 hours (n=4).
TEM of podocytes revealed that, at 2 hours, GFA-treated podocytes exhibited an increased length of mitochondria with preserved cristae. At 4 hours, we observed vesicular distension of the mitochondrial cristae, indicating a progressive disruption of mitochondrial integrity. Pretreatment with myriocin prevented these morphological alterations induced by GFA (Fig. 4B).
DISCUSSION
Diabetic nephropathy is a common complication of diabetes and is the most common cause of end-stage renal disease in the world [2]. Trials of multifactorial interventions, including tightening glycemic control, blood pressure control, and the use of renin-angiotensin system blockers, have demonstrated that current treatment options slow but do not stop the progression of diabetic nephropathy [32]. The reason for this clinical limitation is the lack of comprehensive understanding of the underlying mechanisms of diabetic nephropathy progression. Therefore, identification of other determinants of diabetic nephropathy progression may lead to the development of novel drug candidates and better clinical outcomes.
In our study, we showed that myriocin, an inhibitor of de novo ceramide synthesis, improved albuminuria in two well-known diabetic animal models, OLETF rats, and HFD-fed mice. In both of these diabetic animal models, we identified podocyte injury, and treatment with myriocin ameliorated these changes. We exposed cultured podocytes to agents thought to increase the risk for diabetic nephropathy (GFA in combination) and found induced ceramide accumulation in mitochondria as well as increased cell death. Moreover, the decreased accumulation of ceramide by myriocin prevented GFA-induced cell death.
Low ROS concentrations have important functions in regulating pathways such as tumor necrosis factor receptor 1 signaling, but high ROS concentrations ultimately lead to DNA damage and cell death [33]. There is a lot of evidence that oxidative stress is the common link for the major pathways involved in the development and progression of diabetic vascular complications including diabetic nephropathy [33]. Previous studies have reported that ceramide and oxidative stress are intimately related to cell death induction [34]. Recently, there have been reports that the development of nonalcoholic steatohepatitis or pancreatic β-cell dysfunction in patients with type 2 diabetes mellitus is associated with an increase in ROS by ceramide [3536]. Moreover, in human myeloid leukemia U937 cells, it has been reported that ceramide elicits a direct effect on mitochondria to overproduce ROS, causing inhibition of the respiratory chain [37] and increasing permeability of the mitochondrial membrane to form ceramide channels that increase cytochrome C release [35]. One study demonstrated the effects of ceramide on the respiratory chain by using mitochondrial respiration-deficient cells in which the ceramide-induced H2O2 production was abolished [37]. Consistent with these studies, our experiments showed that the increased ceramide of cultured podocytes produces mitochondrial ROS and causes cell damage, and we were able to prevent podocyte injury by decreasing the ceramide level after treatment with myriocin. Next, we observed the mitochondria of podocytes by TEM to confirm that ceramide-induced apoptosis is related to mitochondrial morphological changes. As a result, we observed the vesicular distension of mitochondrial cristae after GFA treatment and the protection of mitochondria from cristae disorganization by pretreatment with myriocin. According to the previous studies, the integrity of mitochondrial cristae is important for mitochondrial function [3839]. Additionally, ROS is considered as an important signaling molecule that can modulate mitochondrial cristae morphology [39]. Taken together, our results suggest that the increase in mitochondrial ROS by ceramide accumulation induces mitochondrial dysfunction and podocytes apoptosis in diabetic nephropathy progression. However, the mechanism linking ceramide and mitochondrial ROS generation in diabetic nephropathy is still unclear, and future studies need to address this.
There are some limitations in this study. As described, myriocin attenuated features of diabetic nephropathy in animal models of diabetes but decreased body weight. According to the previous studies, myriocin treatment reduces body weight [2640]. It is not a result of any changes in food intake but rather occurs via an alternative mechanism such as an increase in metabolism and energy expenditure because, in a previous study, average daily intake is unchanged in myriocin-treated HFD-fed obese mice compared with controls [26]. Additional research is needed to determine the precise mechanism. Although weight loss itself has been reported to improve diabetic nephropathy [41], our findings suggest that there are other mechanisms improve albuminuria by myriocin. This is because the reduction of ceramide de novo synthesis by myriocin prevented podocyte injury in in vivo and subsequent in vitro experiments. To ensure this, pair-feeding experiments may be needed in the future. Another limitation of our experiment is that we did not measure plasma ceramide levels. However, according to a previous report, plasma ceramides are elevated in obese patients with diabetes [10], and we assumed that the ceramide levels of kidney cortex would have more direct effect on the deterioration of kidney function.
A variety of risk factors promotes the development and progression of diabetic nephropathy, and among them, high glucose, high FFA, and angiotensin II are well-known risk factors, respectively. In previous studies, the administration of high glucose for 24 hours caused increase podocyte apoptosis [42], and stimulation with angiotensin II for 24 hours resulted in podocyte injury [43], and they were generally used for in vitro diabetic nephropathy models. In addition, previous studies have shown decreased insulin sensitivity and ceramide formation when treated with fatty acid [444546]. Because diabetic nephropathy is a result of the combined action of various pathologic molecular pathways, we treated GFA in combination to mimic diabetic milieu. Since these risk factors were treated in combination, sufficient podocyte injuries were identified 4 hours after treatment. This was a short-term effect compared with those in the previous studies, but we considered it to be appropriate in in vitro model because it was a combination of factors involved in the pathogenesis of diabetic nephropathy. However, it is unclear which of the three substances mainly increased the ceramide levels or whether a combined effect caused those.
Abnormal lipid metabolism has been reported to be associated with the pathogenesis of diabetic nephropathy, and saturated fatty acids are known to promote ceramide accumulation. Also, plasma ceramide is elevated in obese patients with type 2 diabetes mellitus [10]. Thus, ceramide dysmetabolism may become an important target to manage diabetic nephropathy. In this study, we showed that mitochondrial ceramide accumulation may result in podocyte damage through ROS production in diabetic mice models, and this signaling pathway may be used as a pharmacological target to prevent diabetic nephropathy.
ACKNOWLEDGMENTS
This study was supported by grants from the National Research Foundation of Korea (NRF), funded by the Ministry of Education, Science, and Technology, Korea (2017R1E1A1A01074207: Eun Hee Koh), and the Asan Institute for Life Sciences, Korea (2016-557).
Notes
CONFLICTS OF INTEREST: No potential conflict of interest relevant to this article was reported.
AUTHOR CONTRIBUTIONS:
Conception or design: C.Y.W., K.U.L., E.H.K.
Acquisition, analysis, or interpretation of data: C.Y.W., J.Y.B., A.R.K., C.H.H., J.E.Y., H.S.K., H.J.Y., T.S.P., R.K., E.H.K.
Drafting the work or revising: C.Y.W., E.H.K.
Final approval of the manuscript: C.Y.W., E.H.K.