- Current
- Browse
- Collections
-
For contributors
- For Authors
- Instructions to authors
- Article processing charge
- e-submission
- For Reviewers
- Instructions for reviewers
- How to become a reviewer
- Best reviewers
- For Readers
- Readership
- Subscription
- Permission guidelines
- About
- Editorial policy
Articles
- Page Path
- HOME > Diabetes Metab J > Volume 44(1); 2020 > Article
-
Original ArticleTechnology/Device Role of MicroRNA-34a in Anti-Apoptotic Effects of Granulocyte-Colony Stimulating Factor in Diabetic Cardiomyopathy
-
In-Hwa Park1
 , Yi-Sun Song1, Hyun-Woo Joo1, Guang-Yin Shen2, Jin-Hee Seong1, Na-Kyoung Shin1, Young Jong Cho3, Yonggu Lee4, Jeong Hun Shin4, Young-Hyo Lim4, Hyuck Kim5, Kyung-Soo Kim1,4
 -
Diabetes & Metabolism Journal 2020;44(1):173-185.
DOI: https://doi.org/10.4093/dmj.2018.0211
Published online: April 23, 2019
1Graduate School of Biomedical Science and Engineering, Hanyang University, Seoul, Korea.
2Division of Cardiology, Department of Internal Medicine, Jilin Central Hospital, Jilin University, Jilin, China.
3Department of Laboratory Medicine, Kangwon National University School of Medicine, Chuncheon, Korea.
4Division of Cardiology, Department of Internal Medicine, Hanyang University College of Medicine, Seoul, Korea.
5Department of Thoracic Surgery, Hanyang University Seoul Hospital, Seoul, Korea.
- Corresponding author: Kyung-Soo Kim. Division of Cardiology, Department of Internal Medicine, Hanyang University College of Medicine, 222-1 Wangsimni-ro, Seongdong-gu, Seoul 04763, Korea. kskim@hanyang.ac.kr
- *In-Hwa Park and Yi-Sun Song contributed equally to this study as first authors.
Copyright © 2020 Korean Diabetes Association
This is an Open Access article distributed under the terms of the Creative Commons Attribution Non-Commercial License (http://creativecommons.org/licenses/by-nc/4.0/) which permits unrestricted non-commercial use, distribution, and reproduction in any medium, provided the original work is properly cited.
ABSTRACT
-
Background
- Recent studies have shown that microRNAs (miRNAs) are involved in the process of cardiomyocyte apoptosis. We have previously reported that granulocyte-colony stimulating factor (G-CSF) ameliorated diastolic dysfunction and attenuated cardiomyocyte apoptosis in a rat model of diabetic cardiomyopathy. In this study, we hypothesized a regulatory role of cardiac miRNAs in the mechanism of the anti-apoptotic effect of G-CSF in a diabetic cardiomyopathy rat model.
-
Methods
- Rats were given a high-fat diet and low-dose streptozotocin injection and then randomly allocated to receive treatment with either G-CSF or saline. H9c2 rat cardiomyocytes were cultured under a high glucose (HG) condition to induce diabetic cardiomyopathy in vitro. We examined the extent of apoptosis, miRNA expression, and miRNA target genes in the myocardium and H9c2 cells.
-
Results
- G-CSF treatment significantly decreased apoptosis and reduced miR-34a expression in diabetic myocardium and H9c2 cells under the HG condition. G-CSF treatment also significantly increased B-cell lymphoma 2 (Bcl-2) protein expression as a target for miR-34a. In addition, transfection with an miR-34a mimic significantly increased apoptosis and decreased Bcl-2 luciferase activity in H9c2 cells.
-
Conclusion
- Our results indicate that G-CSF might have an anti-apoptotic effect through down-regulation of miR-34a in a diabetic cardiomyopathy rat model.
- Diabetic cardiomyopathy is chronic myocardial dysfunction and remodeling which may be found in diabetic patients, in the absence of other potential contributors to myocardial dysfunction, including hypertension, coronary artery disease, and valvular heart disease [1]. Diabetic cardiomyopathy is characterized by diastolic ventricular dysfunction with cardiomyocyte hypertrophy, myocardial fibrosis, and cardiomyocyte apoptosis. Although, the pathophysiology of diabetic cardiomyopathy is not fully understood, recent studies indicate that cardiomyocyte apoptosis along with a prolonged exposure to high serum glucose level may play an important role in the development of diabetic cardiomyopathy [2].
- MicroRNAs (miRNAs) are small noncoding single-stranded RNAs that have significant effects on regulation of gene expression by binding to the 3'-untranslated region (3'-UTR) of target mRNA, inducing mRNA degradation or translational repression [3]. A bioinformatic target prediction algorithm (target scan, www.targetscan.org) shows that each miRNA regulates hundreds of target genes and is crucially involved in a wide range of biological pathways [45]. Studies have also shown that miRNAs are deeply involved in the pathophysiology of various cardiac diseases, and regulation of these miRNAs could allow modification of those processes [678]. Several miRNAs including miR-34a, miR-92a, miR-21, miR-320, miR-23a, and miR-15b have been reported to regulate processes related to cardiomyocyte apoptosis [91011121314].
- Granulocyte-colony stimulating factor (G-CSF) is a tyrosine kinase receptor-associated growth factor known to mediate proliferation and differentiation of hematopoietic progenitor cells [15]. G-CSF therapy has been reported to ameliorate the myocardial dysfunction seen in myocardial infarction (MI) and dilated cardiomyopathy, in animal as well as human studies [1617]. In previous studies, we have reported that G-CSF therapy improved left ventricular diastolic function and attenuated cardiomyocyte apoptosis in diabetic cardiomyopathy [1819]. However, little is known about the intracellular anti-apoptotic signaling processes induced by G-CSF therapy. Given that several miRNAs are involved in cardiomyocyte apoptosis and G-CSF attenuates cardiomyocyte apoptosis, we hypothesized that the therapeutic effects of G-CSF on diabetic cardiomyopathy may result from, regulation of miRNAs by G-CSF.
- Therefore, we investigated the relationship between the therapeutic effect of G-CSF and expression of several miRNAs in a rat model of diabetic cardiomyopathy. We also studied the changes in the expression of genes regulated by miRNAs.
INTRODUCTION
- Animals
- Male Sprague-Dawley rats (Koatech, Pyeongtaek, Korea), 6 weeks of age and weighing 280 to 300 g, were used in this study. A combination of a high-fat diet (HFD, 60% fat content, D12492; Research Diets, New Brunswick, NJ, USA) and a low dose of streptozotocin (STZ; Sigma, St. Louis, MO, USA) was used to induce a rat model of diabetic cardiomyopathy [2021]. The rats were kept in a specific pathogen-free facility at Hanyang University Medical School Animal Experiment Center under controlled temperature (23℃±2℃) and humidity (55%±5%) with a 12-hour artificial light and dark cycle. This research protocol was approved by the Hanyang University Institutional Animal Care and Use Committee (HY-IACUC-19-0016), and the experiments were performed in compliance with the Animal Research: Reporting of In Vivo Experiments (ARRIVE) guidelines on animal research [22].
- Experimental design
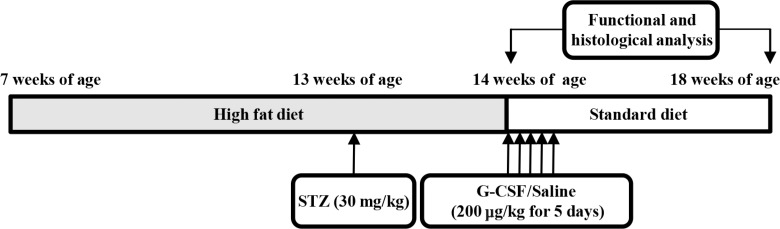
- Seven-week-old rats were separated into diabetic rats (n=15) and normal rats (n=8). The normal rats were fed a standard diet and the diabetic rats were fed an HFD for 7 weeks. After 6 weeks (at 13 weeks of age), the rats in the diabetic rat model group were intraperitoneally injected with 30 mg/kg STZ dissolved in 100 mM citrate buffer pH 4.5. We excluded diabetic rats with a fasting blood glucose (FBG) level below 200 mg/dL. The normal rats were intraperitoneally injected with only citrate buffer. At 1 week after STZ injection (at 14 weeks of age), the diabetic rats were randomly divided into two groups of treatment with saline (n=7) or G-CSF (n=8). The rats were injected intraperitoneally with either saline or 200 µg/kg/day recombinant human G-CSF (Leucostim; Dong-A Pharmacological, Seoul, Korea) for 5 days. At the time of initiation of G-CSF and saline administration, the diabetic rats were removed from HFD and fed with a standard diet (Fig. 1). All rats were euthanized at 18 weeks of age.
- Cell culture
- The H9c2 rat cardiomyocyte cell line was purchased from American Type Culture Collection (ATCC, Manassas, VA, USA). H9c2 cells were cultured in Dulbecco's modified Eagle's medium (DMEM; Gibco, Grand Island, NY, USA) supplemented with 5.5 mM glucose and 10% fetal bovine serum (FBS; Gibco), 100 U/mL penicillin and 100 mg/mL streptomycin (Gibco). The cells were maintained in a humidified 37℃ incubator with 5% CO2. The medium was replaced every 2 to 3 days, and cells were subcultured once they reached 80% to 90% confluence. When the cell populations reached 60% to 70% confluence, the cultures were exposed to D-glucose (Sigma) at a final concentration of 33 mM high glucose (HG) treatment according to previous publications [23] or to 5.5 mM D-glucose as normal glucose (NG). The cells were pretreated with HG (33 mM) for 48 hours with or without G-CSF (500 ng/mL). Cells were plated at an appropriate density according to experimental design.
- Echocardiography
- Echocardiography was performed using an ultrasound machine VIVID E9 (GE Healthcare, Milwaukee, WI, USA). The rats were anesthetized by intramuscular injection of a mixture of zoletil 50 (30 mg/kg; Virbac SA, Carros, France) and rompun (10 mg/kg; Bayer Korea, Seoul, Korea). All rats were placed in the left lateral decubitus position for serial echocardiographic examinations. The measurements included left ventricular ejection fraction (LVEF), peak velocity of the early diastolic filling wave (E), and early mitral annulus velocity (E'), as performed previously [1819]. All measurements represent the mean of five consecutive cardiac cycles and heart rate was calculated based on the strip chart of Doppler echocardiography.
- Body weight and biochemical analysis
- Blood samples were collected from tail veins after 12 hours of fasting and plasma was separated by centrifugation at 3,500×g for 10 minutes. Body weight (BW), FBG, total cholesterol (TC), triglyceride (TG), and fasting insulin levels were measured. Serum glucose, TC, and TG were measured using an Olympus AU400 auto analyzer (Olympus GmbH, Hamburg, Germany). Fasting insulin was measured using an EZRMI 13K kit (Linco, St. Charles, MO, USA) according to the manufacturer's instructions. Insulin resistance was estimated by the homeostasis model assessment of insulin resistance (HOMA-IR) using the following formula: HOMA-IR=fasting insulin (µU/mL)×fasting plasma glucose (mmol/L)/22.5 [24].
- Fluorescence-activated cell sorting analysis of apoptosis
- Fluorescein isothiocyanate (FITC)-conjugated annexin V and propidium iodide (PI) were used to identify apoptotic cells using a FITC-annexin V apoptosis detection kit (BD Biosciences Pharmingen, San Diego, CA, USA) according to the manufacturer's instructions [25]. The H9c2 cells were harvested after the experimental procedures and washed twice with PBS. The cells were resuspended in binding buffer and FITC annexin V and PI were added. The mixture was incubated for 15 minutes in the dark at room temperature. The resulting fluorescence was measured by flow cytometry using a fluorescence-activated cell sorting flow cytometer (BD Biosciences).
- Histology analysis
- The rats were anesthetized by intramuscular injection of a mixture of zoletil 50 (30 mg/kg) and rompun (10 mg/kg). Rats were weighed and their hearts were removed and divided into two halves along the anterior longitudinal middle line. One half of each heart was fixed in formalin, embedded in paraffin, and cut into 4 µm thick sections. The other half was frozen in liquid nitrogen and stored at −80℃ for real-time polymerase chain reaction (PCR) and Western blot analyses. The extent of myocardial fibrosis was determined by visualizing fibrotic tissue using Masson's trichrome (MT) staining. Apoptotic cardiomyocytes were evaluated using the terminal deoxynucleotidyl transferase dUTP nick end labeling (TUNEL) assay in paraffin sections with an In Situ Cell Death Detection kit (Roche, Mannheim, Germany). The stained sections were photographed using a light microscope (Leica DM 4000B; Leica, Wetzlar, Germany). Five regions from each digitized images were selected at random from the individual sections and quantified using the Leica image analysis system (Leica DM 4000B). All data were evaluated by an independent blinded investigator.
- RNA isolation and real-time PCR
- Total RNA was harvested from heart tissue and H9c2 cells using Qiazol reagent (Qiagen, Valencia, CA, USA), according to the manufacturer's instructions [26]. The concentration of each sample was measured using a Nanodrop ND-2000 spectrophotometer (Thermo Fisher Scientific Inc., Wilmington, DE, USA). For real-time PCR analysis, total RNA was reverse transcribed with stem-loop primers and the TaqMan MicroRNA Reverse Transcription kit (Applied BioSystems, Foster City, CA, USA), according to the manufacturer's instructions [24]. Real-time PCR was performed in duplicate using the TaqMan MicroRNA assay kit and TaqMan Universal PCR MasterMix (Applied Biosystems) for miR-34a, miR-92a, miR-21, miR-320, miR-23a, and miR-15b, according to the manufacturer's instructions. Real-time PCR was performed using the LightCycler480 program (Roche) for 40 cycles, (10 seconds each, at 95℃, 60℃, 72℃). Relative miRNA expression levels were normalized using the RNU6B (U6) small non-coding RNA as an endogenous control.
- Transient transfection with miRNA and oligonucleotides
- Transfection was carried out using Lipofectamine 2000 (Invitrogen, Carlsbad, CA, USA). For RNA interference, H9c2 cells were transfected with a miR-34a mimic (50 nM), miR-34a inhibitor (50 nM), or matched negative control (NC, 50 nM; GenePharma, Shanghai, China). All transfections were incubated for 24 hours, and then switched to NG (5.5 mM) media or HG (33 mM) media conditions. To examine whether miR-34a regulates the expression of B-cell lymphoma 2 (Bcl-2), a predicted target of miR-34a, H9c2 cells were co-transfected with luciferase vector (100 ng) containing the Bcl-2 3'UTR and miR-34a mimic or inhibitor using Lipofectamine 2000 (Invitrogen). Co-transfection with non-targeting NC RNA was performed as a control. The cells were harvested 24 hours after transfection, and luciferase activity was measured with a dual luciferase reporter assay kit (Promega, Madison, WI, USA) on a luminometer (Molecular Devices, Sunnyvale, CA, USA) following the manufactures instructions. Firefly luciferase activity was normalized to Renilla luciferase activity. All experiments were performed in triplicate.
- Western blotting
- The excised heart tissues were homogenized and total proteins were extracted using protein lysis buffer (Pro-preb; iNtRON, Seongnam, Korea). H9c2 cells were harvested and total proteins were extracted using RIPA cell lysis buffer (Genedepot, Hanam, Korea). Samples containing 60 µg of protein were transferred to sample buffer, separated by 10% sodium dodecyl sulfate polyacrylamide gel electrophoresis and transferred to an immobilon-P transfer membrane (PVDF, 0.45 µm pore size; Millipore, Billerica, MA, USA). After blocking in 5% skim milk solution for 60 minutes, the membranes were incubated with primary antibody for Bcl-2 (1:250; Santa Cruz Biotechnology, Santa Cruz, CA, USA), caspase-9 (1:250; Santa Cruz Biotechnology), or glyceraldehyde 3 phosphate dehydrogenase (GAPDH; 1:3,000; Cell Signaling Technology, Boston, MA, USA) overnight at 4℃. Membranes were then incubated with horseradish peroxidase (HRP)-conjugated anti-mouse antibody (1:1,000; Jackson Immunoresearch, West Grove, PA, USA) or anti-rabbit antibody (1:3,000; Jackson Immunoresearch) for 1 hour 30 minutes at room temperature. GAPDH was used as a protein loading control. Positive protein bands were visualized using an ECL kit (GenDEPOT, Barker, TX, USA), and the results were quantified with an image analyzer (Image lab 3.0; Bio-Rad, Hercules, CA, USA).
- Statistical analyses
- SPSS version 21.0 software (IBM Co., Armonk, NY, USA) was used for statistical analyses. All data are expressed as mean±standard deviation, except for histological data, which are expressed as mean±standard error. Histological data were analyzed using Kruskal-Wallis nonparametric analysis of variance (ANOVA, for multiple comparisons). Echocardiographic values between the groups were analyzed using two-way repeated measures ANOVA with Bonferroni's post hoc test for multiple comparisons. The remaining data were analyzed using oneway ANOVA (for multiple comparisons) with Tukey's post hoc test. Values of P<0.05 were considered statistically significant.
METHODS
- Body weight and biochemical analysis
- Supplementary Table 1 shows BW and results of biochemical analysis before and after treatment with G-CSF or saline. There were no differences in BWs between saline- and G-CSF-treated diabetic rats. FBG, TC, TG, insulin, and HOMA-IR were significantly increased in diabetic rats compared to the normal rats. G-CSF treatment significantly decreased TC and TG compared to saline-treated rats. However, G-CSF treatment did not significantly affect insulin or HOMA-IR in diabetic rats.
- Effects of G-CSF on cardiac function
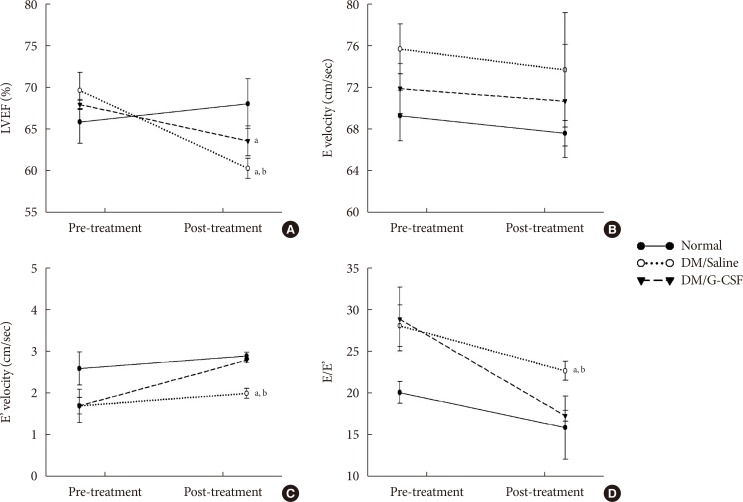
- To investigate the effect of G-CSF treatment on heart function of diabetic rats, echocardiography was performed to measure cardiac parameters. Before G-CSF treatment (pre-treatment), E' velocity was significantly decreased and E/E' ratio was significantly increased in diabetic rats compared to normal rats. This result suggests that the diabetic rats had developed diastolic dysfunction. After treatment with G-CSF (post-treatment), LVEF was significantly decreased in diabetic rats compared to normal rats. E' velocity (3.8%±0.05% vs. 3.0%±0.12%, P<0.05) was significantly increased and E/E' ratio was significantly decreased (17.3%±0.64% vs. 22.7%±1.15%, P<0.05) in G-CSF-treated rats compared to saline-treated rats (Fig. 2). These results suggest that G-CSF improved diastolic dysfunction.
- Anti-fibrotic effect of G-CSF
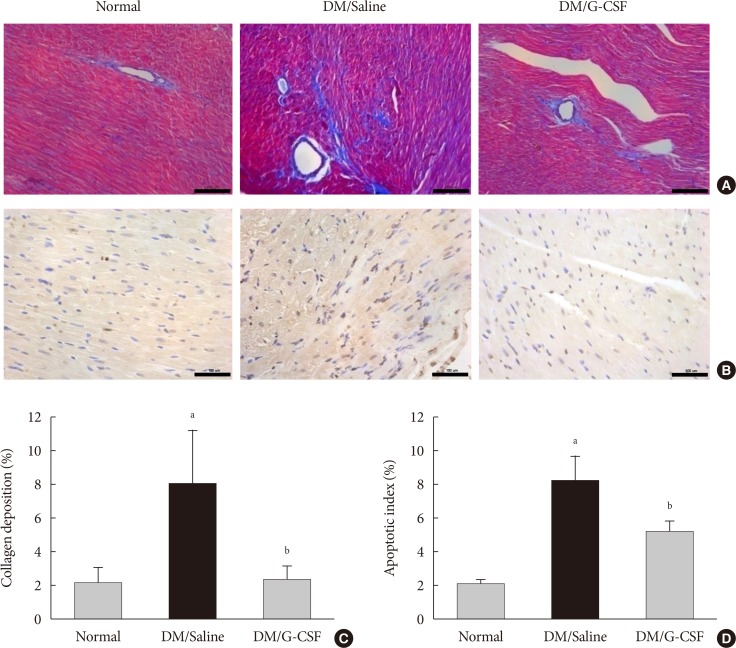
- Cardiac fibrosis resulting from collagen deposition was investigated by Masson's trichrome staining. Interstitial collagen deposition increased significantly in saline-treated rats compared with G-CSF-treated rats (7.3%±3.14% vs. 2.3%±1.45%, P<0.05) (Fig. 3A and C). G-CSF treatment significantly decreased collagen deposition on cardiomyocytes.
- Transfection of H9c2 cells with miR-34a mimic and miR-34a inhibitor
- H9c2 cells were transfected with miR-34a mimic or inhibitor to up-regulate or down-regulate the expression of miR-34a, respectively. Transfection with NC did not significantly change miR-34a level. Transfection with miR-34a mimic significantly increased miR-34a level and transfection with miR-34a inhibitor significantly decreased miR-34a level compared to transfection with NC (Supplementary Fig. 1).
- Regulation of miRNA expression by G-CSF
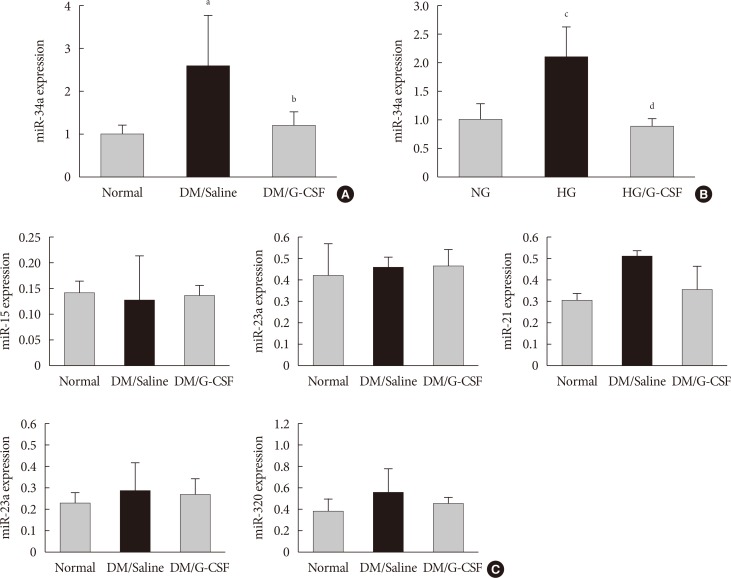
- miR-34a expression in the diabetic myocardium was significantly decreased in G-CSF-treated rats compared to saline-treated rats (Fig. 4A). In addition, miR-34a expression was significantly increased in H9c2 cells under HG condition compared to NG condition. Also, miR-34a expression were significantly decreased in G-CSF treated H9c2 cells under HG condition (Fig. 4B). However, miR-92a, miR-21, miR-320, miR-23a, and miR-15b were not significantly different in diabetic rats treated with G-CSF compared to diabetic rats treated with saline (Fig. 4C).
- Anti-apoptotic effect of G-CSF
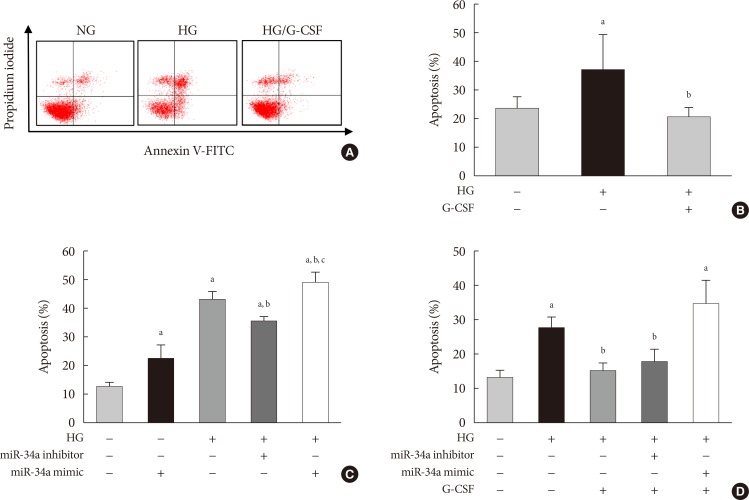
- The TUNEL assay was performed to investigate the effects of G-CSF on cardiomyocyte apoptosis in the diabetic myocardium. G-CSF treatment significantly decreased the amount of TUNEL-positive cardiomyocytes compared to saline-treated rats (25.7%±3.22% vs. 40.9%±7.23%, P<0.05) (Fig. 3B and D). Based on annexin V staining, the number of apoptotic cells was significantly increased in H9c2 cells under the HG condition compared to the NG condition (37.5%±11.7% vs. 23.3%±4.3%, P<0.05). In addition, the number of apoptotic cells was significantly decreased in G-CSF-treated H9c2 cells under HG condition compared to control H9c2 cells under HG condition (20.8%±3.0% vs. 37.5%±11.7%, P<0.05) (Fig. 5A and B).
- Anti-apoptotic effect of G-CSF on H9c2 cells is regulated by miRNA-34a
- The apoptotic effect of miR-34a on H9c2 cells under HG condition was analyzed by annexin V staining. Transfection with miR-34a mimic significantly induced cell apoptosis compared to transfection with NC in H9c2 cells under HG condition (48.55%±3.62% vs. 42.82%±2.82%, P<0.05). Transfection with miR-34a inhibitor significantly reduced cell apoptosis compared to transfection with NC in H9c2 cells under HG condition (35.20%±1.34% vs. 42.82%±2.82%, P<0.05) (Fig. 5C). G-CSF treatment did not reduce apoptosis in H9c2 cells transfected with the miR-34a mimic under HG condition. In contrast, G-CSF treatment reduced apoptosis in H9c2 cells transfected with the miR-34a inhibitor under HG condition (Fig. 5D). These data indicate that miR-34a plays an important role in induction of cardiomyocyte apoptosis.
- Expression of Bcl-2 protein as a miR-34a target gene
- The bioinformatic target prediction algorithm revealed that Bcl-2 was a predicted target gene of miR-34a. Bcl-2 protein was measured by Western blotting (Fig. 6A and B). Bcl-2 expression in the diabetic myocardium was significantly decreased in saline-treated rats compared to G-CSF-treated (12.82%±7.4% vs. 37.62%±16.7%, P<0.05). In addition, Bcl-2 expression was significantly decreased in control H9c2 cells under HG condition compared to G-CSF-treated H9c2 cells under HG condition. (42.39%±6.77% vs. 67.37%±10.06%, P<0.05). Bcl-2 expression was also significantly decreased after transfection with miR-34 mimic compared to transfection with NC in H9c2 cells under HG condition (102.21%±6.2% vs. 137.16%±18.32%, P<0.05) (Fig. 6C).
- Activity of Bcl-2 promoter
- The promoter activity of Bcl-2 was confirmed by a dual-luciferase assay (Fig. 6D). The luciferase activity of the Bcl-2 construct was significantly decreased in H9c2 cells transfected with miR-34a mimic compared to transfection with NC or miR-34a inhibitor (0.81%±0.11% vs. 1.00%±0.08% and 1.08%±0.1%, P<0.05). These results implied that miR-34a was able to bind to Bcl-2 directly and inhibit its expression.
- Expression of caspase-9 protein
- Caspase-9 protein was measured by Western blotting (Supplementary Fig. 2). Caspase-9 expression was significantly decreased in diabetic rats treated with G-CSF compared with diabetic rats treated with saline (91.40%±21.91% vs. 139.23%±17.66%).
RESULTS
- In this study, we examined the mechanism underlying the anti-apoptotic effects of G-CSF via regulation of miR-34a in a rat model of diabetic cardiomyopathy. We showed that G-CSF treatment improved diastolic dysfunction and reduced apoptosis in diabetic myocardium as well as in H9c2 cells under HG condition. Additionally, G-CSF treatment reduced miR-34a expression in diabetic myocardium and H9c2 cells under HG condition. Moreover, transfection with miR-34a induced apoptosis and decreased Bcl-2 expression in H9c2 cells under HG condition.
- Several studies have indicated that apoptosis plays a key role in the pathogenesis of various heart disease such as ischemia-reperfusion, toxic exposure, MI, atherosclerosis, and endothelial dysfunction [11827]. In addition, suppression of apoptotic cells by antioxidants or inhibitors of apoptosis-specific signaling pathways results in significant prevention of diabetic cardiomyopathy [27]. These previous studies showed a significant increase in the number of apoptotic cells in the myocardium of the diabetic cardiomyopathy rat model, suggesting that, apoptosis plays an important role in diabetic cardiomyopathy. However, the mechanism underlying the anti-apoptotic effect of G-CSF in diabetic cardiomyopathy remains unclear.
- miRNAs participate in the regulation of cardiomyocyte apoptosis, myocardial fibrosis, cardiomyocyte hypertrophy, and mitochondrial dysfunction via their target genes [28]. A recent study has shown that up-regulation of miR-195 in the diabetic heart was associated with oxidative stress, apoptosis, myocardial hypertrophy, and dysfunction [29]. Another study has demonstrated that the expression of the miR-34 family (miR-34a, miR-34b, and miR-34c) mediates the apoptotic effect after exposure to either doxorubicin or H2O2 for 24 hours in neonatal rat cardiomyocytes [30]. Recent evidence suggests that miRNAs play an important role in cardiac apoptosis [6831]. In this study, up-regulation of miR-34a expression was induced in diabetic myocardium and H9c2 cells under HG condition. Moreover, miR-34a mimic induced H9c2 cell apoptosis under HG condition. When H9c2 cells were treated with G-CSF and miR-34a mimic, the therapeutic effect of G-CSF under the HG condition was lost, suggesting that miR-34a mediated cytoprotection in diabetic cardiomyopathy may, at least partly, involve regulation of apoptosis.
- G-CSF treatment has been shown to improve cardiac function after MI by bone marrow cell mobilization and to protect cardiomyocytes from apoptotic cell death [1832]. Moreover, in a previous study, we demonstrated that G-CSF might have a cardioprotective effect in diabetic cardiomyopathy [19]. However, the mechanisms responsible for the positive effects of G-CSF treatment are not clear.
- A recent study has indicated that miR-121b is induced by G-CSF, which plays a role in promoting metastasis of colorectal cancer cells [33]. In another study, GM-CSF gel promoted wound healing in diabetic rats and induced significant differential miRNA expression in wounds [34]. Moreover, G-CSF modifies gene and miRNA expression profiles in hematopoietic progenitor cells [35], suggesting that G-CSF affects miRNA expression. In addition, our previous study suggested several potential mechanisms underlying the therapeutic effects of G-CSF in diabetic cardiomyopathy: (1) induction of bone marrow-derived cell mobilization and (2) direct effects of the G-CSF receptor-mediated signaling pathway [7]. Our data indicate that the therapeutic effects of G-CSF may be directly associated with the anti-apoptotic effects of H9c2 cells under HG conditions in vitro. Further studies are required to clarify whether G-CSF acts directly in diabetic cardiomyopathy and to explore the possibility of both receptor- and non-receptor-mediated mechanisms.
- In this study, we examined several miRNAs associated with apoptosis in diabetic cardiomyopathy. G-CSF treatment altered miR-34a expression level in the diabetic myocardium and in H9c2 cells under HG conditions; however, miR-92a, miR-21, miR-320, miR-23a, and miR-15b expression did not change. Therefore, we performed this study with a focus on miR-34a rather than other miRNAs. G-CSF has been shown to decrease miR-34a expression in diabetic myocardium and in H9c2 cells under HG condition. These effects implied that G-CSF and miR-34a expression was associated with apoptosis in the diabetes conditioned cardiomyocytes.
- miRNAs are a recently identified class of epigenetic elements consisting of small noncoding RNAs that bind to the 3'-UTR of mRNAs and down-regulate their translation to protein [36]. miRNA can modulate multiple cellular pathways [37]. There is increasing evidence indicates that miRNAs silence genes by multiple mechanisms including degrading their target mRNAs. Based on bioinformatic target prediction algorithm analyses, Bcl-2 was identified as a target for miR-34a. Bcl-2 has been shown to prevent cytochrome c release, caspase activation, and cell death. Regulation of apoptosis is dependent on the ratio of anti-apoptotic to pro-apoptotic proteins [38]. In this study, we have confirmed that anti-apoptotic Bcl-2 protein is reduced by increasing miR-34a expression in H9c2 cells under HG condition. In addition, Bcl-2 expression was increased by transfecting miR-34a inhibitor. Moreover, luciferase activity of Bcl-2 was decreased by transfecting miR-34a mimic. These data indicate that Bcl-2 was silenced by miR-34a at the protein level.
- This study had several limitations. First, although our data showed that G-CSF reduced miR-34a expression, we only confirmed certain miRNAs to be associated with apoptosis. Further study should confirm the miRNAs by screening tests. Second, we could not establish up-regulation and down-regulation of miRNA-34a in the diabetic myocardium, and this will require further in vivo experimentation. Futhermore, we were unable to demonstrate the rationale of miR-34a under hyperglycemic conditions or determine a definitive mechanism of the G-CSF-related decrease in miR-34a expression. Thus further studies are needed to investigate these questions. Third, we could not investigate the detailed mechanisms of action of G-CSF directly or through the G-CSF receptor-mediated signaling pathway, mobilization or homing of bone marrow stem cells, or other paracrine effects; such as fibrosis, vascularization, oxidative stress, or endoplasmic reticulum stress. Fourth, we did not establish the optimum dosage range of G-CSF. Further investigations are needed regarding the appropriate dose of G-CSF for diabetic cardiomyopathy. Finally, the number of animals included in the present study was small; therefore, future studies involving a larger number of animals are warranted.
- In conclusion, G-CSF reduced apoptosis of myocardium in a rat model of diabetic cardiomyopathy and in H9c2 cells under HG condition. These effects might be mediated by miR-34a. G-CSF induced down-regulation of miR-34a expression and up-regulation of Bcl-2 protein expression in diabetic myocardium and H9c2 cells under HG condition (Supplementary Fig. 3). This is the first study to show that the anti-apoptotic effects of G-CSF in a rat model of diabetic cardiomyopathy are mediated by reduced expression of miR-34a. Our findings suggest that G-CSF is a novel therapeutic drug in patients with diabetic cardiomyopathy.
DISCUSSION
-
Acknowledgements
- This research was supported by Basic Science Research Program through the National Research Foundation of Korea (NRF) funded by the Ministry of Education (2015R1D1A1A02062008 and 2016R1D1A1B03931479).
ACKNOWLEDGMENTS
-
CONFLICTS OF INTEREST: No potential conflict of interest relevant to this article was reported.
-
AUTHOR CONTRIBUTIONS:
NOTES
SUPPLEMENTARY MATERIALS
Supplementary Fig. 1
Supplementary Fig. 2
Supplementary Fig. 3
- 1. Bugger H, Abel ED. Rodent models of diabetic cardiomyopathy. Dis Model Mech 2009;2:454-466. ArticlePubMedPDF
- 2. Cai L, Li W, Wang G, Guo L, Jiang Y, Kang YJ. Hyperglycemia-induced apoptosis in mouse myocardium: mitochondrial cytochrome C-mediated caspase-3 activation pathway. Diabetes 2002;51:1938-1948. PubMed
- 3. Zhou Q, Lv D, Chen P, Xu T, Fu S, Li J, Bei Y. MicroRNAs in diabetic cardiomyopathy and clinical perspectives. Front Genet 2014;5:185ArticlePubMedPMC
- 4. Cheng Y, Liu X, Zhang S, Lin Y, Yang J, Zhang C. MicroRNA-21 protects against the H(2)O(2)-induced injury on cardiac myocytes via its target gene PDCD4. J Mol Cell Cardiol 2009;47:5-14. ArticlePubMedPMC
- 5. Liu Z, Ye P, Wang S, Wu J, Sun Y, Zhang A, Ren L, Cheng C, Huang X, Wang K, Deng P, Wu C, Yue Z, Xia J. MicroRNA-150 protects the heart from injury by inhibiting monocyte accumulation in a mouse model of acute myocardial infarction. Circ Cardiovasc Genet 2015;8:11-20. ArticlePubMed
- 6. Zhu K, Liu D, Lai H, Li J, Wang C. Developing miRNA therapeutics for cardiac repair in ischemic heart disease. J Thorac Dis 2016;8:E918-E927. ArticlePubMedPMC
- 7. Tang Y, Zheng J, Sun Y, Wu Z, Liu Z, Huang G. MicroRNA-1 regulates cardiomyocyte apoptosis by targeting Bcl-2. Int Heart J 2009;50:377-387. ArticlePubMed
- 8. Flemming A. Heart failure: targeting miRNA pathology in heart disease. Nat Rev Drug Discov 2014;13:336ArticlePubMedPDF
- 9. Liu L, Zhang G, Liang Z, Liu X, Li T, Fan J, Bai J, Wang Y. MicroRNA-15b enhances hypoxia/reoxygenation-induced apoptosis of cardiomyocytes via a mitochondrial apoptotic pathway. Apoptosis 2014;19:19-29. ArticlePubMedPDF
- 10. Mao J, Lv Z, Zhuang Y. MicroRNA-23a is involved in tumor necrosis factor-α induced apoptosis in mesenchymal stem cells and myocardial infarction. Exp Mol Pathol 2014;97:23-30. ArticlePubMed
- 11. Song CL, Liu B, Diao HY, Shi YF, Zhang JC, Li YX, Liu N, Yu YP, Wang G, Wang JP, Li Q. Down-regulation of microRNA-320 suppresses cardiomyocyte apoptosis and protects against myocardial ischemia and reperfusion injury by targeting IGF-1. Oncotarget 2016;7:39740-39757. ArticlePubMedPMC
- 12. Xie Q, Zhao C, Ye Z, Yang F, Ruan Q, Xie W. Effects of microRNA-21 on the myocardial cell apoptosis induced by ischemia and hypoxia in rat. Zhonghua Shao Shang Za Zhi 2014;30:153-157. PubMed
- 13. Zhang B, Zhou M, Li C, Zhou J, Li H, Zhu D, Wang Z, Chen A, Zhao Q. MicroRNA-92a inhibition attenuates hypoxia/reoxygenation-induced myocardiocyte apoptosis by targeting Smad7. PLoS One 2014;9:e100298. ArticlePubMedPMC
- 14. Zhao F, Li B, Wei YZ, Zhou B, Wang H, Chen M, Gan XD, Wang ZH, Xiong SX. MicroRNA-34a regulates high glucose-induced apoptosis in H9c2 cardiomyocytes. J Huazhong Univ Sci Technolog Med Sci 2013;33:834-839. ArticlePubMedPDF
- 15. Demetri GD, Griffin JD. Granulocyte colony-stimulating factor and its receptor. Blood 1991;78:2791-2808. ArticlePubMedPDF
- 16. Harada M, Qin Y, Takano H, Minamino T, Zou Y, Toko H, Ohtsuka M, Matsuura K, Sano M, Nishi J, Iwanaga K, Akazawa H, Kunieda T, Zhu W, Hasegawa H, Kunisada K, Nagai T, Nakaya H, Yamauchi-Takihara K, Komuro I. G-CSF prevents cardiac remodeling after myocardial infarction by activating the Jak-Stat pathway in cardiomyocytes. Nat Med 2005;11:305-311. ArticlePubMedPDF
- 17. Huttmann A, Duhrsen U, Stypmann J, Noppeney R, Nuckel H, Neumann T, Gutersohn A, Nikol S, Erbel R. Granulocyte colony-stimulating factor-induced blood stem cell mobilisation in patients with chronic heart failure: feasibility, safety and effects on exercise tolerance and cardiac function. Basic Res Cardiol 2006;101:78-86. ArticlePubMedPDF
- 18. Lim YH, Joe JH, Jang KS, Song YS, So BI, Fang CH, Shin J, Kim JH, Lim HK, Kim KS. Effects of granulocyte-colony stimulating factor (G-CSF) on diabetic cardiomyopathy in Otsuka Long-Evans Tokushima fatty rats. Cardiovasc Diabetol 2011;10:92ArticlePubMedPMCPDF
- 19. Shin JH, Lim YH, Song YS, So BI, Park JY, Fang CH, Lee Y, Kim H, Kim KS. Granulocyte-colony stimulating factor reduces cardiomyocyte apoptosis and ameliorates diastolic dysfunction in Otsuka Long-Evans Tokushima Fatty rats. Cardiovasc Drugs Ther 2014;28:211-220. ArticlePubMedPDF
- 20. Srinivasan K, Viswanad B, Asrat L, Kaul CL, Ramarao P. Combination of high-fat diet-fed and low-dose streptozotocin-treated rat: a model for type 2 diabetes and pharmacological screening. Pharmacol Res 2005;52:313-320. ArticlePubMed
- 21. Sugano M, Yamato H, Hayashi T, Ochiai H, Kakuchi J, Goto S, Nishijima F, Iino N, Kazama JJ, Takeuchi T, Mokuda O, Ishikawa T, Okazaki R. High-fat diet in low-dose-streptozotocin-treated heminephrectomized rats induces all features of human type 2 diabetic nephropathy: a new rat model of diabetic nephropathy. Nutr Metab Cardiovasc Dis 2006;16:477-484. ArticlePubMed
- 22. Kilkenny C, Browne WJ, Cuthill IC, Emerson M, Altman DG. Improving bioscience research reporting: the ARRIVE guidelines for reporting animal research. J Pharmacol Pharmacother 2010;1:94-99. ArticlePubMedPMC
- 23. Hu M, Ye P, Liao H, Chen M, Yang F. Metformin protects H9C2 cardiomyocytes from high-glucose and hypoxia/reoxygenation injury via inhibition of reactive oxygen species generation and inflammatory responses: role of AMPK and JNK. J Diabetes Res 2016;2016:2961954. ArticlePubMedPMCPDF
- 24. Song YS, Fang CH, So BI, Park JY, Lee Y, Shin JH, Jun DW, Kim H, Kim KS. Time course of the development of nonalcoholic fatty liver disease in the Otsuka Long-Evans Tokushima fatty rat. Gastroenterol Res Pract 2013;2013:342648. ArticlePubMedPMCPDF
- 25. Lee KM, Kang HA, Park M, Lee HY, Choi HR, Yun CH, Oh JW, Kang HS. Interleukin-24 attenuates β-glycerophosphate-induced calcification of vascular smooth muscle cells by inhibiting apoptosis, the expression of calcification and osteoblastic markers, and the Wnt/β-catenin pathway. Biochem Biophys Res Commun 2012;428:50-55. ArticlePubMed
- 26. Song YS, Fang CH, So BI, Park JY, Jun DW, Kim KS. Therapeutic effects of granulocyte-colony stimulating factor on non-alcoholic hepatic steatosis in the rat. Ann Hepatol 2013;12:115-122. ArticlePubMed
- 27. Cai L, Kang YJ. Cell death and diabetic cardiomyopathy. Cardiovasc Toxicol 2003;3:219-228. ArticlePubMed
- 28. Liu X, Liu S. Role of microRNAs in the pathogenesis of diabetic cardiomyopathy. Biomed Rep 2017;6:140-145. ArticlePubMedPMC
- 29. Zheng D, Ma J, Yu Y, Li M, Ni R, Wang G, Chen R, Li J, Fan GC, Lacefield JC, Peng T. Silencing of miR-195 reduces diabetic cardiomyopathy in C57BL/6 mice. Diabetologia 2015;58:1949-1958. ArticlePubMedPMCPDF
- 30. Pinti MV, Hathaway QA, Hollander JM. Role of microRNA in metabolic shift during heart failure. Am J Physiol Heart Circ Physiol 2017;312:H33-H45. ArticlePubMed
- 31. Liu X, Tong Z, Chen K, Hu X, Jin H, Hou M. The role of miRNA-132 against apoptosis and oxidative stress in heart failure. Biomed Res Int 2018;2018:3452748. ArticlePubMedPMCPDF
- 32. Deindl E, Zaruba MM, Brunner S, Huber B, Mehl U, Assmann G, Hoefer IE, Mueller-Hoecker J, Franz WM. G-CSF administration after myocardial infarction in mice attenuates late ischemic cardiomyopathy by enhanced arteriogenesis. FASEB J 2006;20:956-958. ArticlePubMedPDF
- 33. Zhang X, Ma X, An H, Xu C, Cao W, Yuan W, Ma J. Upregulation of microRNA-125b by G-CSF promotes metastasis in colorectal cancer. Oncotarget 2017;8:50642-50654. ArticlePubMedPMC
- 34. Liu Y, Liu D, Guo G, Mao Y, Wang X. Effects of recombinant human granulocyte-macrophage colony-stimulating factor on wound healing and microRNA expression in diabetic rats. Zhonghua Shao Shang Za Zhi 2014;30:243-250. PubMed
- 35. Baez A, Martin-Antonio B, Piruat JI, Prats C, Alvarez-Laderas I, Barbado MV, Carmona M, Urbano-Ispizua A, Perez-Simon JA. Granulocyte colony-stimulating factor produces long-term changes in gene and microRNA expression profiles in CD34+ cells from healthy donors. Haematologica 2014;99:243-251. ArticlePubMedPMC
- 36. van Rooij E, Olson EN. MicroRNAs: powerful new regulators of heart disease and provocative therapeutic targets. J Clin Invest 2007;117:2369-2376. ArticlePubMedPMC
- 37. Ji Q, Hao X, Zhang M, Tang W, Yang M, Li L, Xiang D, Desano JT, Bommer GT, Fan D, Fearon ER, Lawrence TS, Xu L. MicroRNA miR-34 inhibits human pancreatic cancer tumor-initiating cells. PLoS One 2009;4:e6816. ArticlePubMedPMC
- 38. Chen Z, Chua CC, Ho YS, Hamdy RC, Chua BH. Overexpression of Bcl-2 attenuates apoptosis and protects against myocardial I/R injury in transgenic mice. Am J Physiol Heart Circ Physiol 2001;280:H2313-H2320. ArticlePubMed
REFERENCES
Experimental protocol. Normal rats (n=8) were fed a standard diet and diabetic rats (n=15) were fed with a high-fat diet for 7 weeks. At 13 weeks of age, the diabetic rats were intraperitoneally injected with streptozotocin (STZ; 30 mg/kg). At 14 weeks of age, diabetic rats were randomly allocated to treatment with either saline (200 µg/kg/day, n=7) or granulocyte-colony stimulating factor (G-CSF; 200 µg/kg/day, n=8). Functional and histological analysis were performed at 14 and 18 weeks.

Effects of granulocyte-colony stimulating factor (G-CSF) on cardiac function. (A) Left ventricular ejection fraction (LVEF). (B) Peak velocity of the early diastolic filling wave (E velocity). (C) Early mitral annulus velocity during the diastolic phase (E' velocity). (D) the ratio of mitral peak velocity of early filling (E) to early diastolic mitral annular velocity (E'). DM, diabetic rat model. aP<0.05 vs. normal, bP<0.05 vs. DM/G-CSF.

Granulocyte-colony stimulating factor (G-CSF) improves fibrosis and apoptosis in a rat model of diabetic cardiomyopathy. (A) Representative images of Masson's trichrome (MT) staining of heart tissue at 4 weeks after treatment in each group (×200). (B) Representative photomicrographs showing terminal deoxynucleotidyl transferase dUTP nick end labeling (TUNEL) assay staining in the myocardium at 4 weeks after treatment in each group (×200). Scale bar=100 µm. (C) Results of quantitative analysis of collagen area as a ratio of fibrotic area to heart area. (D) Results of quantitative analysis of apoptotic cells. All data are expressed as mean±standard error (n=8 per group). DM, diabetic rat model. aP<0.05 vs. normal, bP<0.05 vs. DM/saline.
Granulocyte-colony stimulating factor (G-CSF) regulates cardiac microRNAs (miRNAs) in diabetic myocardium and H9c2 cells under high glucose (HG) condition. miRNA expression was measured in myocardium and H9c2 cells by real-time polymerase chain reaction using TaqMan (Applied BioSystems) probes after treatment. (A) miR-34a expression of myocardium at 4 weeks after treatment. miR-34a expression was significantly decreased in G-CSF treated rats compared to saline treated rats. All data are expressed as mean±standard deviation. (B) miR-34a expression of H9c2 cells after treatment. miR-34a expression was significantly decreased in G-CSF treated H9c2 cells under HG condition. All data are expressed as mean±standard deviation. (C) Expression of candidate miRNAs was measured in the myocardium. miR-15, miR-23a, miR-21, miR-23a, and miR-320 expression was not different after treatment with G-CSF. DM, diabetic rat model; NG, normal glucose; HG, high glucose. aP<0.05 vs. normal, bP<0.05 vs. DM/saline, cP<0.05 vs. NG, dP<0.05 vs. HG.

Anti-apoptotic effect of granulocyte-colony stimulating factor (G-CSF) on H9c2 cells can be mediated by miR-34a mimic or miR-34a inhibitor under high glucose (HG) condition. The apoptosis rate was measured by flow cytometry using annexin V/PI staining. (A, B) Flow cytometric analysis of H9c2 cell apoptosis. Apoptotic cells were significantly decreased in G-CSF treated H9c2 cells under HG condition. (C, D) Quantitative flow cytometry of H9c2 cells treated with HG and G-CSF and transfected with miR-34a inhibitor or miR-34a mimic. G-CSF treatment did not reduce apoptosis when cells were transfected with miR-34a mimic. All data were expressed as mean±standard error of the mean (n=5 per group). NG, normal glucose; FITC, fluorescein isothiocyanate. aP<0.05 vs. NG group, bP<0.05 vs. HG group, cP<0.05 vs. miR-34a inhibitor group.

B-cell lymphoma 2 (Bcl-2) is directly targeted by miR 34a. TargetScan software was used to predict the potential miR 34a binding site in the 3'-untranslated region (3'-UTR) of Bcl-2. (A, B) Representative Western blot analysis and quantitative analysis demonstrated that Bcl-2 protein levels was decreased in diabetic myocardium and H9c2 cells under high glucose (HG) condition. Glyceraldehyde 3 phosphate dehydrogenase (GAPDH) was used as the control. (C) Representative Western blot analysis and quantitative analysis demonstrated that Bcl-2 protein levels was decreased by transfection with miR-34a mimic in H9c2 cells. GAPDH was used as the control. (D) Predicted pairing of target region (top) and miR-34a-5p (bottom). Dual luciferase assays were used to detect luciferase activity. Cells were co-transfected with pGL4-Bcl2-3'-UTR firefly luciferase expression construct and pRL-TK Renilla luciferase expression construct together with either miR-34 inhibitor or miR-34a mimic. All data are expressed as mean±standard deviation. DM, diabetic rat model; G-CSF, granulocyte-colony stimulating factor; NG, normal glucose. aP<0.05 vs. normal or NG, bP<0.05 vs. DM/saline or HG, cP<0.05 vs. negative control, dP<0.05 vs. negative control, eP<0.05 vs. miR-34a mimic.
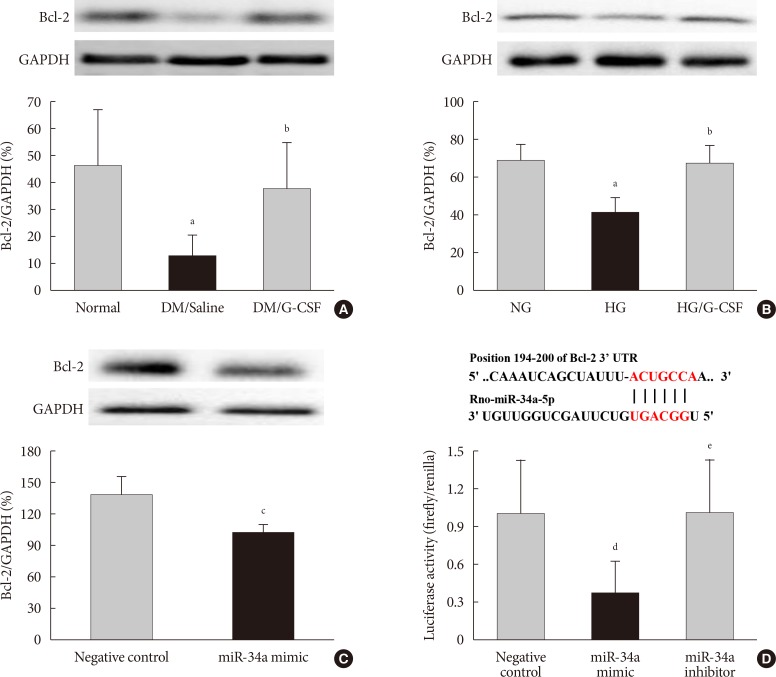
Figure & Data
References
Citations
- The study of the mechanism of non-coding RNA regulation of programmed cell death in diabetic cardiomyopathy
Bingrui Zhang, Hua Wu, Jingwen Zhang, Cong Cong, Lin Zhang
Molecular and Cellular Biochemistry.2024;[Epub] CrossRef - Non-coding RNAs in the pathophysiology of heart failure with preserved ejection fraction
Elisabeth A. Jalink, Amber W. Schonk, Reinier A. Boon, Rio P. Juni
Frontiers in Cardiovascular Medicine.2024;[Epub] CrossRef - Dynamic interplay of microRNA in diseases and therapeutic
Neha Kargutkar, Priya Hariharan, Anita Nadkarni
Clinical Genetics.2023; 103(3): 268. CrossRef - LGR5+ Intestinal Stem Cells Display Sex-Dependent Radiosensitivity
Ryan C. Zitter, Rishi Man Chugh, Payel Bhanja, Bruce F. Kimler, Subhrajit Saha
Cells.2023; 13(1): 46. CrossRef - Female Mice are More Resistant to the Mixed-Field (67% Neutron + 33% Gamma) Radiation-Induced Injury in Bone Marrow and Small Intestine than Male Mice due to Sustained Increases in G-CSF and the Bcl-2/Bax Ratio and Lower miR-34a and MAPK Activation
Juliann G. Kiang, Georgetta Cannon, Matthew G. Olson, Joan T. Smith, Marsha N. Anderson, Min Zhai, M. Victoria Umali, Kevin Ho, Connie Ho, Wanchang Cui, Mang Xiao
Radiation Research.2022;[Epub] CrossRef - Potential Role of Natural Plant Medicine Cyclocarya paliurus in the Treatment of Type 2 Diabetes Mellitus
Han Wang, Cheng Tang, Zezheng Gao, Yishan Huang, Boxun Zhang, Jiahua Wei, Linhua Zhao, Xiaolin Tong, Yong Xu
Journal of Diabetes Research.2021; 2021: 1. CrossRef - Ghrelin, a novel therapy, corrects cytokine and NF-κB-AKT-MAPK network and mitigates intestinal injury induced by combined radiation and skin-wound trauma
Juliann G. Kiang, Joan T. Smith, Georgetta Cannon, Marsha N. Anderson, Connie Ho, Min Zhai, Wanchang Cui, Mang Xiao
Cell & Bioscience.2020;[Epub] CrossRef - Evaluation of biomarkers in liver following Solanum melongena green calyx administration in diabetic rats
Shiva Roshankhah, Ahmad Shabanizadeh, Amir Abdolmaleki, Mohammad Reza Gholami, Mohammad Reza Salahshoor
Journal of Diabetes & Metabolic Disorders.2020; 19(2): 1115. CrossRef - Diabetic cardiomyopathy: definition, diagnosis criteria, treatment directions and prevention of heart failure
N. A. Koziolova, P. G. Karavaev, A. S. Veklich
South Russian Journal of Therapeutic Practice.2020; 1(2): 93. CrossRef - The Potential Role of MicroRNA in Diabetic Cardiomyopathy
Jin Hwa Kim
Diabetes & Metabolism Journal.2020; 44(1): 54. CrossRef
 PubReader
 Cite
Cite