
- Current
- Browse
- Collections
-
For contributors
- For Authors
- Instructions to authors
- Article processing charge
- e-submission
- For Reviewers
- Instructions for reviewers
- How to become a reviewer
- Best reviewers
- For Readers
- Readership
- Subscription
- Permission guidelines
- About
- Editorial policy
Articles
- Page Path
- HOME > Diabetes Metab J > Volume 44(1); 2020 > Article
-
Original ArticleClinical Complications Hypoglycemia and Dementia Risk in Older Patients with Type 2 Diabetes Mellitus: A Propensity-Score Matched Analysis of a Population-Based Cohort Study
-
Young-Gun Kim1,2
 , Dong Gyu Park3, So Young Moon4, Ja Young Jeon5, Hae Jin Kim5, Dae Jung Kim5, Kwan-Woo Lee5, Seung Jin Han5
 -
Diabetes & Metabolism Journal 2020;44(1):125-133.
DOI: https://doi.org/10.4093/dmj.2018.0260
Published online: October 23, 2019
1Department of Medical Sciences, Ajou University Graduate School, Suwon, Korea.
2Ministry of Health and Welfare, Gyeonggi Provincial Government, Suwon, Korea.
3Department of Neurology, Yeongwolgun Public Health Center, Yeongwol, Korea.
4Department of Neurology, Ajou University School of Medicine, Suwon, Korea.
5Department of Endocrinology and Metabolism, Ajou University School of Medicine, Suwon, Korea.
- Corresponding author: Seung Jin Han. Department of Endocrinology and Metabolism, Ajou University School of Medicine, 164 World cup-ro, Yeongtong-gu, Suwon 16499, Korea. hsj@ajou.ac.kr
- *Young-Gun Kim and Dong Gyu Park contributed equally to this study as first authors.
Copyright © 2020 Korean Diabetes Association
This is an Open Access article distributed under the terms of the Creative Commons Attribution Non-Commercial License (http://creativecommons.org/licenses/by-nc/4.0/) which permits unrestricted non-commercial use, distribution, and reproduction in any medium, provided the original work is properly cited.
ABSTRACT
-
Background
- Type 2 diabetes mellitus (T2DM) is associated with an increased risk for dementia. The effects of hypoglycemia on dementia are controversial. Thus, we evaluated whether hypoglycemia increases the risk for dementia in senior patients with T2DM.
-
Methods
- We used the Korean National Health Insurance Service Senior cohort, which includes >10% of the entire senior population of South Korea. In total, 5,966 patients who had ever experienced at least one episode of hypoglycemia were matched with those who had not, using propensity score matching. The risk of dementia was assessed through a survival analysis of matched pairs.
-
Results
- Patients with underlying hypoglycemic events had an increased risk for all-cause dementia, Alzheimer's dementia (AD), and vascular dementia (VaD) compared with those who had not experienced a hypoglycemic event (hazard ratio [HR], 1.254; 95% confidence interval [CI], 1.166 to 1.349; P<0.001 for all-cause dementia; HR, 1.264; 95% CI, 1.162 to 1.375; P<0.001 for AD; HR, 1.286; 95% CI, 1.110 to 1.490; P<0.001 for VaD). According to number of hypoglycemic episodes, the HRs of dementia were 1.170, 1.201, and 1.358 in patients with one hypoglycemic episode, two or three episodes, and more than three episodes, respectively. In the subgroup analysis, hypoglycemia was associated with an increased risk for dementia in both sexes with or without T2DM microvascular or macrovascular complications.
-
Conclusion
- Our findings suggest that patients with a history of hypoglycemia have a higher risk for dementia. This trend was similar for AD and VaD, the two most important subtypes of dementia.
- Type 2 diabetes mellitus (T2DM) is associated with a 1.5 to 2.5-fold increased risk for dementia, and this trend is similar for both Alzheimer's disease (AD) and vascular dementia (VaD), which are the most common subtypes of dementia [12]. With the increasing numbers of elderly people with T2DM in the general population, dementia is especially important due to its impact on self-management and quality of life. Therefore, identifying modifiable risk factors for dementia is crucial to public health. The mechanisms underlying the association between T2DM and dementia are not fully understood, but they are multifactorial, including poor glucose control, hypoglycemia, inflammatory mediators, and rheological factors [3].
- Hypoglycemia is a potentially serious complication during diabetes treatment and it may be an obstacle to optimal glycemic control. As glucose is the primary source of energy for the brain, hypoglycemia may cause mild or severe neurological deficits, including coma [45]. Although the short-term effects of hypoglycemia on cognitive function have been well documented, it is unclear whether patients with hypoglycemia will develop dementia. A few epidemiological studies have shown that severe hypoglycemia is associated with a greater risk for dementia [6789], but others have reported no significant association between hypoglycemia and subsequent dementia [1011]. In addition, because the pathogeneses of AD and VaD are very different, the same hypoglycemic assault may have different effects on the progression of dementia according to subtype. However, previous studies have not estimated dementia risk according to dementia subtype.
- Therefore, the purpose of the current study was to investigate the association between hypoglycemia and subsequent dementia in older adults with T2DM by conducting a propensity score matching analysis to minimize selection bias. We also identified the effect of hypoglycemia on dementia according to each subtype. We used the Korean National Health Insurance Service Senior cohort, which contains 14 years of follow-up data for >10% of all older adults in South Korea.
INTRODUCTION
- Study design and data source
- This study was a population-based retrospective observational study and was approved by the Institutional Review Board of the Korea National Institute for Bioethics Policy (http://www.irb.or.kr/, P01-201811-21-008), which waived the requirement for informed consent because all patient data were de-identified.
- Data source
- We used the Korean National Health Insurance Service Senior cohort version 3.0 (January 1, 2002 to December 31, 2015), which contains around 550,000 patients (>10% of the entire South Korea senior population in 2002). This dataset was extracted from the Korean National Health Insurance Service, which covers over 99% of the South Korean population, using a stratified random sampling method with 1,476 strata; thus, it is representative of the entire Korean senior population. This data set included information on the socioeconomic status of Korean National Health Insurance Service recipients; status was based on income and assets, such as property and automobile ownership.
- Inclusion and exclusion criteria
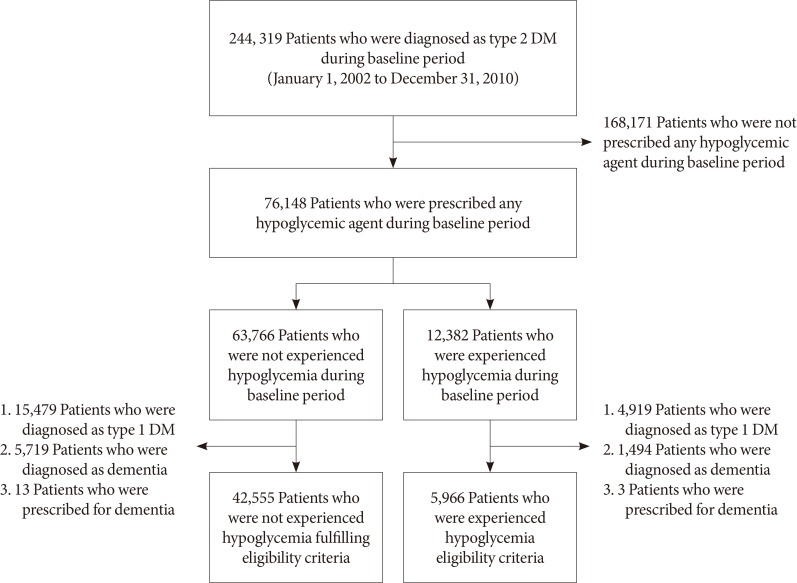
- Patients diagnosed with T2DM and prescribed oral hypoglycemic agents or insulin were enrolled (Fig. 1). The index date was January 1, 2011, and patients were divided into two groups according to the presence of hypoglycemia (International Classification of Diseases, 10th revision [ICD-10] codes E11.63, E15, E16.0, E16.1, and E16.2) before the index date. Patients who experienced at least one hypoglycemic episode were placed in the hypoglycemia group, which was then divided into three groups according to the number of hypoglycemic episodes (one episode, two or three episodes, or more than three episodes). Patients with type 1 diabetes mellitus (T1DM; ICD-10 code E10) or dementia diagnoses (ICD-10 codes F00, F01, F02, F03, F04, F05, G30, or G31) or a medication prescribed to treat dementia (donepezil, memantin, rivastigmine, or galantamine) before the index date (January 1, 2002 to December 31, 2010) were excluded. The loss of samples is described in Fig. 1. Because the Korean National Health Insurance Service Senior cohort consists of patients ≥60 years old in 2002, all patients were >68 years of age on the index date.
- Study outcome and subgroup analysis
- The primary outcome was the first diagnosis of all-cause dementia (ICD-10 codes F00, F01, F02, F03, F04, F05, G30, or G31). The secondary outcome was the first diagnosis of AD (F00, G30) or VaD (F01). Additionally, we assessed differences in the risk of dementia according to the number of hypoglycemic episodes by dividing the sample into three groups. Subgroup analyses were performed according to sex, age (<75 and ≥75 years), and the presence of T2DM microvascular (any diagnosis of diabetic nephropathy, neuropathy, or retinopathy) or macrovascular complications (any diagnosis of stroke, transient ischemic attack, acute myocardial infarction, other ischemic heart disease, and peripheral artery occlusive disease).
- Statistical analysis
- All statistical analyses were performed using R software version 3.3.3 (R Development Core Team, Vienna, Austria) and SAS version 9.4 (SAS Institute, Cary, NC, USA). All values are presented as mean±standard deviation. The differences between patients with and without an underlying hypoglycemic event were adjusted with propensity score matching using the nearest-neighbor technique with a caliper of 0.1 on the probability scale. We set age, sex, socioeconomic status (index date), diagnoses (1 year before the index date), and prescribed drugs (180 days before the index date) as confounding variables (all variables presented in Table 1) and those were used to calculate propensity scores. The balance achieved by matching propensity scores was assessed using standardized differences, t-tests (age), chi-square tests (all other variables except age and socioeconomic status), and Mantel-Haenszel chi-square tests (socioeconomic status); an absolute standardized difference between groups <0.1 was considered negligible. After the propensity score matching, a Kaplan-Meier curve and Cox proportional hazards model were used to evaluate the dementia risk of hypoglycemia. Because all confounding variables were adjusted in propensity score matching, 1 minus Kaplan-Meier estimate, and a univariate Cox regression analysis were performed.
METHODS
- In total, 48,521 patients were included in the cohort and 220,385 person-years were considered. After propensity score matching, 5,966 patients comprised both groups. The baseline characteristics of the matched group are presented in Table 1; all absolute values of standardized differences were <0.1; thus, all confounding variables were considered properly adjusted by propensity score matching. The mean follow-up period of the matched pairs was 1,591.1 days.
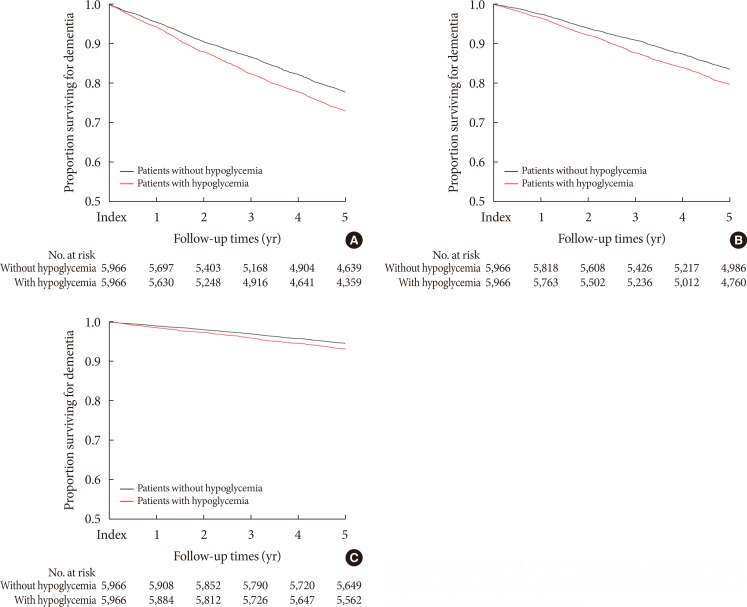
- During the study period, 2,934 patients were newly diagnosed with dementia. The patients with at least one hypoglycemia episode showed an increased risk of all-cause dementia compared with those without hypoglycemia (hazard ratio [HR], 1.254; 95% confidence interval [CI], 1.166 to 1.349; P<0.001) (Table 2, Fig. 2). Patients with underlying hypoglycemia were prone to AD and VaD (HR, 1.264; 95% CI, 1.162 to 1.375, P<0.001 for AD; and HR, 1.286; 95% CI, 1.110 to 1.490; P<0.001 for VaD) (Table 2, Fig. 2).
- According to number of hypoglycemic episodes, the HRs of dementia were 1.170, 1.201, and 1.358 in patients with one hypoglycemic episode, two or three episodes, and more than three episodes, respectively (Table 3).
- In the subgroup analysis, patients were divided according to sex, age, or the presence of T2DM microvascular or macrovascular complications. Patients who experienced hypoglycemia showed an increased risk for dementia in all subgroups (Table 4).
RESULTS
- This population-based retrospective cohort study showed that patients with a history of hypoglycemia had a higher risk of dementia using the propensity score matching method with large cohort data. This association was persistent in both the AD and VaD subtypes. Patients who experienced repeated episodes of hypoglycemia had a higher risk of dementia. In the subgroup analysis, hypoglycemia increased the risk for dementia in both sexes with or without T2DM microvascular and macrovascular complications.
- This is the first cohort study using the propensity score matching method to minimize selection bias. In addition, this is the first study to estimate dementia risk of hypoglycemia according to the specific dementia subtype. Our study included the largest number of patients who have ever experienced hypoglycemia compared with previous studies.
- Our study showed that hypoglycemia increased the risk of dementia by 25.4%, which conflicts with some previous studies. The Fremantle Diabetes Study found no evidence that hypoglycemia contributes to cognitive impairment in older adults with T2DM who had normal cognition at baseline [10]. However, the small sample size and relatively short follow-up duration may have limited the power to detect differences. In the Diabetes Control and Complication Trial on younger adults with T1DM, 40% of the patients experienced at least one hypoglycemic coma or seizure but did not decline cognitively [11]. Although this cohort was followed for 18 years, the mean age of the enrolled patients was 27 years, which was too young to show cognitive impairment. The same assault of hypoglycemia may have different impacts according to the age of the subject population, as levels of hippocampal neurogenesis steadily decrease with age [12]. The conflicting results may be due to differences in the demographics of the study populations.
- Consistent with our results, three retrospective studies showed that at least one hypoglycemic episode increases the risk of dementia [679]. Additionally, repeated episodes of hypoglycemia were correlated with a higher risk of dementia [69]. Lin and Sheu [7] showed an increased risk of dementia in subjects with a history of hypoglycemia. However, they adjusted only for age, sex, insulin use, and five comorbidities, and included only 289 patients who had had at least one hypoglycemic episode, which is a relatively small sample size [7]. Another retrospective cohort study using the Kaiser Permanente Northern California Diabetes Registry of around 17,000 patients, with a mean age of 65 years, who were followed for 27 years, showed that one, two, and three or more episodes of hypoglycemia increased the risk of dementia, with HRs of 1.26, 1.80, and 1.94, respectively [6]. However, this cohort involved only approximately 1,500 patients with a hypoglycemic experience and did not control for either economic status, which is among the important risk factors for dementia, or medication use, including class of oral hypoglycemic agent or statins, which can affect dementia [131415161718]. The third study, using the Clinical Practice Research Datalink (CPRD), which contains the medical records from 674 general practices in the United Kingdom, showed that hypoglycemia is associated with a higher risk of dementia [9]. Furthermore, the risk of dementia increased with the number of hypoglycemia episodes. However, CPRD is collected from general practice and may be biased relative to our data, which was collected from a primary hospital to a tertiary hospital, and this study also did not compensate for socioeconomic status, or medication use, such as each oral hypoglycemic agent class or statins. Compared to all of these previous studies using Cox proportional hazards models that compensated for insufficient confounding factors and included small numbers of patients with hypoglycemia, we used the propensity score matching method and more than 40 confounding variables, including socioeconomic status, oral hypoglycemic agent class, statin use, and many underlying diseases, and included the largest number of patients with hypoglycemia.
- Several possible mechanisms have been suggested from animal studies for how hypoglycemia can cause dementia. Multiple animal and human magnetic resonance imaging studies have reported that severe hypoglycemia with coma can lead to selective neuronal cell death in vulnerable brain regions, such as the cortex and hippocampus [19]. This can lead to a decline in memory. In a rat model, significant learning and memory deficits were identified with behavioral testing 6 weeks after inducing 30 minutes of EEG isoelectricity with severe hypoglycemia, which could be attributed to neuronal death observed in the hippocampus of these animals [20]. In another animal study, prolonged moderate hypoglycemia without coma also caused neuronal damage in the prefrontal medial cortex, piriform cortex, and orbital cortex in rats [21].
- Other explanations related to vascular and AD pathology are plausible. Increased adrenaline levels during hypoglycemic events enhance platelet and leucocyte activities, and increase the formation of fibrinogen [2223]. Endothelial function may also be compromised during a hypoglycemic attack [24]. All of these factors contribute to micro- or macro-infarcts in the brain, causing vascular cognitive decline. Several studies have shown a possible link between hypoglycemia and AD pathology. In a study with rat primary cortical astroglial cells, hypoglycemia enhanced the expression of mRNA encoding the β-amyloid precursor protein. In a study with neuroblastoma cells, hypoglycemia induced tau hyperphosphorylation, which can lead to the formation of neurofibrillary tangles [25]. In the present study, a history of hypoglycemia increased both the AD and vascular subtypes of dementia. Although it is common to have a single patient with both AD and VD pathology, these subtypes can be difficult to distinguish. This study suggests that hypoglycemia can be related to both pathomechanisms and may make the brain more vulnerable to both pathologies.
- This study had several strengths. First, we investigated the largest senior cohort, which contains all of the claims data for >10% of the entire elderly population in South Korea for 14 years. Second, we tried to exclude bidirectional effects as much as possible. Dementia is one of the major risk factors for hypoglycemia; thus, dementia and hypoglycemia have a bi-directional effect. All subjects in our study were free of dementia at baseline, as we excluded patients who were diagnosed with dementia or prescribed dementia medications during the 9-year period before the index date, to assess temporality in the relationship. Third, as described above, we minimized selection bias by using propensity score matching with 48 variables, such as demographics, socioeconomic status, medication use, and comorbidities.
- However, several limitations should be considered. This was a retrospective analysis, and the claims database lacked results of any measurements, such as glycated hemoglobin or Mini-Mental State Exam scores, which may have influenced the results. Specifically, patients with mild cognitive impairment are more difficult to identify using a claims database without cognitive testing results. Thus, prospective cohort studies that include cognitive function tests to exclude mild cognitive impairment before enrollment are needed to confirm our results. Additionally, we analyzed the incidence of dementia and hypoglycemia according to ICD-10 diagnostic codes; however, there may have been some discrepancies between the medical diagnoses and the diagnostic codes in the claims data. However, a previous study showed that the dementia diagnoses in claims data were quite correct when compared with clinically diagnosed dementia [26]. In addition, because >99% of South Koreans are registered with National Health Insurance, and the dementia diagnostic codes are mandatory to earn insurance benefits when being prescribed dementia medication, it is highly unlikely that dementia would be found without the relevant diagnostic codes in the claims data. In terms of hypoglycemia, clinicians tend not to record hypoglycemia in actual practice, especially when it is mild, when entering diagnostic codes. Thus, this study is limited by the possibility that we underestimated the incidence of hypoglycemic episodes and were unable to assess the effects of mild hypoglycemia on dementia. Last, because this study only included the South Korean population, the results may not be generalizable to all ethnic groups. The incidence and proportion of dementia subtypes vary among ethnic groups [2728]. Previous studies have shown that the Asian population has a greater proportion of VaD and a lower proportion of AD [29].
- In summary, our study indicates that a history of hypoglycemia increases the risk for dementia in older adults with T2DM. This association is consistent for both AD and VaD. Caution is advised when treating T2DM in older individuals with hypoglycemia, to prevent deterioration of their cognitive ability.
DISCUSSION
-
Acknowledgements
- This study utilizes the data of the National Health Insurance Service (REQ0000016362) and results are unrelated to the opinion of the National Health Insurance Service.
- This work was supported by the National Research Foundation of Korea (NRF) grant funded by the Korea government (MSIT) (No. NRF-2018R1C1B5044056). The funding entities had no role in the conduct of this study or interpretation of its results.
ACKNOWLEDGMENTS
-
CONFLICTS OF INTEREST: No potential conflict of interest relevant to this article was reported.
-
AUTHOR CONTRIBUTIONS:
Conception or design: Y.G.K., S.J.H.
Acquisition, analysis, or interpretation of data: Y.G.K., D.G.P., S.J.H.
Drafting the work or revising: Y.G.K., D.G.P., S.Y.M., J.Y.J., H.J.K., D.J.K., K.W.L., S.J.H.
Final approval of the manuscript: Y.G.K., D.G.P., S.Y.M., J.Y.J., H.J.K., D.J.K., K.W.L., S.J.H.
NOTES
- 1. Biessels GJ, Staekenborg S, Brunner E, Brayne C, Scheltens P. Risk of dementia in diabetes mellitus: a systematic review. Lancet Neurol 2006;5:64-74. ArticlePubMed
- 2. Gudala K, Bansal D, Schifano F, Bhansali A. Diabetes mellitus and risk of dementia: a meta-analysis of prospective observational studies. J Diabetes Investig 2013;4:640-650.ArticlePubMedPMCPDF
- 3. Strachan MW, Reynolds RM, Marioni RE, Price JF. Cognitive function, dementia and type 2 diabetes mellitus in the elderly. Nat Rev Endocrinol 2011;7:108-114. ArticlePubMedPDF
- 4. Warren RE, Frier BM. Hypoglycaemia and cognitive function. Diabetes Obes Metab 2005;7:493-503. ArticlePubMed
- 5. Bree AJ, Puente EC, Daphna-Iken D, Fisher SJ. Diabetes increases brain damage caused by severe hypoglycemia. Am J Physiol Endocrinol Metab 2009;297:E194-E201. ArticlePubMedPMC
- 6. Whitmer RA, Karter AJ, Yaffe K, Quesenberry CP Jr, Selby JV. Hypoglycemic episodes and risk of dementia in older patients with type 2 diabetes mellitus. JAMA 2009;301:1565-1572. ArticlePubMedPMC
- 7. Lin CH, Sheu WH. Hypoglycaemic episodes and risk of dementia in diabetes mellitus: 7-year follow-up study. J Intern Med 2013;273:102-110. ArticlePubMedPDF
- 8. Yaffe K, Falvey CM, Hamilton N, Harris TB, Simonsick EM, Strotmeyer ES, Shorr RI, Metti A, Schwartz AV. Health ABC Study. Association between hypoglycemia and dementia in a biracial cohort of older adults with diabetes mellitus. JAMA Intern Med 2013;173:1300-1306. ArticlePubMedPMC
- 9. Mehta HB, Mehta V, Goodwin JS. Association of hypoglycemia with subsequent dementia in older patients with type 2 diabetes mellitus. J Gerontol A Biol Sci Med Sci 2017;72:1110-1116. ArticlePubMed
- 10. Bruce DG, Davis WA, Casey GP, Clarnette RM, Brown SG, Jacobs IG, Almeida OP, Davis TM. Severe hypoglycaemia and cognitive impairment in older patients with diabetes: the Fremantle Diabetes Study. Diabetologia 2009;52:1808-1815. ArticlePubMedPDF
- 11. Diabetes Control and Complications Trial/Epidemiology of Diabetes Interventions and Complications Study Research Group. Jacobson AM, Musen G, Ryan CM, Silvers N, Cleary P, Waberski B, Burwood A, Weinger K, Bayless M, Dahms W, Harth J. Long-term effect of diabetes and its treatment on cognitive function. N Engl J Med 2007;356:1842-1852. ArticlePubMedPMC
- 12. Couillard-Despres S, Iglseder B, Aigner L. Neurogenesis, cellular plasticity and cognition: the impact of stem cells in the adult and aging brain: a mini-review. Gerontology 2011;57:559-564. ArticlePubMedPDF
- 13. Prince M, Acosta D, Ferri CP, Guerra M, Huang Y, Llibre Rodriguez JJ, Salas A, Sosa AL, Williams JD, Dewey ME, Acosta I, Jotheeswaran AT, Liu Z. Dementia incidence and mortality in middle-income countries, and associations with indicators of cognitive reserve: a 10/66 Dementia Research Group population-based cohort study. Lancet 2012;380:50-58. ArticlePubMedPMC
- 14. Scazufca M, Menezes PR, Vallada HP, Crepaldi AL, Pastor-Valero M, Coutinho LM, Di Rienzo VD, Almeida OP. High prevalence of dementia among older adults from poor socioeconomic backgrounds in Sao Paulo, Brazil. Int Psychogeriatr 2008;20:394-405. PubMed
- 15. Wu CK, Yang YH, Lin TT, Tsai CT, Hwang JJ, Lin JL, Chen PC, Chiang FT, Lin LY. Statin use reduces the risk of dementia in elderly patients: a nationwide data survey and propensity analysis. J Intern Med 2015;277:343-352. ArticlePubMedPDF
- 16. Song Y, Nie H, Xu Y, Zhang L, Wu Y. Association of statin use with risk of dementia: a meta-analysis of prospective cohort studies. Geriatr Gerontol Int 2013;13:817-824. ArticlePubMed
- 17. Chen PY, Liu SK, Chen CL, Wu CS. Long-term statin use and dementia risk in Taiwan. J Geriatr Psychiatry Neurol 2014;27:165-171. ArticlePubMedPDF
- 18. Bohlken J, Jacob L, Kostev K. Association between the use of antihyperglycemic drugs and dementia risk: a case-control study. J Alzheimers Dis 2018;66:725-732. ArticlePubMed
- 19. Languren G, Montiel T, Julio-Amilpas A, Massieu L. Neuronal damage and cognitive impairment associated with hypoglycemia: an integrated view. Neurochem Int 2013;63:331-343. ArticlePubMed
- 20. Suh SW, Aoyama K, Chen Y, Garnier P, Matsumori Y, Gum E, Liu J, Swanson RA. Hypoglycemic neuronal death and cognitive impairment are prevented by poly(ADP-ribose) polymerase inhibitors administered after hypoglycemia. J Neurosci 2003;23:10681-10690. ArticlePubMedPMC
- 21. Tkacs NC, Pan Y, Raghupathi R, Dunn-Meynell AA, Levin BE. Cortical Fluoro-Jade staining and blunted adrenomedullary response to hypoglycemia after noncoma hypoglycemia in rats. J Cereb Blood Flow Metab 2005;25:1645-1655. ArticlePubMedPDF
- 22. Fisher BM, Hepburn DA, Smith JG, Frier BM. Responses of peripheral blood cells to acute insulin-induced hypoglycaemia in humans: effect of alpha-adrenergic blockade. Horm Metab Res Suppl 1992;26:109-110. PubMed
- 23. Dalsgaard-Nielsen J, Madsbad S, Hilsted J. Changes in platelet function, blood coagulation and fibrinolysis during insulin-induced hypoglycaemia in juvenile diabetics and normal subjects. Thromb Haemost 1982;47:254-258. ArticlePubMed
- 24. Wright RJ, Newby DE, Stirling D, Ludlam CA, Macdonald IA, Frier BM. Effects of acute insulin-induced hypoglycemia on indices of inflammation: putative mechanism for aggravating vascular disease in diabetes. Diabetes Care 2010;33:1591-1597. PubMedPMC
- 25. Lee CW, Shih YH, Wu SY, Yang T, Lin C, Kuo YM. Hypoglycemia induces tau hyperphosphorylation. Curr Alzheimer Res 2013;10:298-308. ArticlePubMed
- 26. Taylor DH Jr, Ostbye T, Langa KM, Weir D, Plassman BL. The accuracy of medicare claims as an epidemiological tool: the case of dementia revisited. J Alzheimers Dis 2009;17:807-815. ArticlePubMedPMC
- 27. Mayeda ER, Glymour MM, Quesenberry CP, Whitmer RA. Inequalities in dementia incidence between six racial and ethnic groups over 14 years. Alzheimers Dement 2016;12:216-224. ArticlePubMedPMCPDF
- 28. Mayeda ER, Karter AJ, Huang ES, Moffet HH, Haan MN, Whitmer RA. Racial/ethnic differences in dementia risk among older type 2 diabetic patients: the diabetes and aging study. Diabetes Care 2014;37:1009-1015. ArticlePubMedPMCPDF
- 29. Bulatao RA, Anderson NB, Cohen B. Critical perspectives on racial and ethnic differences in health in late life. Washington, DC: The National Academic Press; 2004.
REFERENCES

Kaplan-Meier plots for (A) all-cause dementia, (B) Alzheimer disease, and (C) vascular dementia in patients with or without underlying hypoglycemia.

Baseline characteristics of propensity score matched patients
Values are presented as mean±standard deviation, number (%), or percentage. The mean±standard deviation standardized difference of all covariates was 1.06%±0.09%.
SMD, standardized mean difference; DPP-4i, dipeptidyl-peptidase IV inhibitor; ACEI, angiotensin-converting-enzyme inhibitor; ARB, angiotensin II receptor antagonists; NOAC, novel oral anticoagulant.
aConfirmed using the International Classification of Diseases (10th revision) diagnosis codes.
The risk of dementia in patients with hypoglycemia compared to patients without hypoglycemia
The risk of dementia according to number of hypoglycemic episodes in patients with and without previous hypoglycemic episode
| No. of previous hypoglycemic episodes | Number | Events | HR | 95% CI | P value |
|---|---|---|---|---|---|
| 1 | 4,622 | 1,159 | 1.170 | 1.043–1.313 | 0.008 |
| 2–3 | 2,946 | 550 | 1.201 | 1.016–1.421 | 0.032 |
| >3 | 4,354 | 256 | 1.358 | 1.060–1.740 | 0.016 |
Subgroup analyses according to sex, age, and the presence of diabetic microvascular or macrovascular complications
Figure & Data
References
Citations
- Potential risk factors for mild cognitive impairment among patients with type 2 diabetes experiencing hypoglycemia
Ruonan Gao, Menglan Zhan, Sujie Ke, Kejun Wu, Guanlian He, Liqin Qi, Xiaoying Liu, Xiaohong Liu, Lijing Wang, Libin Liu
Diabetes Research and Clinical Practice.2024; 207: 111036. CrossRef - Association of hypoglycemic events with cognitive impairment in patients with type 2 diabetes mellitus: Protocol for a dose-response meta-analysis
Min Ye, Ai Hong Yuan, Qi Qi Yang, Qun Wei Li, Fei Yue Li, Yan Wei, Muhammad Shahzad Aslam
PLOS ONE.2024; 19(2): e0296662. CrossRef - Hypoglycaemia and the risk of dementia: a population-based cohort study using exposure density sampling
Wajd Alkabbani, Colleen J Maxwell, Ruth Ann Marrie, Suzanne L Tyas, Iliana C Lega, John-Michael Gamble
International Journal of Epidemiology.2023; 52(3): 908. CrossRef - Type 2 diabetes mellitus and cognitive function: understanding the connections
Lisa Dao, Sarah Choi, Matthew Freeby
Current Opinion in Endocrinology, Diabetes & Obesity.2023; 30(1): 7. CrossRef - Associations of Mid- and Late-Life Severe Hypoglycemic Episodes With Incident Dementia Among Patients With Type 2 Diabetes: A Population-Based Cohort Study
Wajd Alkabbani, Colleen J. Maxwell, Ruth Ann Marrie, Suzanne L. Tyas, Iliana C. Lega, John-Michael Gamble
Diabetes Care.2023; 46(2): 331. CrossRef - Nocturnal hypoglycemia is underdiagnosed in older people with insulin‐treated type 2 diabetes: The HYPOAGE observational study
Anne‐Sophie Boureau, Béatrice Guyomarch, Pierre Gourdy, Ingrid Allix, Cédric Annweiler, Nathalie Cervantes, Guillaume Chapelet, Isabelle Delabrière, Sophie Guyonnet, Rachel Litke, Marc Paccalin, Alfred Penfornis, Pierre‐Jean Saulnier, Matthieu Wargny, Sam
Journal of the American Geriatrics Society.2023; 71(7): 2107. CrossRef - Dementia in Diabetes: The Role of Hypoglycemia
Khaled Hameed Husain, Saud Faisal Sarhan, Haya Khaled Ali Abdulla AlKhalifa, Asal Buhasan, Abu Saleh Md Moin, Alexandra E. Butler
International Journal of Molecular Sciences.2023; 24(12): 9846. CrossRef - Association Between Trajectory of Severe Hypoglycemia and Dementia in Patients With Type 2 Diabetes: A Population-based Study
Chung-Yi Li, Chia-Lun Kuo, Ya-Hui Chang, Chin-Li Lu, Santi Martini, Wen-Hsuan Hou
Journal of Epidemiology.2022; 32(9): 423. CrossRef - Severe Hypoglycemia Increases Dementia Risk and Related Mortality: A Nationwide, Population-based Cohort Study
Eugene Han, Kyung-do Han, Byung-Wan Lee, Eun Seok Kang, Bong-Soo Cha, Seung-Hyun Ko, Yong-ho Lee
The Journal of Clinical Endocrinology & Metabolism.2022; 107(5): e1976. CrossRef - Association between hypoglycemia and dementia in patients with diabetes: a systematic review and meta-analysis of 1.4 million patients
Lifen Huang, Manlian Zhu, Jie Ji
Diabetology & Metabolic Syndrome.2022;[Epub] CrossRef - Potential Roles of Glucagon-Like Peptide-1 and Its Analogues in Dementia Targeting Impaired Insulin Secretion and Neurodegeneration
Sidharth Mehan, Sonalika Bhalla, Ehraz Mehmood Siddiqui, Nidhi Sharma, Ambika Shandilya, Andleeb Khan
Degenerative Neurological and Neuromuscular Disease.2022; Volume 12: 31. CrossRef - Immortal time bias for life-long conditions in retrospective observational studies using electronic health records
Freya Tyrer, Krishnan Bhaskaran, Mark J. Rutherford
BMC Medical Research Methodology.2022;[Epub] CrossRef - Glucose-lowering drugs, cognition, and dementia: The clinical evidence
Che-Yuan Wu, Lila Shapiro, Michael Ouk, Bradley J. MacIntosh, Sandra E. Black, Baiju R. Shah, Walter Swardfager
Neuroscience & Biobehavioral Reviews.2022; 137: 104654. CrossRef - Switching insulin degludec to insulin glulisine improved nocturnal hypoglycemia and ventricular arrythmia in an elderly type 1 diabetes patient with chronic heart failure: A case report
Yuriko Hajika, Yuji Kawaguchi, Takako Tanaka, Kenji Hamazaki, Yasuro Kumeda
Nippon Ronen Igakkai Zasshi. Japanese Journal of Geriatrics.2022; 59(2): 237. CrossRef - Diagnostic, Prognostic, and Mechanistic Biomarkers of Diabetes Mellitus-Associated Cognitive Decline
Hanan Ehtewish, Abdelilah Arredouani, Omar El-Agnaf
International Journal of Molecular Sciences.2022; 23(11): 6144. CrossRef - Amyloid $$upbeta$$ (1–42) peptide impairs mitochondrial respiration in primary human brain microvascular endothelial cells: impact of dysglycemia and pre-senescence
Siva S. V. P. Sakamuri, Venkata N. Sure, Xiaoying Wang, Gregory Bix, Vivian A. Fonseca, Ricardo Mostany, Prasad V. G. Katakam
GeroScience.2022; 44(6): 2721. CrossRef - Mechanistic Role of Jak3 in Obesity-Associated Cognitive Impairments
Premranjan Kumar, Jayshree Mishra, Narendra Kumar
Nutrients.2022; 14(18): 3715. CrossRef - Assessing real-world effectiveness of therapies: what is the impact of incretin-based treatments on hospital use for patients with type 2 diabetes?
Clémence Bussiere, Pauline Chauvin, Jean-Michel Josselin, Christine Sevilla-Dedieu
Health Economics Review.2022;[Epub] CrossRef - Fasting Glucose Variability and the Risk of Dementia in Individuals with Diabetes: A Nationwide Cohort Study
Da Young Lee, Jaeyoung Kim, Sanghyun Park, So Young Park, Ji Hee Yu, Ji A Seo, Nam Hoon Kim, Hye Jin Yoo, Sin Gon Kim, Kyung Mook Choi, Sei Hyun Baik, Kyungdo Han, Nan Hee Kim
Diabetes & Metabolism Journal.2022; 46(6): 923. CrossRef - Meta-Analysis: Association Between Hypoglycemia and Serious Adverse Events in Older Patients Treated With Glucose-Lowering Agents
Katharina Mattishent, Yoon K. Loke
Frontiers in Endocrinology.2021;[Epub] CrossRef - Hypoglycemia, Vascular Disease and Cognitive Dysfunction in Diabetes: Insights from Text Mining-Based Reconstruction and Bioinformatics Analysis of the Gene Networks
Olga V. Saik, Vadim V. Klimontov
International Journal of Molecular Sciences.2021; 22(22): 12419. CrossRef - Muscle strength, an independent determinant of glycemic control in older adults with long-standing type 2 diabetes: a prospective cohort study
Bo Kyung Koo, Seoil Moon, Min Kyong Moon
BMC Geriatrics.2021;[Epub] CrossRef - Optimal Type 2 Diabetes Mellitus Management and Active Ageing
Alessia Maria Calabrese, Valeria Calsolaro, Sara Rogani, Chukwuma Okoye, Nadia Caraccio, Fabio Monzani
Endocrines.2021; 2(4): 523. CrossRef - Response: Hypoglycemia and Dementia Risk in Older Patients with Type 2 Diabetes Mellitus: A Propensity-Score Matched Analysis of a Population-Based Cohort Study (Diabetes Metab J 2020;44:125–33)
Seung Jin Han
Diabetes & Metabolism Journal.2020; 44(2): 360. CrossRef - Severe hypoglycaemia and absolute risk of cause-specific mortality in individuals with type 2 diabetes: a UK primary care observational study
Francesco Zaccardi, Suping Ling, Claire Lawson, Melanie J. Davies, Kamlesh Khunti
Diabetologia.2020; 63(10): 2129. CrossRef - Letter: Hypoglycemia and Dementia Risk in Older Patients with Type 2 Diabetes Mellitus: A Propensity-Score Matched Analysis of a Population-Based Cohort Study (Diabetes Metab J 2020;44:125–33)
Jin Hwa Kim
Diabetes & Metabolism Journal.2020; 44(2): 356. CrossRef - Low‐glucose‐sensitive TRPC6 dysfunction drives hypoglycemia‐induced cognitive impairment in diabetes
Chengkang He, Peng Gao, Yuanting Cui, Qiang Li, Yingsha Li, Zongshi Lu, Huan Ma, Yu Zhao, Li Li, Fang Sun, Xiaowei Chen, Hongbo Jia, Daoyan Liu, Gangyi Yang, Hongting Zheng, Zhiming Zhu
Clinical and Translational Medicine.2020;[Epub] CrossRef - Hypoglycaemia and Cardiovascular Disease Risk in Patients with Diabetes
Niki Katsiki, Kalliopi Kotsa, Anca P. Stoian, Dimitri P. Mikhailidis
Current Pharmaceutical Design.2020; 26(43): 5637. CrossRef
 PubReader
 Cite
Cite- Figure
-
- Related articles
-
- The Risk of Shoulder Adhesive Capsulitis in Individuals with Prediabetes and Type 2 Diabetes Mellitus: A Longitudinal Nationwide Population-Based Study
- Clinical Effects of a Home Care Pilot Program for Patients with Type 1 Diabetes Mellitus: A Retrospective Cohort Study
- Low Household Income Status and Death from Pneumonia in People with Type 2 Diabetes Mellitus: A Nationwide Study
- Safety of COVID-19 Vaccines among Patients with Type 2 Diabetes Mellitus: Real-World Data Analysis
- Safety and Effectiveness of Empagliflozin in Korean Patients with Type 2 Diabetes Mellitus: Results from a Nationwide Post-Marketing Surveillance


