The Relationship between Thyroid Function and Different Obesity Phenotypes in Korean Euthyroid Adults
Article information

Abstract
Background
Thyroid disease and metabolic syndrome are both associated with cardiovascular disease. The aim of this study was to investigate the correlation between thyroid hormones and obesity sub-phenotypes using nationwide data from Korea, a country known to be iodine replete.
Methods
This study was based on data obtained from the sixth Korea National Health and Nutrition Examination Survey, administered from 2013 to 2015. A total of 13,873 participants aged ≥19 years were included, and classified into four groups: metabolically healthy non-obesity (MHNO), metabolically healthy obesity (MHO), metabolically unhealthy non-obesity (MUNO), and metabolically unhealthy obesity (MUO) by body fat on the basis of body mass index and metabolic health.
Results
At baseline, serum free thyroxine (fT4) values were significantly higher in the MHNO phenotype (MHNO, 1.27±0.01 ng/dL; MHO, 1.25±0.01 ng/dL; MUNO, 1.24±0.01 ng/dL; MUO, 1.24±0.01 ng/dL, P<0.001) in total study population. However, this significant association no longer remained after adjustment for age, urine iodine concentration, and smoking (P=0.085). After adjustment for confounders, statistically significant association was observed between lower thyroid stimulating hormone (TSH) and MHNO phenotype (P=0.044). In men participants (not women), higher fT4 values were significantly associated with MHNO phenotype (P<0.001). However, no significant association was observed between thyroid function (TSH or fT4) and obesity phenotypes in groups classified by age (cutoff age of 55 years).
Conclusion
Although there was a difference by age and sex, we found that the decrease of TSH and the increase of fT4 values were associated with MHNO.
INTRODUCTION
Metabolic syndrome (MetS) is a combination of unfavorable health factors, including abdominal obesity, hyperglycemia, hypertension, and dyslipidemia [1]. The association between these factors has been known for decades. In recent years, the prevalence of MetS has been increasing worldwide and MetS is associated with an increased risk of developing serious diseases, such as type 2 diabetes mellitus (T2DM) [2], cardiovascular disease (CVD) [3], and all-cause mortality [4].
Obesity is a key component of MetS and increases the risk of developing T2DM, dyslipidemia, and CVD [56]. However, recent evidence indicates that not all obese individuals have a higher risk of mortality [7]. A subgroup of approximately 10% to 30% of obese individuals are thought to be metabolically healthy, despite having an excessive accumulation of body fat [89]. In the current literature, this is referred to as metabolically healthy obesity (MHO) [10]. Recently, various sub-phenotypes of obesity with different metabolic profiles have been well described. These obesity phenotypes are better predictors for the development of CVD and increased mortality than obesity itself [11].
Both excessive and insufficient iodine intake are known to be associated with various thyroid diseases. Korea is a known to be an iodine-replete area which high intake of seaweed and seafood. One recent study demonstrates more than adequate iodine intake and as right-shifted distribution of serum thyroid stimulating hormone (TSH) values in the Korean general population [1213].
Thyroid hormones (THs) are primarily responsible for the regulation of energy homeostasis and metabolism [14]. To date, several cross-sectional studies have demonstrated an association between THs or TSH and MetS in euthyroid subjects [151617181920]. Some recent studies have shown that high TSH quintiles were associated to insulin resistance (IR) and MetS [16]. In contrast, others have reported no association between TSH and MetS in euthyroid subjects [2122].
Low-normal free thyroxine (fT4) values in adults are associated with greater IR, and subjects with low-normal thyroid function are at increased risk for CVD [21]. Thus, there may be associations between THs and factors relating to components of MetS.
Recently, a prospective population-based cohort study showed that fT4 values within the reference range were associated with the development of some obesity phenotypes in the Tehran Thyroid Study [23]. However, the association between THs values and obesity sub-phenotypes has not yet been clarified in Koreans with high iodine consumption. Therefore, the purpose of our study was to investigate the relationship between THs values and obesity sub-phenotypes according to age and sex in the Korean general population.
METHODS
Study population
Data from the sixth Korea National Health and Nutrition Examination Survey (KNHANES VI) administered from 2013 to 2015, were analyzed. The KNHANES VI, which is surveyed every year by the Korea Center for Disease Control and Prevention, is a nationwide, population-based, and cross-sectional survey to assess the health and nutritional status of Koreans. The sampling units used included stratified, multistage clustered, and random sampling design, based on geographic area, sex, and age group by using household registries. Survey participants are different each year, and are not monitored serially. All individuals participated in the survey voluntarily and written informed consent was obtained from all subjects.
A total of 22,948 individuals participated in this survey, and we excluded 4,914 individuals under the age of 19. We analyzed data from participants aged ≥19 years who had data on the following variables available: age, sex, body mass index (BMI), smoking status, personal medical history (e.g., hypertension, diabetes, and thyroid disorders), thyroid function (TSH, fT4), urine iodine concentration (UIC), underlying disease (e.g., cancer, liver cirrhosis, chronic kidney disease), and components of MetS (e.g., triglyceride [TG], high density lipoprotein cholesterol [HDL-C], blood pressure [BP], fasting plasma glucose [FPG], and glycosylated hemoglobin [HbA1c]).
Of the 18,034 participants aged ≥19 years, individuals were excluded for reasons including history of thyroid disease or any type of cancer, history of taking medicines that could influence thyroid function, chronic kidney disease, pregnant women, and liver cirrhosis. Additionally, participants were excluded if they had a TSH <0.62 µIU/L or a TSH >6.68 µIU/L and taking lipid-lowering drugs. Finally, a total of 13,873 participants were included in the analysis.
Definitions for each variables
Euthyroidism was defined as a serum TSH in the reference range of the Korean population (0.62 to 6.68 µIU/L) [13]. We defined metabolic status using criteria proposed by the National Cholesterol Education Program-Adult Treatment Panel III (NCEP-ATP III) criteria [24]: (1) serum TG ≥150 mg/dL; (2) HDL-C <40 mg/dL in men and <50 mg/dL in women; (3) systolic BP ≥130 mm Hg or diastolic BP ≥85 mm Hg, or taking antihypertensive drugs; and (4) FPG ≥100 mg/dL or HbA1c ≥6.5% or undergoing treatment for diabetes. Individuals with two or more criteria were categorized as metabolically unhealthy. The waist circumference (WC) criterion was not used. Obesity has been well-defined using BMI, and this was calculated as body weight divided by the height squared. Adults with a BMI of ≥25 kg/m2 were considered obese.
We divided participants into the following four groups by body fat on the basis of BMI and metabolic health status [1024]: (1) metabolically healthy non-obesity (MHNO); (2) MHO; (3) metabolically unhealthy non-obesity (MUNO); and (4) metabolically unhealthy obesity (MUO).
Data collection
Health examinations included medical history, physical examination, a questionnaire on health-related behavior, and biochemical measurements. Physical examinations were performed by trained medical staffs following standardized procedures, and blood sampling was performed for all individuals aged ≥19 years. Participants were also asked about cigarette smoking, participants who had smoked during their lifetime were categorized as smokers and others were defined as non-smokers.
Blood samples were processed and transported to the Central Testing Institute located in Seoul (Korea), and analyzed within 24 hours. For analysis of serum TSH and fT4, approximately 15 mL of blood was collected from each participant. After separation of the serum within 30 minutes, the samples were then transferred and analyzed within 24 hours. Serum TSH, fT4 values were measured with an electrochemiluminescence immunoassay (Roche Diagnostics, Mannheim, Germany). TSH was measured with an E-TSH kit (Roche Diagnostics), and fT4 was measured using an E-Free T4 kit (Roche diagnostics). UIC was measured by an inductively coupled plasma mass spectrometry (ICP-MS; PerkinElmer, Waltham, MA, USA) using an iodine standard (Inorganic Venture, Christiansburg, VA, USA).
Lipid profiles were measured with a Hitachi Automatic Analyzer 7600 (Hitachi, Tokyo, Japan) using commercially available kits (Sekisui, Osaka, Japan). Serum total cholesterol (TC) and TG were measured by enzymatic methods and low density lipoprotein cholesterol (LDL-C) and HDL-C were measured by homogeneous enzymatic colorimetric methods.
BP was measured on the right arm using a standard mercury sphygmomanometer (Baumanometer, WA Baum Co., Copiague, NY, USA), while in a sitting position. Systolic and diastolic BP readings were recorded twice at 5-minute intervals and were recorded as an average for analysis. WC was measured at the level of the umbilicus in centimeters.
Statistical analysis
All statistical tests were analyzed using the SAS version 9.3 (SAS Institute Inc., Cary, NC, USA) program and IBM SPSS Statistics for Windows version 22.0 (IBM Corp., Armonk, NY, USA). Weighted sample values were used to attain unbiased estimates representing the general Korean population with consideration for its stratified multistage probability sampling design of KNHANES VI. Due to a skewed distribution, a logarithmic transformation TSH values was used in the analysis. Results were expressed as mean±standard deviation. Differences in descriptive baseline characteristics were explored using Student's t-test or analysis of variance (ANOVA) test. To assess the independence of two categorical variables, the chi-square test or Fisher's exact test was used. The statistical differences between THs and various obesity phenotypes according to age and sex was compared using analysis of covariance (ANCOVA) after adjusting for age, UIC, and smoking.
The odds ratios (ORs) and 95% confidence intervals (CIs) for serum TSH and fT4 in association with the prevalence of MetS and its components, were calculated using multivariate logistic regression analysis after adjusting for age, sex, UIC, and smoking. A separate adjustment for BMI was made in a model 2. All statistical tests were two-sided and P values of <0.05 were considered statistically significant.
RESULTS
A total of 13,873 subjects were included in the study. Baseline characteristics of the study population are presented in Table 1. Of the four obesity phenotypes, the MHNO group was the largest group (MHNO 48.6%, MHO 13.8%, MUNO 18.2%, and MUO 19.4%). The number of non-obese individuals was higher in the metabolically healthy group (MHNO 48.6%, MUNO 18.2%). In contrast, obese individuals were more likely to be metabolically unhealthy compared to non-obese individuals (MHO 13.8%, MUO 19.4%). The mean age in each group was 40.48±0.27, 41.98±0.49, 52.20±0.44, and 48.43±0.38 years for MHNO, MHO, MUNO, and MUO respectively. Individuals in the MHNO group had significantly lower BMI, systolic and diastolic BP, TC, LDL-C, TG, and FPG. Although the difference was not statistically significant, serum TSH values were higher in the MUO group than in the other groups (MHNO, 2.54±0.06 µIU/L; MHO, 2.74±0.11 µIU/L; MUNO, 2.73±0.10 µIU/L; MUO, 2.84±0.15 µIU/L, P=0.316). And fT4 was significantly higher in MHNO group than in the other groups (MHNO, 1.27±0.01 ng/dL; MHO, 1.25±0.01 ng/dL; MUNO, 1.24±0.01 ng/dL; MUO, 1.24±0.01 ng/dL, P<0.001). No significant differences in UIC levels were observed between the various obesity phenotypes (P=0.316).

Baseline characteristics of the study populations based on different obesity phenotypes
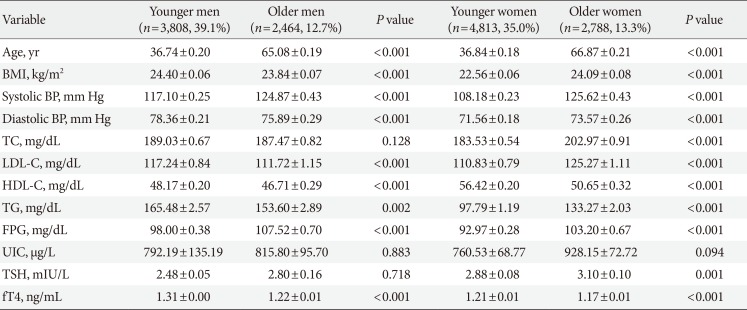
Table 2 shows the baseline characteristics of the study population based on different age and sex. Based on data presented in Table 2, in men, TC, UIC, and TSH did not differ significantly according to age (P=0.128, P=0.883, and P=0.718, respectively). However, in women, only UIC was not significant different according to age (P=0.094). In younger women, serum TSH was significantly lower and fT4 was higher than in older women (P=0.001 and P<0.001, respectively). In younger men, TSH and fT4 values had similar results to younger women, but TSH did not differ statistically significant.

Baseline characteristics of the study populations by different age and sex groups
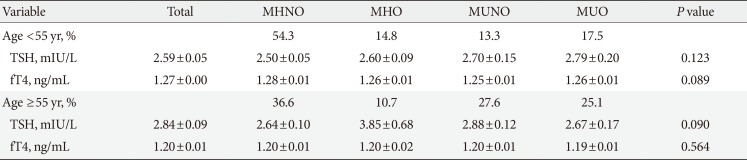
Table 3 shows the association of serum TSH and fT4 values with obesity phenotypes in the total study populations. MHNO group had significantly lower TSH values compared to others after adjusting for age, UIC, and smoking (P=0.044). No significant differences in fT4 values were observed between the various obesity phenotypes (P=0.085). The results of the ANCOVA test for comparison, according to thyroid profile parameters in men and women, are shown in Table 4. The data show that in the subgroup analysis according to sex, TSH, and fT4 values of men were similar to results in accordance with unadjusted state of the total study population. However, in women, there was no significant difference in TSH (P=0.504) and fT4 (P=0.698) values across the four different phenotypes after adjusting for age, UIC, and smoking. Thyroid function (TSH or fT4) was not associated with any obesity phenotypes according to age (cutoff age of 55 years) (Table 5).

Comparison of thyroid hormone parameters in different obesity phenotypes

Comparison of thyroid hormone parameters in different obesity phenotypes according to sex

Comparison of thyroid hormone parameters in different obesity phenotypes according to age (cutoff of 55 years)
Serum TSH and fT4 values, in association with the prevalence of MetS and its components as binary outcomes using logistic regression, are presented in Supplementary Tables 1,2,3. The increased serum fT4 values in the total population (OR, 0.41; 95% CI, 0.24 to 0.69), men (OR, 0.31; 95% CI, 0.16 to 0.62), and younger participants (OR, 0.37; 95% CI, 0.19 to 0.72) were associated with decreased the prevalence of MetS after adjusting for age, sex, UIC, and smoking. In model 1, serum fT4 was associated with lower odds of high WC and high TG after adjusting for age, sex, UIC, and smoking. In model 2, which was adjusted by adding BMI to model 1, fT4 was associated with lower odds of high TG. However, serum TSH values were not associated with the prevalence of MetS and any of its components in all groups.
DISCUSSION
This was a nationwide cohort study to evaluate the relationship between thyroid function and different obesity phenotypes according to age and sex in the Korean population. In total study population, the positive association observed between fT4 and MHNO phenotype in the unadjusted state disappeared after adjustment for confounding variables, suggesting that the positive association of fT4 with the MHNO phenotype may be influenced by some other factors, including age, UIC, and smoking. TSH in the low normal range was related to MHNO phenotype after adjusting for age, UIC, and smoking.
In a study by Iacobellis et al. [25], the degree of obesity was positively associated with TSH values in the high-normal or slightly high range in metabolically healthy obese women. This phenomenon may be explained by neuroendocrine dysfunction, especially by the inappropriate release of leptin, which has been shown to stimulate excess TSH secretion in adipose tissue [26]. However except for total study population after adjustment for confounders and older women, there was no significant difference in TSH values among the four different phenotypes. The fact that serum TSH values increased with age, which may represent a normal compensatory phenomenon in older adults due to high levels of thyroid antibodies [27]. In this study, the TSH values were significantly higher in older participants than that in younger individuals.
There are controversial data regarding the association of TSH and fT4 with MetS and its components. Mehran et al. [28] reported that lower normal serum fT4 values (not TSH) over time were associated with an increased risk of MetS, especially in non-obese adults. Similar to some previous study, our data show that higher fT4 values were significantly associated with the MHNO group in euthyroid individuals with total study population and men. However, we did not find that fT4 values were associated with various obesity phenotypes after adjusting for age, UIC, and smoking in total study population, women and groups classified by age (cutoff age of 55 years). In non-obese individuals, higher fT4 values were more likely to be metabolic healthy in both men and women.
The prevalence of MetS differs with sex, and abdominal obesity is the most common component of MetS in women [2930]. A review article reported [31] substantial gender-specific differences related to IR, body composition, and energy balance: specifically, more visceral and hepatic adipose tissue in men and lack of a possible protective effect of estrogen are associated with increased IR in men compared with women. An earlier paper suggested that fT4, rather than TSH, within the normal reference range was related to components of MetS [22]. Although TSH has been considered as a highly sensitive measure of thyroid dysfunction, fT4 could be a more reliable marker of tissue thyroid status. Shin et al. [32] reported that small differences in fT4 values were closely associated with obesity, lipid profile, and IR in euthyroid healthy subjects. In the present study, increased serum fT4 values were significantly associated with decreased the prevalence of MetS in total population, men, and younger participants. Furthermore, high WC and high TG were significantly negative association with fT4 according to sex. However, our results were suggested serum TSH within the reference range was not associated with the prevalence of MetS and any of its components in all groups.
The present study had some limitations. First, the cross-sectional study design limited the ability to detect cause-and-effect relationships. Second, we did not calculate the value of the homeostasis model assessment index for insulin resistance (HOMA-IR), because of lacking data on individual fasting insulin levels in the KNHANES VI. A few studies have investigated the association between thyroid function and IR, considering the impact of obesity in the euthyroid range. These studies have shown significant relationships with mild thyroid dysfunction [2232], although this is controversial [3334]. Third, triiodothyronine (T3) values were unavailable, as the KNHANES VI included fT4 and TSH for thyroid function screening in a general population voluntarily receiving a health exam. Moderately elevated T3 levels are commonly observed in obese individuals [35]. A recent study reported that a higher free triiodothyronine (fT3) and fT3-to-fT4 ratio in the normal range are associated with components of MetS [14]. Despite these limitations, the strengths of our study include the large healthy population surveyed in Korea, and assessment of both fT4 and TSH with UIC. In addition, we have analyzed the relationship between THs and obesity phenotypes not only in the general population but also different sex and age groups. Previous reports of low-normal fT4 values were related to IR in normal weight and overweight/obese euthyroid subjects in the Korean population [32]. However, the report did not adjust for UIC, which has been associated with various thyroid diseases and serum TSH [12].
When dividing the groups into those that were metabolically healthy (MHNO, MHO), TSH was highest in the MHO group after adjusting for age, UIC, and smoking. These results suggest that high TSH values could indicate obesity subjects. Also, higher fT4 values could indicate metabolically healthy status in the non-obese men.
In conclusion, although there was a difference by age and sex, we found that the decrease of TSH and the increase of fT4 values were associated with MHNO. Thyroid function (TSH or fT4) was not associated with any obesity phenotypes according to age.
An increase of serum fT4 values, not TSH is associated with a decreased risk for MetS. Especially, fT4 was associated with lower odds of high WC and high TG. The findings from our study need to be confirmed in well-designed prospective studies in the future.
ACKNOWLEDGMENTS
None
Notes
CONFLICTS OF INTEREST: No potential conflict of interest relevant to this article was reported.
AUTHOR CONTRIBUTIONS:
Conception or design: B.H.K.
Acquisition, analysis, or interpretation of data: J.M.K, B.H.K., H.L., E.H.K., M.K., J.H.K., Y.K.J., S.S.K., I.J.K., Y.K.K.
Drafting the work or revising: J.M.K., B.H.K.
Final approval of the manuscript: J.M.K., B.H.K., H.L., E.H.K., M.K., J.H.K., Y.K.J., S.S.K., I.J.K., Y.K.K.
References
SUPPLEMENTARY MATERIALS
Supplementary materials related to this article can be found online at https://doi.org/10.4093/dmj.2018.0130.
Supplementary Table 1
Serum TSH and fT4 in association with prevalence of MetS and its components as binary outcomes using logistic regression
Supplementary Table 2
Serum TSH and fT4 in association with prevalence of MetS and its components by different sex
Supplementary Table 3
Serum TSH and fT4 in association with prevalence of MetS and its components by different age