
- Current
- Browse
- Collections
-
For contributors
- For Authors
- Instructions to authors
- Article processing charge
- e-submission
- For Reviewers
- Instructions for reviewers
- How to become a reviewer
- Best reviewers
- For Readers
- Readership
- Subscription
- Permission guidelines
- About
- Editorial policy
Articles
- Page Path
- HOME > Diabetes Metab J > Volume 43(3); 2019 > Article
-
Original ArticleOthers Serum R-Spondin 1 Is a New Surrogate Marker for Obesity and Insulin Resistance
-
Yea Eun Kang
 , Ji Min Kim, Hyon-Seung Yi, Kyong Hye Joung, Ju Hee Lee, Hyun Jin Kim, Bon Jeong Ku
 -
Diabetes & Metabolism Journal 2019;43(3):368-376.
DOI: https://doi.org/10.4093/dmj.2018.0066
Published online: October 23, 2018
Department of Internal Medicine, Chungnam National University College of Medicine, Daejeon, Korea.
- Corresponding author: Bon Jeong Ku. Department of Internal Medicine, Chungnam National University College of Medicine, 282 Munhwa-ro, Jung-gu, Daejeon 35015, Korea. bonjeong@cnu.ac.kr
- Corresponding author: Hyun Jin Kim. Department of Internal Medicine, Chungnam National University College of Medicine, 282 Munhwa-ro, Jung-gu, Daejeon 35015, Korea. kimhj43@cnuh.co.kr
Copyright © 2019 Korean Diabetes Association
This is an Open Access article distributed under the terms of the Creative Commons Attribution Non-Commercial License (http://creativecommons.org/licenses/by-nc/4.0/) which permits unrestricted non-commercial use, distribution, and reproduction in any medium, provided the original work is properly cited.
ABSTRACT
-
Background
- Recent in vivo studies indicated that R-spondin 1 (RSPO1) regulates food intake and increases insulin secretion, but its role in humans remains unknown. This study investigated the association between serum levels of RSPO1 and diverse metabolic parameters in humans.
-
Methods
- The study population consisted of 43 subjects with newly diagnosed diabetes mellitus, and 79 non-diabetic participants. Serum levels of RSPO1 were measured using the enzyme-linked immunosorbent assay. The relationships between circulating RSPO1 and diverse metabolic parameters were analyzed.
-
Results
- Circulating RSPO1 levels increased to a greater extent in the obese group than in the lean group. Moreover, serum levels of RSPO1 were higher in the insulin-resistant group than in the insulin-sensitive group. Serum levels of RSPO1 were significantly correlated with a range of metabolic parameters including body mass index, fasting C-peptide, homeostasis model assessment of insulin resistance index, and lipid profile. Moreover, levels were significantly associated with insulin resistance and obesity in non-diabetic subjects.
-
Conclusion
- This study demonstrated the association between serum levels of RSPO1 and a range of metabolic parameters in humans. Serum levels of RSPO1 are significantly related to obesity and insulin resistance, although the precise mechanisms remain unknown.
- Wnt signaling plays essential roles during embryonic development and has been implicated in both physiological and pathologic conditions [12]. Binding of Wnt ligands to the receptor complex results in stabilization and nuclear translocation of β-catenin, binding to the transcriptional repressor, and activation of target genes [34]. Previously, many researchers focused the link of Wnt signaling and metabolic disease, and most of observations suggested that the upregulation of Wnt signaling blocked adipose tissue expansion [5678]. However, a recent study indicated that WNT5A expression was significantly positively correlated with obesity [910]. Despite inconsistent reports, there is increasing research interest regarding which components of the Wnt signaling pathway play specific roles in the regulation of metabolism.
- The secreted R-spondin proteins 1–4 (RSPO1–4) were identified as endogenous ligands to potentiate Wnt signaling [1112]. These proteins show 40% to 60% identity to each other, and have similar structures as a thrombospondin-like domain [13]. RSPOs can bind leucine-rich repeat-containing G protein-coupled receptors 4–6 (LGR4–6), group B of the LGR family, and potentiate Wnt signaling [14]. A recent study indicated that Lgr4 and its ligands, RSPO1 and RSPO3, are expressed in hypothalamic energy homeostatic areas of male rats [15]. Interestingly, expression levels of RSPO1 and RSPO3 were downregulated by fasting and increased by insulin, which suggests that RSPOs play roles as anorexigenic factors to regulate energy homeostasis [15]. RSPO1 was also detected in murine islets, and stimulated insulin secretion in a glucose-dependent manner in both the MIN6 cell line and in mouse islets [16]. However, there have been no studies regarding the roles of RSPOs in human patients with metabolic diseases. A recent study revealed a role of LGR4, the receptor for RSPOs, in human metabolic disease. Mice with ablation of Lgr4, encoding the specific receptor for RSPO1, showed reduced adiposity and improved glucose metabolism through upregulation of energy expenditure via white-to-brown fat transition [17]. The authors also explored the association between human LGR4 variant and activated point mutation (A750T), with human obesity [17]. These observations regarding LGR4 in human metabolic disease were not consistent with previous reports focusing on the role of RSPO1 in metabolic disease, although RSPO1 binds to LGR4 with greater affinity than other RSPOs [14]. Moreover, data on the role of RSPO1 in human subjects with metabolic disease are limited. To investigate the potential role and value of RSPO1 in metabolic disease, we measured and compared plasma levels of RSPO1 between subjects with and without diabetes.
INTRODUCTION
- Subjects
- The initial study population consisted of 134 participants from the outpatient clinic of the Division of Endocrinology and Metabolism of Chungnam National University Hospital (Daejeon, Korea) between January 2014 and December 2017. The inclusion criteria were as follows: age >18 years, absence of any clinical signs of infection or inflammation, systolic blood pressure (SBP) <140 mm Hg and diastolic blood pressure (DBP) <100 mm Hg, no alcohol or drug abuse, no history of diagnosis with diabetes mellitus (DM), and no pregnancy. Twelve participants were excluded because of liver cirrhosis (n=1), malignancies (prostate cancer, n=1; liver cancer, n=2; and pituitary adenoma, n=1), and clinical signs of infection or inflammation (pneumonia, n=1; acute gastroenteritis, n=2; and fever of unknown origin, n=4). Finally, 43 participants with newly diagnosed type 2 DM and 79 control non-diabetic participants were included in this study. In our study, the participants were divided into three groups: non-obese subjects (n=45), obese subjects (n=34), and patients with type 2 DM (n=43). Our experimental protocol was performed in accordance with the Declaration of Helsinki and The Institutional Review Board of Chungnam National University Hospital (CNUH 2014-12) approved the protocol for this research, and written informed consent was obtained from all the subjects.
- Clinical parameters
- All participants underwent physical examinations on the day on which the study commenced. Height, body weight, SBP, and DBP were recorded. Blood pressure was measured after 10 minutes of rest from the right arm of each patient in the seated position using an Omron IntelliSense Automatic Blood Pressure Monitor (Omron, Kyoto, Japan). Height and body weight were determined without shoes in the morning. Body mass index (BMI) was calculated as weight in kilograms (kg) divided by height in meters squared (m2).
- Measurement of biochemical parameters
- All blood samples were collected in the morning after an overnight fast of >8 hours into tubes containing ethylenediaminetetraacetic acid (EDTA) [18]. We measured the levels of fasting glucose, C-peptide, insulin, triglycerides (TGs), total cholesterol, low density lipoprotein cholesterol (LDL-C), high density lipoprotein cholesterol (HDL-C), apolipoprotein B, aspartate aminotransferase, alanine aminotransferase (ALT), blood urea nitrogen, creatinine, high-sensitivity C-reactive protein (hsCRP), and glycosylated hemoglobin (HbA1c). Blood chemistry and lipid profiles were measured using a blood chemistry analyzer (Hitachi 747; Hitachi, Tokyo, Japan). HbA1c was measured by high-performance liquid chromatography (Bio-Rad, Hercules, CA, USA). Insulin and C-peptide were measured using a radioimmunoassay (Roche, Penzberg, Germany). We also performed the 75 g oral glucose tolerance test. The homeostasis model assessment of insulin resistance (HOMA-IR) was calculated as follows: fasting insulin level (µIU/mL)×fasting glucose level (in mM)/22.5. The homeostasis model assessment of β-cell index (HOMA-β) was calculated as follows: fasting insulin level (µIU/mL)×20/fasting glucose level (in mM)–3.5 [1920]. In addition, we defined obesity as BMI ≥25, calculated as weight in kilograms divided by height in meters squared, following the WHO Asia-Pacific classification guidelines [21]. DM was defined according to the American Diabetes Association criteria [22].
- Measurements of serum levels of RSPO1
- Serum levels of RSPO1 were measured using a commercially available quantitative sandwich enzyme-linked immunosorbent assay (ELISA) kit (Catalog No. DY4645–05; R&D Systems, Minneapolis, MN, USA). The ELISA quantitatively immunoassayed human RSPO1 levels. The intra-assay coefficient of variation (CV) of the ELISA kit was 5.7% and the inter-assay CV of the ELISA Kit was 9.5% in our laboratory.
- Statistical analyses
- Continuous variables are expressed as the mean±standard deviation (SD), and the significance of between-group differences was evaluated using the Student t-test or Mann-Whitney U test. Categorical variables are expressed as percentages, and between-group differences were compared to the chi-square test. To evaluate associations between serum levels of RSPO1 and other variables, we subjected the data to Pearson's and partial correlation analyses. A two-tailed P<0.05 was considered statistically significant. All statistical analyses were performed with SPSS version 22.0 (IBM Co., Armonk, NY, USA).
METHODS
- Baseline characteristics of the participants and comparison of serum levels of RSPO1 in relation to obesity, insulin resistance, and DM
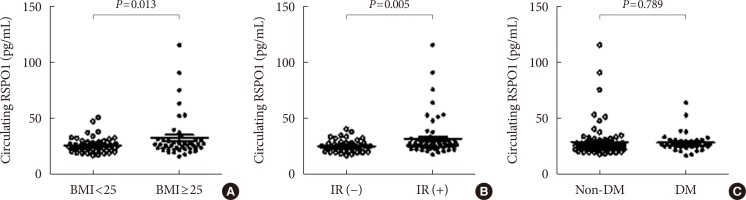
- We enrolled both healthy control subjects and drug-naïve patients with newly diagnosed DM to evaluate the role of serum RSPO1 in humans. We measured serum levels of RSPO1 in all participants, and the clinical parameters of the 122 participants enrolled in the study are presented in Table 1. The proportion of male participants was 44.3%. The study population had a mean age of 50.6±11.8 years, mean BMI of 24.9±4.0 kg/m2, mean fasting serum glucose level of 126.5±54.2 mg/dL, and mean HbA1c of 6.4%±2.0%. We compared the serum levels of RSPO1 in relation to obesity, insulin resistance, and DM (Fig. 1). Serum levels of RSPO1 were significantly different between the lean group (BMI <25 kg/m2) and obese group (BMI ≥25 kg/m2) with values of 53.0±12.2 and 66.2±39.0 pg/mL, respectively (Fig. 1A). In addition, we divided all participants into an insulin-resistant group (HOMA-IR ≥2.5) and insulin-sensitive (HOMA-IR <2.5) group, and compared the serum levels of RSPO1 between the two groups. Serum levels of RSPO1 were significantly higher in the insulin-resistant group (63.4±32.6 pg/mL) than in the insulin-sensitive group (50.4±9.8 pg/mL) (Fig. 1B). To investigate the exact relationship of serum levels of RSPO1 and diabetes, we also compared the metabolic parameters and serum levels of RSPO1 between non-DM subjects and DM patients (Table 1). Although fasting glucose levels, fasting insulin levels, fasting C-peptide levels, HOMA-IR index, and HOMA-β index was significantly increased in DM patients compared to in non-DM subjects, there were no significant differences between non-diabetic participants (58.0±29.8 pg/mL) and diabetic participants (56.8±16.2 pg/mL) (Fig. 1C). Moreover, we compared diverse metabolic parameters among non-obese group, obese group, and DM patients (Table 1). Interestingly, serum levels of RSPO1 were significantly increased in obese subjects compared to in non-obese subjects. However, there was no association of circulating RSPO1 levels with diabetes (Table 1).
- Relationships between circulating RSPO1 levels and metabolic parameters
- The relationships between metabolic parameters and serum levels of RSPO1 were investigated using correlation analyses. First, we investigated the association between serum levels of RSPO1 and a range of clinical parameters including BMI, fasting glucose, fasting C-peptide, HbA1c, HOMA-IR, HOMA-β, lipid profile, liver enzymes, and hsCRP in all participants (Table 2). Interestingly, increased serum levels of RSPO1 were positively correlated with BMI (r=0.244, P=0.010), fasting C-peptide (r=0.244, P=0.007), post-prandial glucose (r=0.194, P=0.039), HOMA-IR (r=0.311, P=0.001), TG (r=0.198, P=0.031), apolipoprotein B (r=0.456, P=0.005), ALT (r=0.234, P=0.010), and hsCRP (r=0.320, P=0.004) (Table 2). In addition, there was a significant negative correlation between RSPO1 level and HDL-C (r=−0.199, P=0.032). However, RSPO1 level was not associated with serum fasting glucose (r=−0.108, P=0.237) or HbA1C (r=0.098, P=0.285) levels (Table 2). Most of the parameters significantly related to serum levels of RSPO1 in correlation analyses were factors associated with DM including obesity, insulin resistance, and insulin secretion. Therefore, we investigated the correlations of serum levels of RSPO1 with a range of metabolic parameters in relation to the obesity in non-diabetic patients. Interestingly, RSPO1 levels were positively correlated with BMI (r=0.343, P=0.005), fasting C-peptide (r=0.266, P=0.019), fasting insulin (r=0.256, P=0.023), HOMA-IR (r=0.367, P=0.001), HOMA-β (r=0.238, P=0.035), ALT (r=0.268, P=0.018), and hsCRP (r=0.300, P=0.015) in non-diabetic participants. In addition, they were significantly negatively correlated with HDL-C (r=−0.253, P=0.027) in non-diabetic participants (Table 2). Additionally, we performed the correlation analysis in relation to obesity in non-diabetic participants. Non-obese subjects revealed the positive correlation of serum levels of RSPO1 and BMI (r=0.242, P=0.014); however, other parameters showed no significance with serum levels of RSPO1. Obese subjects revealed the positive correlation of serum levels of RSPO1 and BMI (r=0.407, P=0.017), fasting C-peptide (r=0.347, P=0.048), Apo-lipoprotein B (r=0.714, P=0.047), and ALT (r=0.337, P=0.031). We also investigated the correlations of serum levels of RSPO1 with a range of metabolic parameters in relation to the presence of DM. However, there were no significant relationships between RSPO1 levels and metabolic parameters in diabetic patients.
- Comparison of metabolic parameters between the low and high RSPO1 groups among non-diabetic participants
- Serum levels of RSPO1 were associated with obesity and insulin resistance, but the results of correlation analyses revealed significant associations of RSOP1 with metabolic parameters only in non-diabetic patients. To determine the contribution of serum RSPO1 to insulin resistance, we compared a range of metabolic parameters between the low and high RSPO1 groups of non-diabetic subjects. The participants were divided into two groups according to the median RSPO1 level in total patients. The clinical characteristics of the two groups are shown in Table 3. BMI and HOMA-IR index were significantly higher in the high RSPO1 group than in the low RSPO1 group (Table 3). In addition, ALT levels were significantly elevated in the high RSPO1 group compared to the low RSPO1 group.
RESULTS
- We identified novel associations between serum RSPO1 and human obesity and insulin resistance. We explored the potential involvement of upregulation of circulating RSPO1 in metabolic diseases in humans. In addition, we demonstrated that serum levels of RSPO1 were positively correlated with obesity and insulin resistance in non-diabetic subjects.
- Our results are not consistent with the previously described mechanism of action of RSPO1 in vitro and in vivo [1623]. The major source of RSPOs is unknown [24], but there has been a great deal of research interest in the action of RSPOs in enhancing Wnt signaling, which plays important roles in the development and pathogenesis of various diseases [25]. A previous study in transgenic mice expressing human RSPO1 suggested that human RSPO1 is a thrombospondin domain-containing protein expressed in epithelial cells in various tissues [26]. The authors reported that transgenic mice overexpressing RSPO1 exhibited proliferation of intestinal crypt epithelial cells through upregulation of Wnt signaling. Interestingly, RSPO1 was expressed in epithelial cells of other organs such as renal tubules, adrenal glands, and pancreas. Recent studies have suggested that RSPOs stimulate Wnt-dependent stem cells to maintain tissue homeostasis [27]. Moreover, previous studies have demonstrated the importance of RSPOs in multiple cancer types and have suggested the potential utility of the therapeutic targeting of tumor-derived RSPO regulating Wnt signaling and tumorigenesis [2829]. However, there have been few reports on the RSPO-LGR signaling axis in metabolic disease.
- Here, we demonstrated that serum levels of RSPO1 were positively correlated with fasting C-peptide level, a marker of insulin secretion, and that RSPO1 levels were positively correlated with obesity and insulin resistance in human subjects. Serum levels of RSPO1 were significantly increased not only in the obese group but also in the insulin-resistant group compared to the controls. Furthermore, these results were observed in non-diabetic participants, while there were no such correlations of RSPO1 with metabolic parameters in patients with DM. Our observations suggested that, in humans, serum RSPO1 plays distinct roles in the maintenance of insulin sensitivity in non-diabetic subjects, but not in diabetic patients with disruption of glucose homeostasis.
- We examined the reasons for the links between serum levels of RSPO1 and obesity and insulin resistance in humans. Although the source of RSPOs is unknown, an in vivo study showed that RSPO1 was expressed in hypothalamic energy homeostatic areas [15]. Under fasting conditions, hypothalamic expression levels of RSPO1 were significantly decreased, and increased in a manner dependent on insulin secretion in response to elevated glucose levels [15]. Few studies have examined the role of RSPO1 in β-cell physiology. A previous report regarding the action of RSPO1 in metabolic homeostasis showed that it is expressed in both MIN6 β-cells and mouse islets, and that it stimulates the proliferation and insulin secretion by β-cells [16]. A recent study by Huch et al. [23] also suggested that the Wnt-RSPO1 axis is activated upon pancreas injury via upregulation of the expansion of pancreas progenitor cells. These reports supported the suggestion that RSPO1 regulates insulin secretion. Our results indicated positive correlations of serum levels of RSPO1 with insulin secretion, insulin resistance, and obesity in nondiabetic participants, but no such correlations were observed in diabetic patients. These differences in patterns of RSPO1 effects in humans compared to mice may be due to a compensatory mechanism to maintain glucose homeostasis. In non-diabetic patients, increases in adiposity may induce increases in serum RSPO1, which acts as an anorexigenic hormone and insulin secretory ligands by a compensatory mechanism to maintain glucose homeostasis. However, in diabetic conditions, the compensatory mechanism of action of RSPO1 may be downregulated in response to extremely high glucose levels, as there are other many regulators of Wnt signaling in adipogenesis [30].
- Although, we did not evaluate the relationship between RSPO1 level and visceral adiposity, the serum levels of RSPO1 showed significant positive correlations with levels of TG, apolipoprotein B, and hsCRP. Moreover, serum levels of RSPO1 were negatively correlated with LDL-C level. There was no direct link between RSPO1 and adipogenesis, but our findings were supported by a previous report regarding the role of LGR4, the main receptor for RSPO1, in adipogenesis [17]. The authors suggested that LGR4 is necessary to maintain energy expenditure via remodeling of brown adipose tissue and explored the upregulation of LGR4 significantly related to human obesity [17]. They divided a large cohort into an obese group and a lean group based on BMI, and observed a greater increased in the prevalence of LGR4 somatic mutation in the obese group compared to the lean group study. Moreover, they showed that the levels of LGR4 expression in human intra-adipose tissue and subcutaneous tissue were increased to a greater extent in the obese group compared to the lean group. Our study did not validate the expression of LGR4 and RSPO1 in adipose tissue, but increases in serum RSPO1 may activate LGR4, a strong binding receptor for RSPO1, in adipose tissue, and may contribute to human obesity.
- Our study had several limitations. First, our sample size was small and further large-scale studies will be necessary to validate the distinct role of RSPO1 in relation to glucose levels. Second, we only investigated plasma levels of RSPO1 as a regulator in Wnt signaling, and therefore measurements of other molecules affecting Wnt signaling will be necessary to determine the mechanism of action RSPO1 in regulating insulin resistance. In addition, we could not validate the expression of RSPO1 in multiple organs, including the pancreas, adipose tissue, and brain, so the major source of RSPO1 remains unclear. Finally, follow-up studies after body weight loss or regulation of glucose levels via drug treatments to examine the associations of RSPO1 with human adiposity and insulin resistance are necessary.
- In conclusion, the results of this study demonstrated the associations of serum levels of RSPO1 with human obesity and insulin resistance. Although the precise contribution and mechanism are not yet clear, our results suggest that serum RSPO1 reflects insulin resistance in non-diabetic patients and may play a pivotal role in regulation of obesity-induced insulin resistance.
DISCUSSION
-
Acknowledgements
- This research was supported by the National Research Foundation of Korea (NRF) funded by the Ministry of Science, ICT & Future Planning (NRF-2017R1D1A1B03027820) and the Korean Government (NRF-2016R1D1A1A09916900).
ACKNOWLEDGMENTS
-
CONFLICTS OF INTEREST: No potential conflict of interest relevant to this article was reported.
-
AUTHOR CONTRIBUTIONS:
NOTES
- 1. Logan CY, Nusse R. The Wnt signaling pathway in development and disease. Annu Rev Cell Dev Biol 2004;20:781-810. ArticlePubMed
- 2. Mammoto T, Ingber DE. Mechanical control of tissue and organ development. Development 2010;137:1407-1420. ArticlePubMedPMCPDF
- 3. Tolwinski NS, Wehrli M, Rives A, Erdeniz N, DiNardo S, Wieschaus E. Wg/Wnt signal can be transmitted through arrow/LRP5,6 and Axin independently of Zw3/Gsk3beta activity. Dev Cell 2003;4:407-418. PubMed
- 4. Clevers H. Wnt/beta-catenin signaling in development and disease. Cell 2006;127:469-480. ArticlePubMed
- 5. Saxena R, Gianniny L, Burtt NP, Lyssenko V, Giuducci C, Sjogren M, Florez JC, Almgren P, Isomaa B, Orho-Melander M, Lindblad U, Daly MJ, Tuomi T, Hirschhorn JN, Ardlie KG, Groop LC, Altshuler D. Common single nucleotide polymorphisms in TCF7L2 are reproducibly associated with type 2 diabetes and reduce the insulin response to glucose in nondiabetic individuals. Diabetes 2006;55:2890-2895. ArticlePubMedPDF
- 6. Jin T, Liu L. The Wnt signaling pathway effector TCF7L2 and type 2 diabetes mellitus. Mol Endocrinol 2008;22:2383-2392. PubMed
- 7. Wright WS, Longo KA, Dolinsky VW, Gerin I, Kang S, Bennett CN, Chiang SH, Prestwich TC, Gress C, Burant CF, Susulic VS, MacDougald OA. Wnt10b inhibits obesity in ob/ob and agouti mice. Diabetes 2007;56:295-303. ArticlePubMedPDF
- 8. Longo KA, Wright WS, Kang S, Gerin I, Chiang SH, Lucas PC, Opp MR, MacDougald OA. Wnt10b inhibits development of white and brown adipose tissues. J Biol Chem 2004;279:35503-35509. ArticlePubMed
- 9. Kanazawa A, Tsukada S, Sekine A, Tsunoda T, Takahashi A, Kashiwagi A, Tanaka Y, Babazono T, Matsuda M, Kaku K, Iwamoto Y, Kawamori R, Kikkawa R, Nakamura Y, Maeda S. Association of the gene encoding wingless-type mammary tumor virus integration-site family member 5B (WNT5B) with type 2 diabetes. Am J Hum Genet 2004;75:832-843. ArticlePubMedPMC
- 10. Fuster JJ, Zuriaga MA, Ngo DT, Farb MG, Aprahamian T, Yamaguchi TP, Gokce N, Walsh K. Noncanonical Wnt signaling promotes obesity-induced adipose tissue inflammation and metabolic dysfunction independent of adipose tissue expansion. Diabetes 2015;64:1235-1248. ArticlePubMedPDF
- 11. Clevers H, Nusse R. Wnt/β-catenin signaling and disease. Cell 2012;149:1192-1205. ArticlePubMed
- 12. Glinka A, Dolde C, Kirsch N, Huang YL, Kazanskaya O, Ingelfinger D, Boutros M, Cruciat CM, Niehrs C. LGR4 and LGR5 are R-spondin receptors mediating Wnt/β-catenin and Wnt/PCP signalling. EMBO Rep 2011;12:1055-1061. ArticlePubMedPMCPDF
- 13. de Lau WB, Snel B, Clevers HC. The R-spondin protein family. Genome Biol 2012;13:242ArticlePubMedPMC
- 14. Carmon KS, Gong X, Lin Q, Thomas A, Liu Q. R-spondins function as ligands of the orphan receptors LGR4 and LGR5 to regulate Wnt/beta-catenin signaling. Proc Natl Acad Sci U S A 2011;108:11452-11457. PubMedPMC
- 15. Li JY, Chai B, Zhang W, Fritze DM, Zhang C, Mulholland MW. LGR4 and its ligands, R-spondin 1 and R-spondin 3, regulate food intake in the hypothalamus of male rats. Endocrinology 2014;155:429-440. ArticlePubMedPDF
- 16. Wong VS, Yeung A, Schultz W, Brubaker PL. R-spondin-1 is a novel beta-cell growth factor and insulin secretagogue. J Biol Chem 2010;285:21292-21302. PubMedPMC
- 17. Wang J, Liu R, Wang F, Hong J, Li X, Chen M, Ke Y, Zhang X, Ma Q, Wang R, Shi J, Cui B, Gu W, Zhang Y, Zhang Z, Wang W, Xia X, Liu M, Ning G. Ablation of LGR4 promotes energy expenditure by driving white-to-brown fat switch. Nat Cell Biol 2013;15:1455-1463. ArticlePubMedPDF
- 18. Shin MY, Kim JM, Kang YE, Kim MK, Joung KH, Lee JH, Kim KS, Kim HJ, Ku BJ, Shong M. Association between growth differentiation factor 15 (GDF15) and cardiovascular risk in patients with newly diagnosed type 2 diabetes mellitus. J Korean Med Sci 2016;31:1413-1418. ArticlePubMedPMCPDF
- 19. Kang YE, Kim JM, Joung KH, Lee JH, You BR, Choi MJ, Ryu MJ, Ko YB, Lee MA, Lee J, Ku BJ, Shong M, Lee KH, Kim HJ. The roles of adipokines, proinflammatory cytokines, and adipose tissue macrophages in obesity-associated insulin resistance in modest obesity and early metabolic dysfunction. PLoS One 2016;11:e0154003. ArticlePubMedPMC
- 20. Kang YE, Choung S, Lee JH, Kim HJ, Ku BJ. The role of circulating Slit2, the one of the newly batokines, in human diabetes mellitus. Endocrinol Metab (Seoul) 2017;32:383-388. ArticlePubMedPMCPDF
- 21. Kanazawa M, Yoshiike N, Osaka T, Numba Y, Zimmet P, Inoue S. Criteria and classification of obesity in Japan and Asia-Oceania. World Rev Nutr Diet 2005;94:1-12. ArticlePubMed
- 22. American Diabetes Association. (2) Classification and diagnosis of diabetes. Diabetes Care 2015;38(Suppl):S8-S16.ArticlePMCPDF
- 23. Huch M, Bonfanti P, Boj SF, Sato T, Loomans CJ, van de Wetering M, Sojoodi M, Li VS, Schuijers J, Gracanin A, Ringnalda F, Begthel H, Hamer K, Mulder J, van Es JH, de Koning E, Vries RG, Heimberg H, Clevers H. Unlimited in vitro expansion of adult bi-potent pancreas progenitors through the Lgr5/R-spondin axis. EMBO J 2013;32:2708-2721. ArticlePubMedPMC
- 24. Sato T, Clevers H. Growing self-organizing mini-guts from a single intestinal stem cell: mechanism and applications. Science 2013;340:1190-1194. ArticlePubMed
- 25. Welters HJ, Kulkarni RN. Wnt signaling: relevance to beta-cell biology and diabetes. Trends Endocrinol Metab 2008;19:349-355. PubMed
- 26. Kim KA, Kakitani M, Zhao J, Oshima T, Tang T, Binnerts M, Liu Y, Boyle B, Park E, Emtage P, Funk WD, Tomizuka K. Mitogenic influence of human R-spondin1 on the intestinal epithelium. Science 2005;309:1256-1259. ArticlePubMed
- 27. Clevers H, Loh KM, Nusse R. Stem cell signaling. An integral program for tissue renewal and regeneration: Wnt signaling and stem cell control. Science 2014;346:1248012PubMed
- 28. Christodoulides C, Lagathu C, Sethi JK, Vidal-Puig A. Adipogenesis and WNT signalling. Trends Endocrinol Metab 2009;20:16-24. ArticlePubMed
- 29. Bennett CN, Ross SE, Longo KA, Bajnok L, Hemati N, Johnson KW, Harrison SD, MacDougald OA. Regulation of Wnt signaling during adipogenesis. J Biol Chem 2002;277:30998-31004. ArticlePubMed
- 30. Prestwich TC, Macdougald OA. Wnt/beta-catenin signaling in adipogenesis and metabolism. Curr Opin Cell Biol 2007;19:612-617. PubMedPMC
REFERENCES
Comparison of R-spondin 1 (RSPO1) levels in human in relation to diverse metabolic parameters. (A) Comparison of RSPO1 levels between lean group and obese group. (B) Comparison of RSPO1 levels between insulin-sensitive group and insulin resistant group (IR). (C) Comparison of RSPO1 levels between non-diabetic participants and diabetic participants. BMI, body mass index; DM, diabetes mellitus.
Characteristics of participants and the association of serum levels of RSPO1 with obesity and DM
Values are presented as mean±standard deviation or numbers of participants.
RSPO1, R-spondin 1; DM, diabetes mellitus; BMI, body mass index; SBP, systolic blood pressure; DBP, diastolic blood pressure; HbA1c, glycosylated hemoglobin; HOMA-IR, homeostasis model assessment of insulin resistance; HOMA-β, homeostasis model assessment of β-cell; TG, triglyceride; TC, total cholesterol; LDL-C, low density lipoprotein cholesterol; HDL-C, high density lipoprotein cholesterol; AST, aspartate aminotransferase; ALT, alanine aminotransferase; hsCRP, high-sensitivity C-reactive protein.
aP value from unpaired t-test for continuous parametric variables and Mann-Whitney U test for nonparametric variables between non-DM subjects and DM patients, bP value from analysis of variance (ANOVA) analysis for continuous parametric variables and Mann-Whitney U test for nonparametric variables among non-obese subjects, obese subjects, and DM patients, cP<0.05 obese subjects or DM patients versus non-obese subjects, dP<0.05 obese subjects versus DM patients.
Correlation analysis between serum RSPO1 level and diverse parameters in relation to obesity and DM
RSPO1, R-spondin 1; DM, diabetes mellitus; BMI, body mass index; HbA1c, glycosylated hemoglobin; HOMA-IR, homeostasis model assessment of insulin resistance; HOMA-β, homeostasis model assessment of β-cell; TG, triglyceride; TC, total cholesterol; LDL-C, low density lipoprotein cholesterol; HDL-C, high density lipoprotein cholesterol; AST, aspartate aminotransferase; ALT, alanine aminotransferase; hsCRP, high-sensitivity C-reactive protein.
aCoefficients (r) were calculated using Spearman's method, bP<0.05, cP<0.01.
Comparison of metabolic parameters of study population by serum RSPO1 levels in non-DM participants
Values are presented as mean±standard deviation. P value from unpaired t-test for continuous parametric variables and Mann-Whitney U test for nonparametric variables.
RSPO1, R-spondin 1; DM, diabetes mellitus; BMI, body mass index; SBP, systolic blood pressure; DBP, diastolic blood pressure; HbA1c, glycosylated hemoglobin; HOMA-IR, homeostasis model assessment of insulin resistance; HOMA-β, homeostasis model assessment of β-cell; TG, triglyceride; TC, total cholesterol; LDL-C, low density lipoprotein cholesterol; HDL-C, high density lipoprotein cholesterol; AST, aspartate aminotransferase; ALT, alanine aminotransferase; hsCRP, high-sensitivity C-reactive protein.
Figure & Data
References
Citations
- LGR4: A New Receptor Member in Endocrine and Metabolic Diseases
Ningning Zhang, Mingyang Yuan, Jiqiu Wang
Endocrine Reviews.2023; 44(4): 647. CrossRef - R-Spondin1 and tumor necrosis factor-alpha in infertile women with polycystic ovary syndrome: relationships with insulin resistance and other parameters
Tuğba GÜRBÜZ, Oya GÖKMEN, Asena AYAR MADENLİ, Berna DİLBAZ
Journal of Health Sciences and Medicine.2023; 6(2): 449. CrossRef - An early prediction model for type 2 diabetes mellitus based on genetic variants and nongenetic risk factors in a Han Chinese cohort
Jinjin Li, Qun Ye, Hongxiao Jiao, Wanyao Wang, Kai Zhang, Chen Chen, Yuan Zhang, Shuzhi Feng, Ximo Wang, Yubao Chen, Huailin Gao, Fengjiang Wei, Wei-Dong Li
Frontiers in Endocrinology.2023;[Epub] CrossRef - Emerging Therapeutic Strategies for Attenuating Tubular EMT and Kidney Fibrosis by Targeting Wnt/β-Catenin Signaling
Lichao Hu, Mengyuan Ding, Weichun He
Frontiers in Pharmacology.2022;[Epub] CrossRef - Does Serum R-Spondin-1 Play a Role in PCOS Pathophysiology?
Osman BAŞPINAR, Yasin ŞİMŞEK, Derya KOÇER, Oğuzhan Sıtkı DİZDAR, Hatice KAYIŞ TOPALOĞLU
Genel Tıp Dergisi.2022; 32(5): 490. CrossRef - Silencing of RSPO1 mitigates obesity-related renal fibrosis in mice by deactivating Wnt/β-catenin pathway
Xuesong Su, Guangyu Zhou, Mi Tian, Si Wu, Yanqiu Wang
Experimental Cell Research.2021; 405(2): 112713. CrossRef - Exosome miR‐27a‐3p secreted from adipocytes targets ICOS to promote antitumor immunity in lung adenocarcinoma
Xuehan Fan, Jingya Wang, Tingting Qin, Yujia Zhang, Wenting Liu, Kaiting Jiang, Dingzhi Huang
Thoracic Cancer.2020; 11(6): 1453. CrossRef - Integrative Analyses of Genes Associated with Subcutaneous Insulin Resistance
Manoj Kumar Pujar, Basavaraj Vastrad, Chanabasayya Vastrad
Biomolecules.2019; 9(2): 37. CrossRef
 PubReader
 Cite
Cite


