- Current
- Browse
- Collections
-
For contributors
- For Authors
- Instructions to authors
- Article processing charge
- e-submission
- For Reviewers
- Instructions for reviewers
- How to become a reviewer
- Best reviewers
- For Readers
- Readership
- Subscription
- Permission guidelines
- About
- Editorial policy
Articles
- Page Path
- HOME > Diabetes Metab J > Volume 41(4); 2017 > Article
-
Original ArticleClinical Care/Education Comparison of Glucose Area Under the Curve Measured Using Minimally Invasive Interstitial Fluid Extraction Technology with Continuous Glucose Monitoring System in Diabetic Patients
-
Mei Uemura1, Yutaka Yano1
 , Toshinari Suzuki2, Taro Yasuma3, Toshiyuki Sato4, Aya Morimoto4, Samiko Hosoya4, Chihiro Suminaka4, Hiromu Nakajima5, Esteban C. Gabazza3, Yoshiyuki Takei6
 -
Diabetes & Metabolism Journal 2017;41(4):265-274.
DOI: https://doi.org/10.4093/dmj.2017.41.4.265
Published online: July 31, 2017
1Department of Diabetes, Metabolism and Endocrinology, Mie University Graduate School of Medicine, Tsu, Japan.
2Department of Diabetes and Endocrinology, Mie University Hospital, Tsu, Japan.
3Department of Immunology, Mie University Graduate School of Medicine, Tsu, Japan.
4Central Research Laboratories, Sysmex Corporation, Kobe, Japan.
5Osaka Medical Center for Cancer and Cardiovascular Diseases, Osaka, Japan.
6Department of Gastroenterology and Hepatology, Mie University Graduate School of Medicine, Tsu, Japan.
- Corresponding author: Yutaka Yano. Department of Diabetes, Metabolism and Endocrinology, Mie University Graduate School of Medicine, 2-174 Edobashi, Tsu 514-8507, Japan. yanoyuta@clin.medic.mie-u.ac.jp
Copyright © 2017 Korean Diabetes Association
This is an Open Access article distributed under the terms of the Creative Commons Attribution Non-Commercial License (http://creativecommons.org/licenses/by-nc/4.0/) which permits unrestricted non-commercial use, distribution, and reproduction in any medium, provided the original work is properly cited.
ABSTRACT
-
Background
- Continuous glucose monitoring (CGM) is reported to be a useful technique, but difficult or inconvenient for some patients and institutions. We are developing a glucose area under the curve (AUC) monitoring system without blood sampling using a minimally invasive interstitial fluid extraction technology (MIET). Here we evaluated the accuracy of interstitial fluid glucose (IG) AUC measured by MIET in patients with diabetes for an extended time interval and the potency of detecting hyperglycemia using CGM data as a reference.
-
Methods
- Thirty-eight inpatients with diabetes undergoing CGM were enrolled. MIET comprised a pretreatment step using a plastic microneedle array and glucose accumulation step with a hydrogel patch, which was placed on two sites from 9:00 AM to 5:00 PM or from 10:00 PM to 6:00 AM. IG AUC was calculated by accumulated glucose extracted by hydrogel patches using sodium ion as standard.
-
Results
- A significant correlation was observed between the predicted AUC by MIET and CGM in daytime (r=0.76) and nighttime (r=0.82). The optimal cutoff for the IG AUC value of MIET to predict hyperglycemia over 200 mg/dL measured by CGM for 8 hours was 1,067.3 mg·hr/dL with 88.2% sensitivity and 81.5% specificity.
-
Conclusion
- We showed that 8-hour IG AUC levels using MIET were valuable in estimating the blood glucose AUC without blood sampling. The results also supported the concept of using this technique for evaluating glucose excursion and for screening hyperglycemia during 8 hours in patients with diabetes at any time of day.
- One of the most important goals of the current management of patients with diabetes mellitus is to lower glycosylated hemoglobin (HbA1c) levels [12]. Previous studies demonstrated that the risk of microvascular complications was decreased in patients with decreased HbA1c levels [34]. Moreover, recent clinical studies have found that postprandial hyperglycemia is also associated with the development of macrovascular complications in patients with type 1 and type 2 diabetes mellitus [56]. Therefore, it is important to control overall blood glucose excursions over time and maintain favorable HbA1c levels to reduce the risk of macrovascular and microvascular complications [78].
- Continuous glucose monitoring (CGM) and self-monitoring of blood glucose (SMBG) are routinely used to record variations in blood glucose levels [9]. CGM provides data on changes in blood glucose levels by recording them over several days. It is without doubt that proper understanding and normalization of blood glucose profiles over time are important for the intensive management of diabetes mellitus; however, frequent SMBG or CGM could be burdensome for some patients in terms of pain and inconvenience. Flash glucose monitoring was recently developed from CGM [10]. Real-time monitoring during 2 weeks is possible using this method. However, sensor insertion is difficult and causes discomfort in the patients [10]. To mitigate this problem, we developed a glucose area under the curve (AUC) monitoring system using minimally invasive interstitial fluid extraction technology (MIET) [11]. This method allows to obtain glucose AUC without blood sampling and to calculate average glucose level by dividing the interstitial fluid glucose (IG) AUC by the measurement time period [11]. Our previous report demonstrated that IG AUC measured by MIET correlated well with plasma glucose AUC during the 75-g oral glucose tolerance test (OGTT) over 2 hours; thus, MIET can represent IG AUC with the potential of detecting hyperglycemia after glucose loading [12]. In brief, monitoring IG AUC by MIET reflects blood glucose excursion during the monitoring period. Evaluating blood glucose excursion is important for controlling blood glucose and choosing appropriate treatment for patients with diabetes mellitus. The time and magnitude of hyperglycemia is particularly difficult to point out by SMBG and HbA1c. Previous studies showed its usefulness in evaluating IG AUC for short term (2 to 4 hours) [13]. In this study, in the patients with diabetes mellitus, we investigated whether extended time (8 hours) monitoring can be useful and accurate for IG AUC measurements by MIET compared with glucose AUC using CGM as a reference during daytime and nighttime periods.
INTRODUCTION
- Patients
- This study consisted of 38 inpatients (19 males, 19 females) with diabetes mellitus who were admitted to Mie University Hospital. Diabetes mellitus was diagnosed according to the criteria of the Japan Diabetes Society (JDS) [2]. All subjects were on JDS recommended dietary therapy (total energy 25 to 30 kcal/kg of body weight). One or 2 weeks later after admission, all patients underwent therapy as indicated in Table 1. The Mie University's Review Board for human investigations approved the study protocol, and the investigation was conducted following the principles of the latest version of the Declaration of Helsinki (2013). Written informed consent was obtained from all patients before the beginning of the study. All patients were randomly assigned to each group for daytime or nighttime analysis. Eight patients undertook the study during daytime (from 9:00 AM to 5:00 PM) and 30 patients at night (from 10:00 AM to 6:00 AM).
- Five patients were excluded from the analyses (two patients due to CGM and three patients due to MIET). The reasons for these exclusions included lack of CGM recording during nighttime due to the failure of CGM glucose sensor, blood glucose levels over the upper limit (400 mg/dL) of CGM during daytime, and significantly lower IG AUC measured by MIET than the glucose AUC measured by CGM due to overnight peritoneal dialysis. This phenomenon may be related to osmotic pressure alterations in interstitial fluid (ISF) caused by peritoneal dialysis. Further studies are necessary to clarify the relationship between the performance of MIET and peritoneal dialysis. Two out of four gel patches were removed from the skin and were then lost. In another two patients, one gel patch showed measurement error, and another was over the concentration limit of Na+ [1112]. Data from six gel patches were excluded due to over the limit concentrations of Na+ [1112]. Finally, we analyzed seven patients and 13 gel patch measurements during the daytime period and 26 patients with 48 gel patch measurements during the nighttime period. The backgrounds of 33 patients are shown in Table 1. One patient was treated with dietary therapy alone. Seven patients were treated with oral hypoglycemic agents alone. One patient was treated with glucagon-like peptide-1 receptor agonist with sulfonylurea and biguanide. Fourteen patients received insulin therapy alone, whereas 10 patients received insulin in combination with oral hypoglycemic agents. Chronic kidney disease patients as defined according to definition by the Japanese Society of Nephrology [14] are shown in Table 1. The estimated glomerular filtration rate (eGFR) of seven cases was <60 mL/min/1.73 m2 and the eGFR of three cases was <30 mL/min/1.73 m2.
- General testings
- Blood was sampled from all patients from an antecubital vein in the early morning after overnight fasting and after resting for 30 minutes in supine position. Blood pressure was measured while at rest in the supine position. HbA1c levels were measured by high-performance liquid chromatography, and the value of HbA1c (%) was expressed according to the National Glycohemoglobin Standardization Program. The serum levels of Na+ were measured by ion-selective electrode methods.
- CGM measurements
- Blood glucose levels were measured for two consecutive days by CGM (CGMS-gold; Medtronic Minimed, Northridge, CA, USA) with SMBG using portable blood glucose meters (One Touch UltraVue; Johnson & Johnson, Tokyo, Japan). We evaluated the 8-hour glucose AUC using MIET and CGM. Moreover, we evaluated several CGM-related parameters [9]. Mean glucose levels, standard deviations (SDs) and coefficient of variation (CV) were calculated for all glucose data for 8 hours [9]. The mean amplitude of glucose excursion (MAGE) was calculated as the arithmetic mean of the differences between consecutive blood glucose peaks and nadirs provided that the differences are greater than one SD of the mean glucose value. M value was calculated with following formula: ∑ |10×log (blood glucose/100)|3/n, and the J index was calculated as follows: 0.001 (mean blood glucose+SD)2 [151617].
- MIET measurements
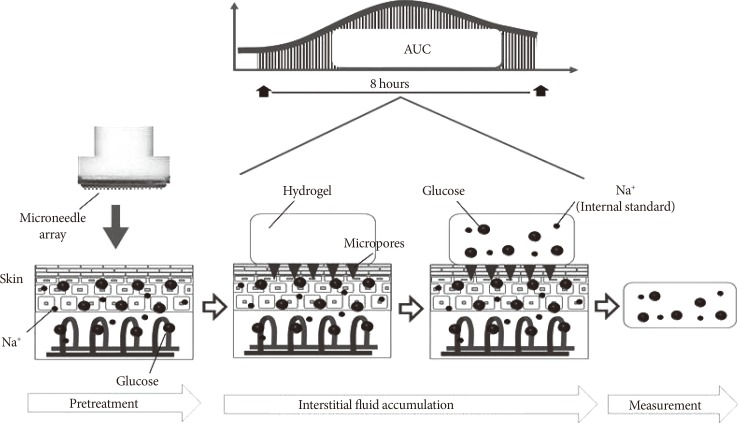
- Glucose AUC was analyzed using data obtained on the second day after starting CGM. As previously reported [11], the MIET measurement was performed according to the following procedure: (1) wiping of forearm skin with cotton and antiseptic; (2) pretreatment of the wiped skin area with microneedle arrays and attachment of hydrogel patches (two patches on each of the pretreated areas for ISF accumulation and on the untreated areas for sweat detection) on both forearms; (3) allowing glucose accumulation over 8 hours (from 9:00 AM to 5:00 PM for the daytime period or from 10:00 PM to 6:00 AM for the nighttime period); (4) removal of attached hydrogel patches and storage in the cooler box; (5) measurement of glucose and Na+ levels in the hydrogel patches; and (6) determination of glucose AUC using measured glucose and Na+ levels. Apparatus and materials were prepared and used as previously described [11]. The process of MIET is described in Fig. 1.
- Statistical analysis
- Data are expressed as mean±SD. The distribution of SD [15], CV [15], MAGE [15], and M values [1517] was skewed and expressed as median and interquartile ranges. After the log transformation of SD (log-SD), CV (log-CV), MAGE (log-MAGE), and M values (log-M value), the relationship of MIET AUC with clinical and CGM-related parameters was evaluated by univariate regression analyses in patients with diabetes mellitus. The receiver operating characteristics (ROCs) curves were constructed to evaluate whether MIET can detect glucose levels over 200 mg/dL measured using CGM. The sensitivity and specificity of MIET AUC was calculated using glucose level measured by CGM. A P<0.05 was considered as statistically significant. Statistical analyses were performed using the SPSS version 22.0 for Windows (IBM Co., Armonk, NY, USA) and the MedCalc version 11.2.0 (MedCalc Software, Ostend, Belgium).
METHODS
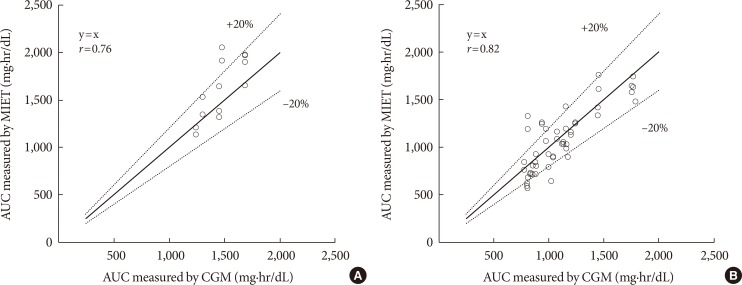
- The univariate analysis showed a significant correlation between the glucose AUC measured by CGM and IG AUC measured by MIET for 8 hours during daytime (r=0.76, n=7) (Fig. 2A). The reproducibility of MIET was 6.2%. The mean percentage error of the regression analysis was 13.6%. Moreover, there was a significant correlation between the glucose AUC calculated from CGM and IG AUC from MIET for 8 hours at night (r=0.82, n=26) (Fig. 2B). The reproducibility of MIET was 5.7%. The mean percentage error of the regression analysis was 19.7%. These data are consistent with those previously performed for 2 hours during OGTT or after a meal [131819].
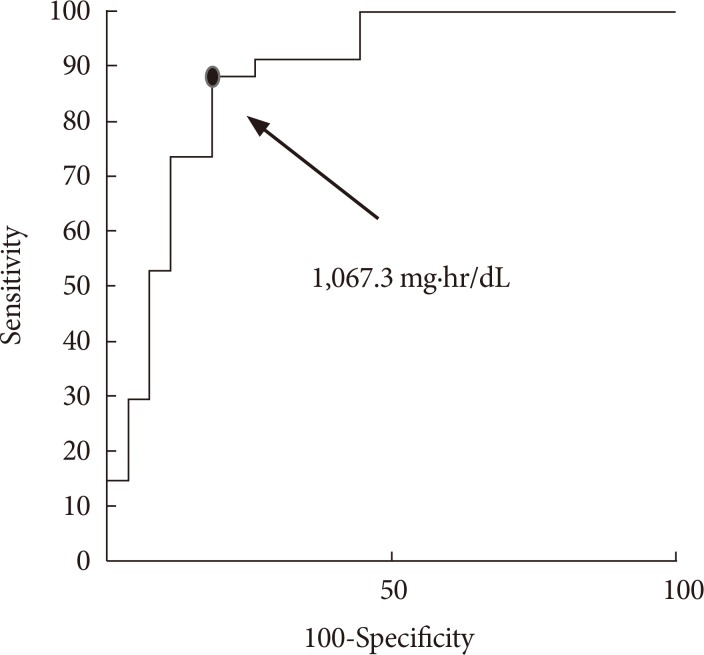
- Next, we calculated the specificity and sensitivity of MIET for hyperglycemia (>200 mg/dL) using the ROC curve (Fig. 3). The area under the ROC curve showed a positive discrimination threshold for MIET AUC (AUC=0.88; SE=0.047; 95% confidence interval, 0.772 to 0.949; P<0.0001) of glucose level over 200 mg/dL by CGM in all cases (Fig. 3). The optimal cutoff value maximizing the sum of sensitivity and specificity of MIET AUC to predict over 200 mg/dL was 1,067.3 mg·hr/dL (sensitivity of 88.2% and specificity of 81.5%). In these patients, the positive predictive value was 85.7% and negative predictive value was 84.6%. These data nearly reached the cutoff value (1,019.0 mg·hr/dL) calculated based on the ROC curve with the maximization of the sum of sensitivity and specificity (sensitivity of 94.7% and specificity of 78.6%) from the CGM data.
- We also analyzed the correlation between CGM-related parameters and IG AUC measured by MIET (Tables 2 and 3). IG AUC calculated from MIET significantly correlated with SD (r=0.350), MAGE (r=0.409), M value (r=0.844), and J index (r=0.848), which are known to reflect blood glucose fluctuations.
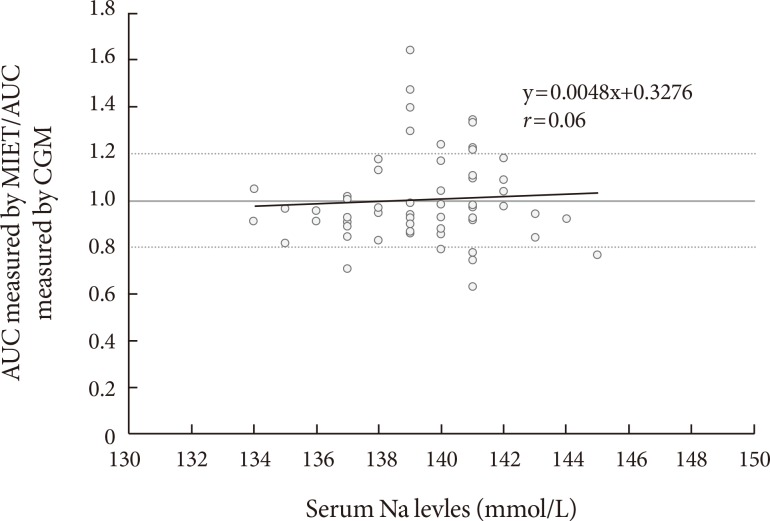
- MIET uses Na+ as an internal standard to calibrate sampling variations. In this calibration, Na+ in ISF should be constant among individuals. Therefore, variations in serum Na+ levels might influence the performance of MIET in these patients. In this study, there was no correlation between serum Na+ levels and MIET performance in a limited serum Na range (r=0.06) (Fig. 4).
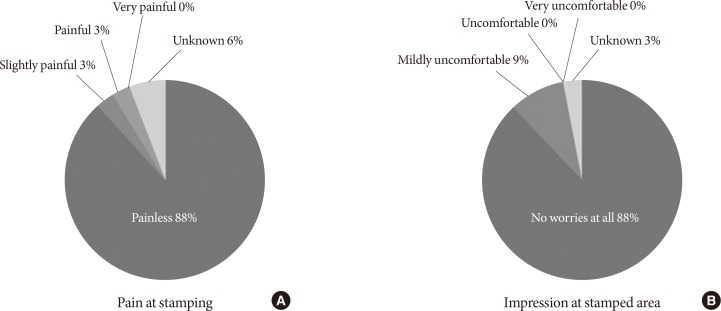
- Finally, the response of the patients to a questionnaire confirmed that the technique was not painful and that patients were not worried about impressions on the sampled areas. Most of the patients felt no pain and no discomfort during sampling (Fig. 5).
RESULTS
- Correlation of day and night glucose AUC measured by CGM and IG AUC measured by MIET in patients with diabetes mellitus
- In this study, we evaluated the performance of MIET for 8 hours with a patch for the determination of IG AUC. Glucose profiles for 8 hours during the day corresponded to glucose excursions after breakfast and lunch. At night, they corresponded to the glucose excursions during sleep. MIET, which does not require blood sampling, may provide a better understanding of glycemic patterns, which are usually difficult to evaluate from either SMBG or HbA1c. SMBG may not show marked glucose excursion during the 24-hour glucose profile [20]. Generally, HbA1c levels reflect the mean glucose levels for periods as long as 3 months [21] but do not reflect short-term acute glucose excursion [2223]. CGM is most useful to monitor glucose excursion for several days. However, frequent CGM can be burdensome for patients. We have previously evaluated IG AUC for 2 to 4 hours using this system [11131819] and found that this system was useful in detecting plasma glucose excursion and peak plasma glucose levels after 75-g OGTT [1218]. We first applied this system to measure IG AUC for 8 hours. In this study, good correlation was first confirmed between glucose AUC measured by CGM and IG AUC measured by MIET during the daytime and nighttime periods in patients with diabetes mellitus.
- Usefulness of MIET to detect hyperglycemia during the day and night
- ROC analysis showed that values over 1,067.3 mg·hr/dL by MIET indicated hyperglycemia of more than 200 mg/dL. These data suggest the MIET can be applied to detect hyperglycemia both during daytime and nighttime periods. Postprandial glucose AUC measured by CGM reflects the elevation of postprandial glucose levels in patients with diabetes mellitus [2324]. Moreover, nocturnal glucose AUC measured by CGM indicated glucose fluctuations during sleep [2526]. Therefore, postprandial and nocturnal hyperglycemia over 200 mg/dL of glucose level can be evaluated by MIET.
- Necessary to develop MIET technology for longer-term measurement
- Evaluating blood glucose excursion using these methods may deliver helpful hints for controlling blood glucose and for deciding appropriate treatment choices for patients with diabetes mellitus. We have already shown the usefulness of the analytical measurement performance using MIET during short-term periods (0.5, 1, 2, and 4 hours) [11131819]. However, there is not enough time to assess glucose profiles and usefulness of treatment by measuring IG AUC by MIET for as long as 8 hours. Treatment efficiency can be monitored using gel patches for longer time periods (12 or 24 hours). This monitoring method of daily glucose excursion appears to be easy and painless for patients. Further studies are needed for evaluating the blood glucose AUC over long-term periods (such as 12 or 24 hours).
- Correlation of IG AUC measured by MIET with the parameters of glucose fluctuation
- IG AUC calculated from MIET significantly correlated with several parameters showing glucose fluctuation such as SD, MAGE, M value, and J index (Table 3). Glucose fluctuations are also known to play a role in the progression of vascular complications by enhancing oxidative stress [27]. Thus, the assessment of glucose fluctuations is essential for improving therapeutic control of blood glucose in patients with diabetes mellitus. However, the association of IG AUC with indicators of glucose fluctuations over long-term periods remains to be clarified.
- Effect of serum Na+ levels on the performance of MIET
- In this study, the effect of serum Na+ levels on IG AUC measured by MIET for 8 hours was limited. Previously, we reported that serum Na+ levels may affect this system [12]. This result may be due to the relatively narrow variation range in serum Na+ levels. The effect of serum Na+ levels was so limited that IG AUC could be measured by MIET for 8 hours in our patients with diabetes mellitus.
- MIET is more easily repeatable and thus it is more convenient than CGM and flash glucose monitoring system. In addition, CGM and flash glucose monitoring are more uncomfortable for the patients than MIET, although MIET cannot provide continuous glucose profiling.
- MIET is also a suitable technique for the detection of AUC, which reflects hyperglycemia over 200 mg/dL and glucose fluctuation without causing discomfort in the patients. In addition, MIET is very useful for the detection of postprandial and nocturnal hyperglycemia at early stages of diabetes with mild hyperglycemia or subjects of impaired glucose tolerance. MIET is also easily repeatable, harmless, and unpainful. In addition, MIET reflects the change of blood glucose during several hours. Therefore, MIET is useful for monitoring marker of blood glucose change during short time in diabetic patients. The easy and repeatable measurement of MIET during the day and night time is also useful for evaluating blood glucose change during diabetes treatment. Based on these observations, we believe that, in addition to HbA1c, IG AUC as measured by MIET is a marker that can be used for blood glucose control in diabetic patients.
- Study limitations
- This study has several limitations. One of the limitations is the small number of the study population. Correlation between IG AUC measured by MIET and glucose AUC measured by CGM and the relationship between IG AUC and parameters of glucose fluctuation should be undertaken in a larger number of subjects to corroborate these findings.
- Conclusions
- IG AUC measured by MIET for 8 hours significantly correlated with glucose AUC measured by CGM in patients with diabetes mellitus. Sensitivity and specificity at concentrations over 200 mg/dL of glucose levels were acceptable in clinical settings. Overall, the results of this study suggest that IG AUC calculated using MIET is useful for detecting hyperglycemia without causing pain in patients with diabetes mellitus.
DISCUSSION
-
Part of this study was presented at a poster session of the 6th and 7th Advanced Technologies and Treatments for Diabetes and conferences held by Japan Diabetes Society.
-
CONFLICTS OF INTEREST: This study was performed by the Minimally Invasive Interstitial Fluid Extraction Technology (MIET) study group, which was sponsored by Sysmex Corporation, Japan. Mei Uemura, Yutaka Yano, Toshinari Suzuki, and Taro Yasuma received research funding from Sysmex. Hiromu Nakajima is a medical advisor for GlaxoSmithKline KK. Toshiyuki Sato, Aya Morimoto, Samiko Hosoya, and Chihiro Suminaka are employees of Sysmex.
NOTES
- 1. American Diabetes Association. 5. Glycemic targets. Diabetes Care 2016;39(Suppl 1):S39-S46. ArticlePubMedPDF
- 2. Committee of the Japan Diabetes Society on the Diagnostic Criteria of Diabetes Mellitus. Committee of, Seino Y, Nanjo K, Tajima N, Kadowaki T, Kashiwagi A, Araki E, Ito C, Inagaki N, Iwamoto Y, Kasuga M, Hanafusa T, Haneda M, Ueki K. Report of the committee on the classification and diagnostic criteria of diabetes mellitus. J Diabetes Investig 2010;1:212-228.ArticlePubMedPMC
- 3. Diabetes Control and Complications Trial Research Group. Nathan DM, Genuth S, Lachin J, Cleary P, Crofford O, Davis M, Rand L, Siebert C. The effect of intensive treatment of diabetes on the development and progression of long-term complications in insulin-dependent diabetes mellitus. N Engl J Med 1993;329:977-986. ArticlePubMed
- 4. Ohkubo Y, Kishikawa H, Araki E, Miyata T, Isami S, Motoyoshi S, Kojima Y, Furuyoshi N, Shichiri M. Intensive insulin therapy prevents the progression of diabetic microvascular complications in Japanese patients with non-insulin-dependent diabetes mellitus: a randomized prospective 6-year study. Diabetes Res Clin Pract 1995;28:103-117. ArticlePubMed
- 5. DECODE Study Group. European Diabetes Epidemiology Group. Is the current definition for diabetes relevant to mortality risk from all causes and cardiovascular and noncardiovas cular diseases? Diabetes Care 2003;26:688-696. ArticlePubMedPDF
- 6. Monnier L, Mas E, Ginet C, Michel F, Villon L, Cristol JP, Colette C. Activation of oxidative stress by acute glucose fluctuations compared with sustained chronic hyperglycemia in patients with type 2 diabetes. JAMA 2006;295:1681-1687. ArticlePubMed
- 7. Esposito K, Giugliano D, Nappo F, Marfella R. Campanian Postprandial Hyperglycemia Study Group. Regression of carotid atherosclerosis by control of postprandial hyperglycemia in type 2 diabetes mellitus. Circulation 2004;110:214-219. ArticlePubMed
- 8. Smith-Palmer J, Brandle M, Trevisan R, Orsini Federici M, Liabat S, Valentine W. Assessment of the association between glycemic variability and diabetes-related complications in type 1 and type 2 diabetes. Diabetes Res Clin Pract 2014;105:273-284. ArticlePubMed
- 9. Rodbard D. Continuous glucose monitoring: a review of successes, challenges, and opportunities. Diabetes Technol Ther 2016;18(Suppl 2):S3-S13.Article
- 10. Bolinder J, Antuna R, Geelhoed-Duijvestijn P, Kroger J, Weitgasser R. Novel glucose-sensing technology and hypoglycaemia in type 1 diabetes: a multicentre, non-masked, randomised controlled trial. Lancet 2016;388:2254-2263. ArticlePubMed
- 11. Sato T, Okada S, Hagino K, Asakura Y, Kikkawa Y, Kojima J, Watanabe T, Maekawa Y, Isobe K, Koike R, Nakajima H, Asano K. Measurement of glucose area under the curve using minimally invasive interstitial fluid extraction technology: evaluation of glucose monitoring concepts without blood sampling. Diabetes Technol Ther 2011;13:1194-1200. ArticlePubMed
- 12. Sakaguchi K, Hirota Y, Hashimoto N, Ogawa W, Hamaguchi T, Matsuo T, Miyagawa J, Namba M, Sato T, Okada S, Tomita K, Matsuhisa M, Kaneto H, Kosugi K, Maegawa H, Nakajima H, Kashiwagi A. Evaluation of a minimally invasive system for measuring glucose area under the curve during oral glucose tolerance tests: usefulness of sweat monitoring for precise measurement. J Diabetes Sci Technol 2013;7:678-688. ArticlePubMedPMCPDF
- 13. Ugi S, Maegawa H, Morino K, Nishio Y, Sato T, Okada S, Kikkawa Y, Watanabe T, Nakajima H, Kashiwagi A. Evaluation of a novel glucose area under the curve (AUC) monitoring system: comparison with the AUC by continuous glucose monitoring. Diabetes Metab J 2016;40:326-333. ArticlePubMedPMCPDF
- 14. Ando Y, Ito S, Uemura O, Kato T, Kimura G, Nakao T, Hattori M, Fukagawa M, Horio M, Mitarai T. Japanese Society of Nephrology. CKD clinical practice guidebook. The essence of treatment for CKD patients. Clin Exp Nephrol 2009;13:191-248. ArticlePubMedPDF
- 15. Service FJ. Glucose variability. Diabetes 2013;62:1398-1404. ArticlePubMedPMCPDF
- 16. Wojcicki JM. “J”-index. A new proposition of the assessment of current glucose control in diabetic patients. Horm Metab Res 1995;27:41-42. ArticlePubMed
- 17. Schlichtkrull J, Munck O, Jersild M. The m-valve, an index of blood-sugar control in diabetics. Acta Med Scand 1965;177:95-102. PubMed
- 18. Sakamoto K, Kubo F, Yoshiuchi K, Ono A, Sato T, Tomita K, Sakaguchi K, Matsuhisa M, Kaneto H, Maegawa H, Nakajima H, Kashiwagi A, Kosugi K. Usefulness of a novel system for measuring glucose area under the curve while screening for glucose intolerance in outpatients. J Diabetes Investig 2013;4:552-559.ArticlePubMedPMCPDF
- 19. Kuranuki S, Sato T, Okada S, Hosoya S, Seko A, Sugihara K, Nakamura T. Evaluation of postprandial glucose excursion using a novel minimally invasive glucose area-under-the-curve monitoring system. J Healthc Eng 2013;4:529-540. ArticlePubMedPDF
- 20. Boland E, Monsod T, Delucia M, Brandt CA, Fernando S, Tamborlane WV. Limitations of conventional methods of self-monitoring of blood glucose: lessons learned from 3 days of continuous glucose sensing in pediatric patients with type 1 diabetes. Diabetes Care 2001;24:1858-1862. PubMed
- 21. Nathan DM, Kuenen J, Borg R, Zheng H, Schoenfeld D, Heine RJ. A1c-Derived Average Glucose Study Group. Translating the A1C assay into estimated average glucose values. Diabetes Care 2008;31:1473-1478. ArticlePubMedPMCPDF
- 22. Sacks DB, Arnold M, Bakris GL, Bruns DE, Horvath AR, Kirkman MS, Lernmark A, Metzger BE, Nathan DM. National Academy of Clinical Biochemistry. Position statement executive summary: guidelines and recommendations for laboratory analysis in the diagnosis and management of diabetes mellitus. Diabetes Care 2011;34:1419-1423. ArticlePubMedPMCPDF
- 23. Suwa T, Ohta A, Matsui T, Koganei R, Kato H, Kawata T, Sada Y, Ishii S, Kondo A, Murakami K, Katabami T, Tanaka Y. Relationship between clinical markers of glycemia and glucose excursion evaluated by continuous glucose monitoring (CGM). Endocr J 2010;57:135-140. ArticlePubMed
- 24. Ando K, Nishimura R, Tsujino D, Seo C, Utsunomiya K. 24-Hour glycemic variations in drug-naive patients with type 2 diabetes: a continuous glucose monitoring (CGM)-based study. PLoS One 2013;8(7):e71102ArticlePubMedPMC
- 25. Sakamoto M, Nishimura R, Irako T, Tsujino D, Ando K, Utsunomiya K. Comparison of vildagliptin twice daily vs. sitagliptin once daily using continuous glucose monitoring (CGM): crossover pilot study (J-VICTORIA study). Cardiovasc Diabetol 2012;11:92ArticlePubMedPMC
- 26. Chan CL, Pyle L, Newnes L, Nadeau KJ, Zeitler PS, Kelsey MM. Continuous glucose monitoring and its relationship to hemoglobin A1c and oral glucose tolerance testing in obese and prediabetic youth. J Clin Endocrinol Metab 2015;100:902-910. ArticlePubMed
- 27. Suh S, Kim JH. Glycemic variability: how do we measure it and why is it important? Diabetes Metab J 2015;39:273-282. ArticlePubMedPMC
REFERENCES
The process of minimally invasive interstitial fluid (ISF) extraction technology from pretreatment with a microneedle array to ISF glucose accumulation. Accumulated glucose corresponds to glucose area under the curve (AUC) during 8 hours.

Correlation between glucose area under the curve (AUC) measured by continuous glucose monitoring (CGM) and interstitial fluid glucose AUC measured by minimally invasive interstitial fluid extraction technology (MIET) examined at (A) daytime (y=x, r=0.76) and (B) nighttime (y=x, r=0.82).
The area under the receiver operating characteristics curves showed a positive discrimination threshold for interstitial fluid glucose of minimally invasive interstitial fluid extraction technology (MIET) area under the curve (AUC) of glucose level over 200 mg/dL by continuous glucose monitoring in all patients. The optimal cutoff value of MIET AUC to predict over 200 mg/dL of blood glucose level was 1,067.3 mg·hr/dL (sensitivity of 88.2% and specificity of 81.5%).
No correlation between serum Na+ level and ratio of interstitial fluid glucose area under the curve (AUC) measured by minimally invasive interstitial fluid extraction technology (MIET) to glucose AUC measured by continuous glucose monitoring (CGM) in all patients.
Response of the patients to a questionnaire about minimally invasive interstitial fluid extraction technology in all patients. (A) Pain at stamping. (B) Impression at stamped area.
Clinical characteristic of diabetic patients
CGM parameters and MIET-derived AUC in diabetic patients
Values are presented as mean±standard deviation or median (interquartile range).
CGM, continuous glucose monitoring; MIET, minimally invasive interstitial fluid extraction technology; AUC, area under the curve; SD, standard deviation; CV, coefficient of variation; MAGE, mean amplitude of glucose excursion.
Linear regression analysis between MIET-derived AUC and CGM parameters in all diabetic patients
Figure & Data
References
Citations
- Efficacy of Postprandial Exercise in Mitigating Glycemic Responses in Overweight Individuals and Individuals with Obesity and Type 2 Diabetes—A Systematic Review and Meta-Analysis
Jie Kang, Brian M. Fardman, Nicholas A. Ratamess, Avery D. Faigenbaum, Jill A. Bush
Nutrients.2023; 15(20): 4489. CrossRef - Multifunctional Wearable System that Integrates Sweat‐Based Sensing and Vital‐Sign Monitoring to Estimate Pre‐/Post‐Exercise Glucose Levels
Yongseok Joseph Hong, Hyunjae Lee, Jaemin Kim, Minha Lee, Hyung Jin Choi, Taeghwan Hyeon, Dae‐Hyeong Kim
Advanced Functional Materials.2018;[Epub] CrossRef
 PubReader
 Cite
Cite