
- Current
- Browse
- Collections
-
For contributors
- For Authors
- Instructions to authors
- Article processing charge
- e-submission
- For Reviewers
- Instructions for reviewers
- How to become a reviewer
- Best reviewers
- For Readers
- Readership
- Subscription
- Permission guidelines
- About
- Editorial policy
Articles
- Page Path
- HOME > Diabetes Metab J > Volume 40(5); 2016 > Article
-
Original ArticleObesity and Metabolic Syndrome Statins Increase Mitochondrial and Peroxisomal Fatty Acid Oxidation in the Liver and Prevent Non-Alcoholic Steatohepatitis in Mice
-
Han-Sol Park1, Jung Eun Jang2, Myoung Seok Ko1, Sung Hoon Woo1, Bum Joong Kim1,2, Hyun Sik Kim1, Hye Sun Park1, In-Sun Park3, Eun Hee Koh2, Ki-Up Lee2

-
Diabetes & Metabolism Journal 2016;40(5):376-385.
DOI: https://doi.org/10.4093/dmj.2016.40.5.376
Published online: April 5, 2016
1Asan Institute for Life Sciences, Asan Medical Center, University of Ulsan College of Medicine, Seoul, Korea.
2Department of Internal Medicine, Asan Medical Center, University of Ulsan College of Medicine, Seoul, Korea.
3Department of Anatomy, Inha University School of Medicine, Incheon, Korea.
- Corresponding author: Ki-Up Lee. Department of Internal Medicine, Asan Medical Center, University of Ulsan College of Medicine, 88 Olympic-ro 43-gil, Songpa-gu, Seoul 05505, Korea. kulee@amc.seoul.kr
- *Han-Sol Park and Jung Eun Jang contributed equally to this study as first authors.
Copyright © 2016 Korean Diabetes Association
This is an Open Access article distributed under the terms of the Creative Commons Attribution Non-Commercial License (http://creativecommons.org/licenses/by-nc/4.0/) which permits unrestricted non-commercial use, distribution, and reproduction in any medium, provided the original work is properly cited.
ABSTRACT
-
Background
- Non-alcoholic fatty liver disease is the most common form of chronic liver disease in industrialized countries. Recent studies have highlighted the association between peroxisomal dysfunction and hepatic steatosis. Peroxisomes are intracellular organelles that contribute to several crucial metabolic processes, such as facilitation of mitochondrial fatty acid oxidation (FAO) and removal of reactive oxygen species through catalase or plasmalogen synthesis. Statins are known to prevent hepatic steatosis and non-alcoholic steatohepatitis (NASH), but underlying mechanisms of this prevention are largely unknown.
-
Methods
- Seven-week-old C57BL/6J mice were given normal chow or a methionine- and choline-deficient diet (MCDD) with or without various statins, fluvastatin, pravastatin, simvastatin, atorvastatin, and rosuvastatin (15 mg/kg/day), for 6 weeks. Histological lesions were analyzed by grading and staging systems of NASH. We also measured mitochondrial and peroxisomal FAO in the liver.
-
Results
- Statin treatment prevented the development of MCDD-induced NASH. Both steatosis and inflammation or fibrosis grades were significantly improved by statins compared with MCDD-fed mice. Gene expression levels of peroxisomal proliferator-activated receptor α (PPARα) were decreased by MCDD and recovered by statin treatment. MCDD-induced suppression of mitochondrial and peroxisomal FAO was restored by statins. Each statin's effect on increasing FAO and improving NASH was independent on its effect of decreasing cholesterol levels.
-
Conclusion
- Statins prevented NASH and increased mitochondrial and peroxisomal FAO via induction of PPARα. The ability to increase hepatic FAO is likely the major determinant of NASH prevention by statins. Improvement of peroxisomal function by statins may contribute to the prevention of NASH.
- Non-alcoholic fatty liver disease (NAFLD) is a clinical spectrum of liver damage, from simple steatosis to more advanced stages, such as non-alcoholic steatohepatitis (NASH), fibrosis, or cirrhosis [12]. Because NAFLD is closely associated with obesity, diabetes, and cardiovascular disease, it is regarded as a representative hepatic phenotype of metabolic syndrome [3]. NAFLD is the most common cause of chronic liver disease in developed countries [4], and the prevalence in the general population ranges from 20% to 30% [5].
- Statins competitively inhibit 3-hydroxy-3-methylglutaryl-coenzyme A (HMG-CoA) reductase, the rate-limiting enzyme in cholesterol synthesis, and are widely used as cholesterol-lowering drugs. The overall benefits of statins seem to be greater than what might be expected from an alteration in the lipid profile alone, suggesting that statins have cholesterol-independent pleiotropic effects [6]. However, the basic mechanism underlying these pleiotropic effects is largely unknown. Statins prevent hepatic steatosis in animals, and suggested mechanisms include prevention of carbohydrate response element-binding protein activation [7] and the induction of peroxisomal proliferator-activated receptor α (PPARα) [8], the master regulator of fatty acid oxidation (FAO). Statins also attenuate hepatic inflammatory reactions induced by angiotensin II [9] and prevent hepatic fibrosis by inactivating hepatic stellate cells [10]. Accumulation of free cholesterol in the mitochondria is suggested to be a major mechanism for steatohepatitis [11], and lowering of free cholesterol by statins may also be a mechanism of how statins prevent NASH.
- It is well known that decreased mitochondrial function contributes to the development of hepatic steatosis [12]. Recent studies have also highlighted the association between peroxisomal dysfunction and hepatic steatosis [1314]. Peroxisomes are ubiquitous, single-membrane-bounded organelles and exist in all eukaryotes [15]. The main metabolic functions of peroxisomes in mammalian cells include degradation of very long chain and branched-chain fatty acids, which cannot be instantly oxidized in mitochondria. Peroxisomes are responsible for the biosynthesis of plasmalogen, a special class of lipids, and docosahexaenoic acid, a final elongation and desaturation product of n-3 polyunsaturated fatty acids [16]. Peroxisomes also play a critical role in maintenance of intracellular redox balance. Production of reactive oxygen species is inevitable in fuel metabolism, and peroxisomes possess several anti-oxidative systems, including catalase, superoxide dismutases, and peroxiredoxins [17]. Despite their importance, less attention has been paid to peroxisomes than other organelles, such as mitochondria, endoplasmic reticulum, and lysosomes.
- In this study, we found that treatment with various statins ameliorated hepatic steatosis and steatohepatitis and that this was associated with increased hepatic FAO. In particular, peroxisomal FAO, as well as mitochondrial FAO, was significantly decreased in the liver of NASH animals, and this was recovered by statins.
INTRODUCTION
- Animals
- Seven-week-old male C57BL/6N mice were purchased from Central Lab Animal Inc. (Seoul, Korea) and acclimated for 1 week prior to the experiment. Animals were housed at an ambient temperature (22℃±1℃) on a 12-hour/12-hour light/dark cycle with free access to water and diet. Mice were fed normal chow diet (ND; n=10), methionine- and choline-deficient diet (MCDD; n=10; Dyets Inc., Bethlehem, PA, USA), or MCDD with 15 mg/kg/day of each statin supplementation (n=6 to 10) for 6 weeks. At the end of experiment period, mice were fasted (5 hours) in the morning and then sacrificed. Blood samples were collected and the livers were rapidly harvested, quickly frozen in liquid nitrogen, and stored at –80℃. All animal experiment protocols were approved by the Institutional Animal Care and Use Committee of the Asan Institute for Life Sciences, Seoul, South Korea.
- Histological analysis
- Liver tissue samples were fixed with 4% paraformaldehyde and embedded for 5 µm serial paraffin sections. The sections were stained with hematoxylin and eosin for evaluation of the steatosis and with the Masson's trichrome (MT) for determination of the fibrosis. The severities of the hepatic histological changes were assessed and scored in a blind manner using the NASH-Clinical Research Network scoring system [18]. Briefly, the steatosis grade was scored according to the degree of parenchymal involvement as follows: 0, <5%; 1, 5% to 33%; 2, 33% to 66%; and 3, >66%. The steatosis location was scored as follows: 0, zone 3 predominant; 1, zone 1 predominant; 2, azonal; and 3, panacinar. The lobular inflammation grade was scored by the numbers of the inflammation foci in the area of ×200 microscopic fields as follows: 0, no foci; 1, <2 foci per ×200 field; 2, 2 to 4 foci per ×200 field; and 3, >4 foci per ×200 field. The fibrosis stage was scored by the location and density of the fibrosis as follows: 0, none; 1, perisinusoidal or periportal fibrosis; 2, perisinusoidal and periportal fibrosis; 3, bridging fibrosis; and 4, cirrhosis.
- Plasma and tissue biochemical assays
- Plasma and hepatic triglyceride (TG) levels were measured using the GPO-Trinder kit (Sigma-Aldrich, St. Louis, MO, USA), according to the manufacturer's instructions. Plasma free fatty acid levels were determined using an enzymatic assay kit (Wako Chemicals, Richmond, VA, USA). Plasma alanine aminotransferase (ALT) levels were measured using the IDToxTM Alanine Transaminase Endpoint Assay Kit (ID Labs Inc., London, ON, Canada).
- Measurement of FAO
- The rate of FAO was measured as 14CO2 generation from 14C palmitate (NEN Life Sciences, Boston, MA, USA), as previously described [19]. Peroxisomal FAO was determined in the presence of inhibitors of mitochondrial oxidation, namely, antimycin A and rotenone (final concentrations 100 and 12.5 µM, respectively) [14].
- Quantitative real-time polymerase chain reaction analysis
- Total RNA was isolated using TRIzol reagent (Invitrogen, Carlsbad, CA, USA); 1 µg of each sample was reverse transcribed with random primers using the Reverse Aid M-MuLV reverse transcription kit (Fermentas, Hanover, MD, USA). Target cDNA levels were quantified by real-time polymerase chain reaction (PCR) using gene-specific primers (Table 1) and the 7500 Fast RT-PCR system (Applied Biosystems, Foster City, CA, USA) containing SYBR green. The data were normalized to the levels of expression of the internal control t-box protein (Tbp) and expressed in arbitrary units.
- Western blot analysis
- Liver tissues were homogenized in lysis buffer and centrifuged at 13,000 rpm for 30 minutes at 4℃. Samples with equal amounts of protein (20 to 50 µg) were analyzed by Western blotting using antibodies against PPARα (#sc9000; Santa Cruz Biotechnology, Santa Cruz, CA, USA) and α-tubulin (#NB100-690; Novus Biologicals, Littleton, CO, USA).
- Measurement of lipid peroxidation
- Hepatic lipid peroxidation was assessed by measuring malondialdehyde (MDA) levels using a Bioxytech MDA-586 assay kit (OxisResearch, Portland, OR, USA), according to the manufacturer's instruction. MDA values were corrected to the tissue protein contents.
- Statistical analyses
- All values are presented as the mean±standard error of the mean. Statistical significance of the differences between experimental groups was determined by the Student t-test or one-way analysis of variance with the Bonferroni correction using SPSS version 18 (SPSS Inc., Chicago, IL, USA). P<0.05 was considered statistically significant.
METHODS
- Administration of statins prevent hepatic lipid accumulation and steatohepatitis in MCDD-fed mice
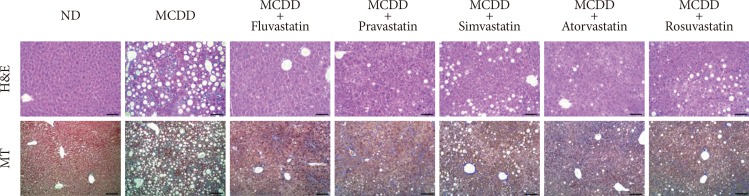
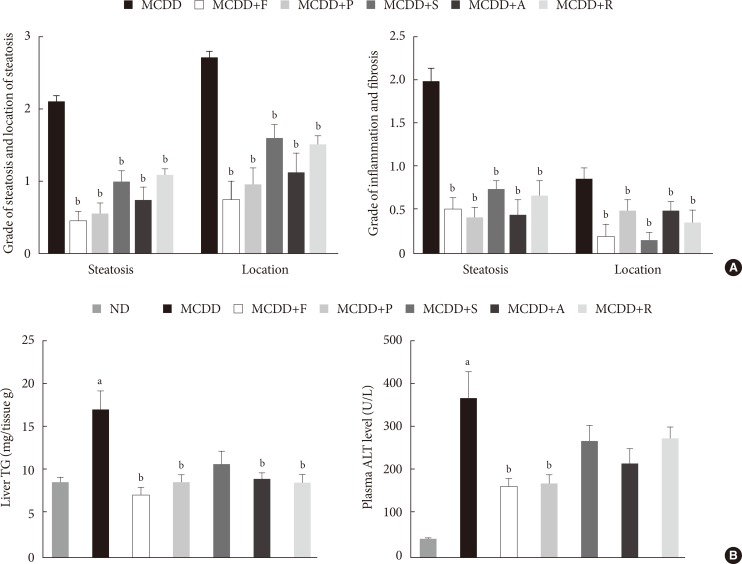
- Of the animal models of NAFLD, the MCDD model has been used frequently as a valuable model of NASH. Consistent with previous studies [20], administration of MCDD to C57BL6/N mice for 6 weeks caused NASH and mild hepatic fibrosis (Figs. 1 and 2A). Feeding MCDD significantly increased plasma ALT levels, a specific marker of liver injury, and hepatic TG contents (Fig. 2B). The effects of different types of statins, including fluvastatin, pravastatin, simvastatin, atorvastatin, and rosuvastatin, on MCDD-induced NAFLD were examined. It is well known that the efficacy and potency of lowering plasma cholesterol are different between the types of statins. However, it is not established whether this lipid-lowering effect correlates with pleiotropic effects of the drugs. Because the effective dose of each statin for reducing hepatic steatosis has not been established in rodent models, we treated five statins with the same dose (15 mg/kg/day) [21]. Table 2 shows the changes in body weight, liver weight, and plasma levels of cholesterol, free fatty acid, and TG in each experimental group. Interestingly, administration of various statins with MCDD for 6 weeks failed to further reduce plasma cholesterol levels in the mice fed MCDD alone (Table 2), but most statins reduced hepatic TG levels and plasma ALT levels (Fig. 2B). Among them, fluvastatin showed most prominent effect on reducing hepatic TG levels and plasma ALT levels. The histological analysis of statin-fed mice revealed a significant reduction in hepatic lipid accumulation, as well as inflammation or fibrosis (Figs. 1 and 2).
- Gene expression of PPARα and enzymes responsible for hepatic FAO was decreased in MCDD and recovered by statin treatment
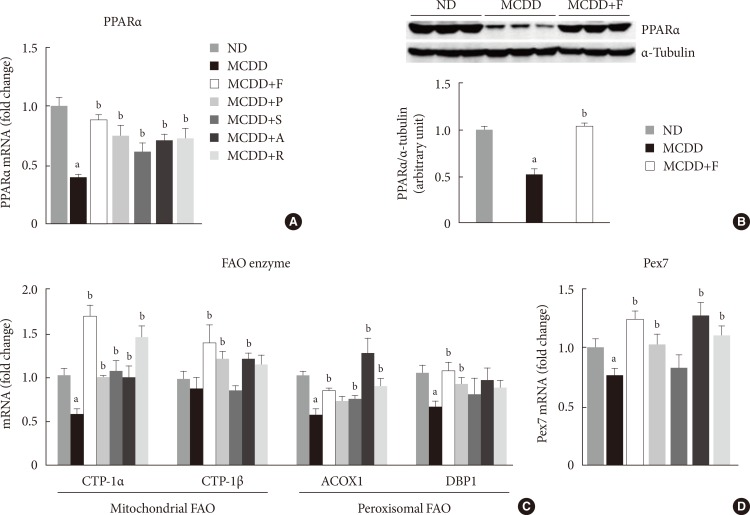
- PPARα is a master regulator of FAO. After 6 weeks of MCDD feeding, a gene expression level of PPARα was significantly decreased (Fig. 3A). All statins recovered PPARα mRNA levels in the liver compared with MCDD-fed mice. Western blot analysis also showed that MCDD feeding significantly decreased and fluvastatin treatment increased, respectively, protein expression of PPAR (Fig. 3B). In line with this result, the PPARα target genes encoding enzymes involved in mitochondrial FAO (carnitine-palmitoyltransferase-1α and -1β), and peroxisomal FAO (acyl-CoA oxidase-1 and D-bifunctional protein-1) were decreased by MCDD and recovered by most of statins (Fig. 3C). In addition, MCDD significantly decreased and most statins significantly increased the expression of peroxisomal biogenesis factor (Pex)-7, a gene encoding a protein that imports several essential enzymes into peroxisomes (Fig. 3D) [22].
- Statin restores MCDD-induced suppression of hepatic mitochondrial and peroxisomal FAO
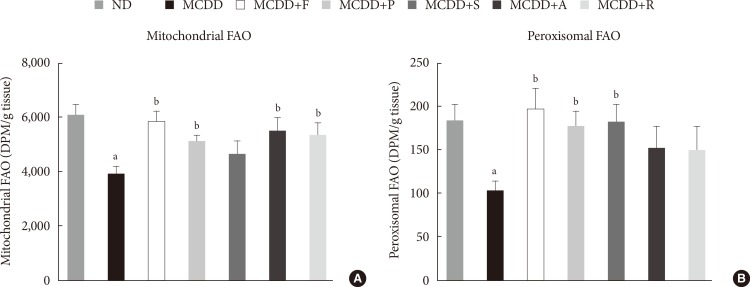
- To ensure the effect of MCDD and statins on hepatic FAO rate, we directly measured both mitochondrial and peroxisomal FAO using 14C palmitate oxidation. In agreement with previous studies [23], feeding MCDD significantly suppressed mitochondrial FAO in the liver (Fig. 4A). Treatment with statins significantly increased mitochondrial FAO, except for simvastatin (P=0.21). Feeding MCDD also significantly decreased peroxisomal FAO and fluvastatin, whereas pravastatin and simvastatin supplementation significantly increased it (Fig. 4B).
- Hepatic gene expression levels of anti-oxidative enzymes was decreased in MCDD-fed mice but not recovered by statins
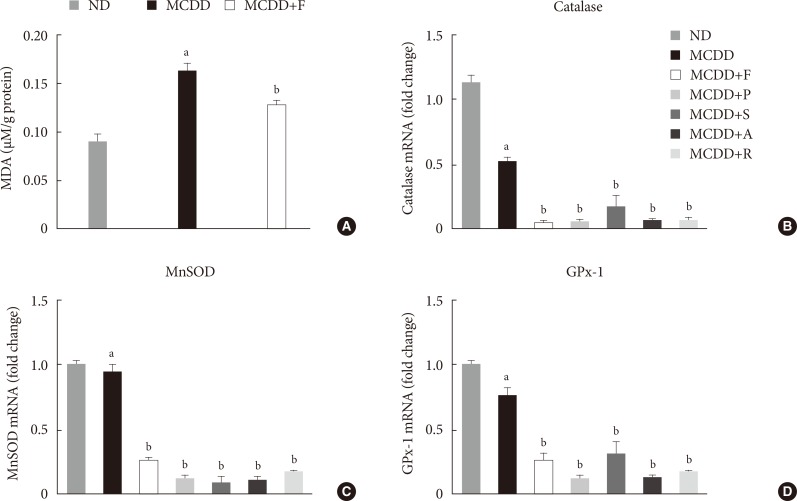
- A recent study showed that MCDD increases oxidative stress through decreased anti-oxidative capacity [24]. It was also shown that statins reduce inflammatory responses [25]. Accordingly, the MDA assay showed that the lipid peroxidation levels in the liver of MCDD-fed mice were more elevated than ND-fed mice, whereas these findings were ameliorated in the fluvastatin supplementation group (Fig. 5A).
- Thus, we examined the possibility that statins may increase the gene expression of anti-oxidant enzymes: catalase, a major peroxisomal anti-oxidant; manganese superoxide dismutase, which exists in both mitochondria and peroxisomes; and glutathione peroxidase (GPx)-1, a cytosolic anti-oxidant. MCDD significantly decreased gene expression levels of catalase and GPx-1. However, contrary to our expectation, statins further decreased mRNA expressions of all of these enzymes (Fig. 5B-D).
RESULTS
- In the present study, we showed that various statins prevented MCDD-induced hepatic steatosis and NASH and increased hepatic mitochondrial and peroxisomal FAO. Gene expression levels of PPARα and its target genes, which are responsible for mitochondrial and peroxisomal FAO, were increased by statin treatment. Our study is the first to demonstrate that statin treatment increases peroxisomal FAO to prevent NASH development.
- Interestingly, the overall preventive effect of statins was not related with its potency to reduce plasma cholesterol levels. In our study, we used same dosages of various statins because there has been no study directly comparing potency of these drugs. Interestingly, fluvastatin, known to have lower potency to reduce plasma cholesterol level than atorvastatin and rosuvastatin, showed most prominent effects on reducing hepatic steatosis and NASH. Fluvastatin was also most effective in increasing mitochondrial and peroxisomal FAO, as well as expression of PPARα and its downstream FAO enzymes. Thus, it is suggested that each statin's effect on increasing FAO is independent of its effect on decreasing cholesterol level and that the ability to increase hepatic FAO is the major determinant of NASH prevention by statins. However, the molecular mechanism by which this kind of discrepancy occurs among various statins is presently unknown.
- The two-hit hypothesis is a well-known theory to explain the pathogenesis of NAFLD and its progression from steatosis to NASH [26]. The "first hit" is the accumulation of fatty acids or TGs in the liver that may increase susceptibility of the hepatocellular damage induced by second hits. There are several mechanisms leading to the development of hepatic steatosis: (1) increased hepatic fatty acid uptake, (2) increased de novo lipogenesis in the liver, (3) decreased hepatic FAO, and (4) decreased very low density lipoprotein secretion from the liver. The "second hit" is a combination of inflammatory responses, oxidative stress, and mitochondrial dysfunction, which leads to hepatocellular damage and fibrosis [26].
- Among them, FAO occurs mainly in mitochondria, but peroxisomes and microsomes also play a role. Peroxisomal β-oxidation is required for efficient mitochondrial β-oxidation [27]. Peroxisomal dysfunction induces functional abnormalities in mitochondria and consequently compromises cellular ATP production [28]. Especially when the liver is overloaded with fatty acids, the role of peroxisomal β-oxidation becomes more important because dicarboxylic acids are increased through ω-oxidation in endoplasmic reticulum [1429]. In line with this, recent studies have highlighted the association between peroxisomal dysfunction and hepatic steatosis. The upregulation of genes, which regulates peroxisomal biogenesis and FAO in a certain strain of mice, was related with resistance to diet-induced hepatic steatosis [13]. The liver-specific Pex5-/- mice developed hepatic steatosis even though mitochondrial FAO was increased [14].
- Mitochondria and peroxisomes are closely related organelles and play a critical role in the cellular energy metabolism. X-linked adrenoleukodystrophy (X-ALD) is an inherited disorder caused by mutation of the ABCD1 gene, which encodes a peroxisomal transporter of very long chain fatty acids. The mouse model of X-ALD showed impaired oxidative phosphorylation of mitochondria and increased oxidative stress [30]. Peroxisomal biogenesis disorder, Zellweger syndrome, is characterized by severe neurologic deficits with multiple organ dysfunctions. Pex5-/- mice, a mouse model for Zellweger syndrome, caused alteration of mitochondrial morphology, changes of mitochondrial respiratory chains, and increased oxidative stress in the liver [31]. In our study, statin treatment increased both peroxisomal and mitochondrial FAO, suggesting that improvement of peroxisomal FAO may underlie improvement of mitochondrial FAO. Taken together, improvement of peroxisomal FAO may be the primary mechanism of NASH prevention by statins. However, it should be noted that each statin showed a different level of effect on mitochondrial or peroxisomal FAO, whereas all statins improved steatosis and NASH. Therefore, there may be additional mechanisms of preventive effect of statins on steatosis and NASH.
- Increased oxidative stress and altered anti-oxidative system play an important role in the development of NASH/NAFLD [32]. Because mitochondria and peroxisomes are major sources of free radical generation, resulting in oxidative stress, maintenance of its function is critical to prevent NAFLD. In agreement with previous reports [24], feeding MCDD significantly decreased gene expression levels of peroxisomal anti-oxidative enzymes, including catalase and GPx. A number of studies have demonstrated that statins act as an anti-oxidant in various tissues [33]. In line with this, we demonstrated that the MCDD-induced hepatic lipid peroxidation was suppressed by statin treatment. Previous studies have shown that treatment with various statins increased the activity of anti-oxidant enzymes, such as catalase or SOD [34]. However, in our study, statins failed to increase gene expression levels of anti-oxidant enzymes. The reason for this discrepancy between current study and previous studies is presently unclear. We recently found that fluvastatin treatment significantly increased hepatic level of plasmalogen, which is well known to act as an endogenous anti-oxidant (unpublished data) [3536]. Thus, it can be suggested that changes in anti-oxidant enzymes are not the primary reason of improvement of anti-oxidative defense function by statins.
- Statins are known to cause several hepatic adverse effects, ranging from transient elevation of transaminases to acute liver failure [37]. However, recent studies have reported that statin-induced acute liver failure is extremely rare and may be related with idiosyncratic reaction [38]. Indeed, several recent studies showed that statins can be used safely in NASH patients [39]. In addition, a recent meta-analysis showed that statins may improve serum aminotransferase levels and ultrasound findings in NASH patients [40]. Therefore, it is suggested that favorable effects of statins on liver function in animal studies can be extended to humans.
- In summary, statin treatment prevented hepatic steatosis and NASH in MCDD-fed mice. Feeding MCDD for 6 weeks caused hepatic steatosis, inflammation, and early fibrosis through decreased hepatic mitochondrial and peroxisomal FAO. Various statins exhibited significant improvement of histological scores and enhanced hepatic FAO via induction of PPARα and target genes. Interestingly, these pleiotropic effects were not correlated with cholesterol-lowering potency of statins. Based on these data, we suggest a new possibility that improvement of peroxisomal function by statins may contribute to the prevention of NASH.
DISCUSSION
-
Acknowledgements
- This work was supported by the National Research Foundation of Korea (NRF) funded by the Ministry of Education, Science and Technology (2006-2005412, K.U.L.; 2012R1A1A3012626, E.H.K.). This work was also supported by the grants (2009-006, 2013-578, 2014-006) from the Asan Institute for Life Sciences, Seoul, South Korea.
ACKNOWLEDGMENTS
-
CONFLICTS OF INTEREST: No potential conflict of interest relevant to this article was reported.
NOTES
- 1. Farrell GC, Larter CZ. Nonalcoholic fatty liver disease: from steatosis to cirrhosis. Hepatology 2006;43(2 Suppl 1):S99-S112. ArticlePubMed
- 2. Williams CD, Stengel J, Asike MI, Torres DM, Shaw J, Contreras M, Landt CL, Harrison SA. Prevalence of nonalcoholic fatty liver disease and nonalcoholic steatohepatitis among a largely middle-aged population utilizing ultrasound and liver biopsy: a prospective study. Gastroenterology 2011;140:124-131. ArticlePubMed
- 3. Yoo HJ, Choi KM. Hepatokines as a link between obesity and cardiovascular diseases. Diabetes Metab J 2015;39:10-15. ArticlePubMedPMC
- 4. Browning JD, Szczepaniak LS, Dobbins R, Nuremberg P, Horton JD, Cohen JC, Grundy SM, Hobbs HH. Prevalence of hepatic steatosis in an urban population in the United States: impact of ethnicity. Hepatology 2004;40:1387-1395. ArticlePubMed
- 5. Bellentani S, Scaglioni F, Marino M, Bedogni G. Epidemiology of non-alcoholic fatty liver disease. Dig Dis 2010;28:155-161. ArticlePubMedPDF
- 6. Davignon J. Beneficial cardiovascular pleiotropic effects of statins. Circulation 2004;109(23 Suppl 1):III39-III43. ArticlePubMed
- 7. Rodriguez-Calvo R, Barroso E, Serrano L, Coll T, Sanchez RM, Merlos M, Palomer X, Laguna JC, Vázquez-Carrera M. Atorvastatin prevents carbohydrate response element binding protein activation in the fructose-fed rat by activating protein kinase A. Hepatology 2009;49:106-115. ArticlePubMed
- 8. Landrier JF, Thomas C, Grober J, Duez H, Percevault F, Souidi M, Linard C, Staels B, Besnard P. Statin induction of liver fatty acid-binding protein (L-FABP) gene expression is peroxisome proliferator-activated receptor-alpha-dependent. J Biol Chem 2004;279:45512-45518. PubMed
- 9. Moreno M, Ramalho LN, Sancho-Bru P, Ruiz-Ortega M, Ramalho F, Abraldes JG, Colmenero J, Dominguez M, Egido J, Arroyo V, Ginès P, Bataller R. Atorvastatin attenuates angiotensin II-induced inflammatory actions in the liver. Am J Physiol Gastrointest Liver Physiol 2009;296:G147-G156. ArticlePubMed
- 10. Trebicka J, Hennenberg M, Odenthal M, Shir K, Klein S, Granzow M, Vogt A, Dienes HP, Lammert F, Reichen J, Heller J, Sauerbruch T. Atorvastatin attenuates hepatic fibrosis in rats after bile duct ligation via decreased turnover of hepatic stellate cells. J Hepatol 2010;53:702-712. ArticlePubMed
- 11. Mari M, Caballero F, Colell A, Morales A, Caballeria J, Fernandez A, Enrich C, Fernandez-Checa JC, Garcia-Ruiz C. Mitochondrial free cholesterol loading sensitizes to TNF- and Fas-mediated steatohepatitis. Cell Metab 2006;4:185-198. ArticlePubMed
- 12. Grattagliano I, de Bari O, Bernardo TC, Oliveira PJ, Wang DQ, Portincasa P. Role of mitochondria in nonalcoholic fatty liver disease: from origin to propagation. Clin Biochem 2012;45:610-618. ArticlePubMed
- 13. Hall D, Poussin C, Velagapudi VR, Empsen C, Joffraud M, Beckmann JS, Geerts AE, Ravussin Y, Ibberson M, Oresic M, Thorens B. Peroxisomal and microsomal lipid pathways associated with resistance to hepatic steatosis and reduced pro-inflammatory state. J Biol Chem 2010;285:31011-31023. ArticlePubMedPMC
- 14. Peeters A, Swinnen JV, Van Veldhoven PP, Baes M. Hepatosteatosis in peroxisome deficient liver despite increased β-oxidation capacity and impaired lipogenesis. Biochimie 2011;93:1828-1838. ArticlePubMed
- 15. Imoto Y, Kuroiwa H, Yoshida Y, Ohnuma M, Fujiwara T, Yoshida M, Nishida K, Yagisawa F, Hirooka S, Miyagishima SY, Misumi O, Kawano S, Kuroiwa T. Single-membrane-bounded peroxisome division revealed by isolation of dynamin-based machinery. Proc Natl Acad Sci U S A 2013;110:9583-9588. ArticlePubMedPMC
- 16. Wanders RJ, Waterham HR. Peroxisomal disorders: the single peroxisomal enzyme deficiencies. Biochim Biophys Acta 2006;1763:1707-1720. ArticlePubMed
- 17. Antonenkov VD, Grunau S, Ohlmeier S, Hiltunen JK. Peroxisomes are oxidative organelles. Antioxid Redox Signal 2010;13:525-537. ArticlePubMed
- 18. Kleiner DE, Brunt EM, Van Natta M, Behling C, Contos MJ, Cummings OW, Ferrell LD, Liu YC, Torbenson MS, Unalp-Arida A, Yeh M, McCullough AJ, Sanyal AJ. Nonalcoholic Steatohepatitis Clinical Research Network. Design and validation of a histological scoring system for nonalcoholic fatty liver disease. Hepatology 2005;41:1313-1321. ArticlePubMed
- 19. Kim JY, Koves TR, Yu GS, Gulick T, Cortright RN, Dohm GL, Muoio DM. Evidence of a malonyl-CoA-insensitive carnitine palmitoyltransferase I activity in red skeletal muscle. Am J Physiol Endocrinol Metab 2002;282:E1014-E1022. ArticlePubMed
- 20. Caballero F, Fernandez A, Matias N, Martinez L, Fucho R, Elena M, Caballeria J, Morales A, Fernandez-Checa JC, Garcia-Ruiz C. Specific contribution of methionine and choline in nutritional nonalcoholic steatohepatitis: impact on mitochondrial S-adenosyl-L-methionine and glutathione. J Biol Chem 2010;285:18528-18536. PubMedPMC
- 21. Campbell MJ, Esserman LJ, Zhou Y, Shoemaker M, Lobo M, Borman E, Baehner F, Kumar AS, Adduci K, Marx C, Petricoin EF, Liotta LA, Winters M, Benz S, Benz CC. Breast cancer growth prevention by statins. Cancer Res 2006;66:8707-8714. ArticlePubMedPDF
- 22. Rodrigues TA, Alencastre IS, Francisco T, Brites P, Fransen M, Grou CP, Azevedo JE. A PEX7-centered perspective on the peroxisomal targeting signal type 2-mediated protein import pathway. Mol Cell Biol 2014;34:2917-2928. ArticlePubMedPMCPDF
- 23. Serviddio G, Giudetti AM, Bellanti F, Priore P, Rollo T, Tamborra R, Siculella L, Vendemiale G, Altomare E, Gnoni GV. Oxidation of hepatic carnitine palmitoyl transferase-I (CPT-I) impairs fatty acid beta-oxidation in rats fed a methionine-choline deficient diet. PLoS One 2011;6:e24084ArticlePubMedPMC
- 24. Jorgacevic B, Mladenovic D, Ninkovic M, Prokic V, Stankovic MN, Aleksic V, Cerovic I, Vukicevic RJ, Vucevic D, Stankovic M, Radosavljevic T. Dynamics of oxidative/nitrosative stress in mice with methionine-choline-deficient diet-induced nonalcoholic fatty liver disease. Hum Exp Toxicol 2014;33:701-709. ArticlePubMedPDF
- 25. Margaritis M, Channon KM, Antoniades C. Statins as regulators of redox state in the vascular endothelium: beyond lipid lowering. Antioxid Redox Signal 2014;20:1198-1215. ArticlePubMedPMC
- 26. Day CP. Pathogenesis of steatohepatitis. Best Pract Res Clin Gastroenterol 2002;16:663-678. ArticlePubMed
- 27. Reddy JK, Hashimoto T. Peroxisomal beta-oxidation and peroxisome proliferator-activated receptor alpha: an adaptive metabolic system. Annu Rev Nutr 2001;21:193-230. ArticlePubMed
- 28. Islinger M, Grille S, Fahimi HD, Schrader M. The peroxisome: an update on mysteries. Histochem Cell Biol 2012;137:547-574. ArticlePubMedPDF
- 29. Van Veldhoven PP. Biochemistry and genetics of inherited disorders of peroxisomal fatty acid metabolism. J Lipid Res 2010;51:2863-2895. ArticlePubMedPMC
- 30. Lopez-Erauskin J, Galino J, Ruiz M, Cuezva JM, Fabregat I, Cacabelos D, Boada J, Martinez J, Ferrer I, Pamplona R, Villarroya F, Portero-Otin M, Fourcade S, Pujol A. Impaired mitochondrial oxidative phosphorylation in the peroxisomal disease X-linked adrenoleukodystrophy. Hum Mol Genet 2013;22:3296-3305. ArticlePubMed
- 31. Baumgart E, Vanhorebeek I, Grabenbauer M, Borgers M, Declercq PE, Fahimi HD, Baes M. Mitochondrial alterations caused by defective peroxisomal biogenesis in a mouse model for Zellweger syndrome (PEX5 knockout mouse). Am J Pathol 2001;159:1477-1494. ArticlePubMedPMC
- 32. Rolo AP, Teodoro JS, Palmeira CM. Role of oxidative stress in the pathogenesis of nonalcoholic steatohepatitis. Free Radic Biol Med 2012;52:59-69. ArticlePubMed
- 33. Shishehbor MH, Brennan ML, Aviles RJ, Fu X, Penn MS, Sprecher DL, Hazen SL. Statins promote potent systemic antioxidant effects through specific inflammatory pathways. Circulation 2003;108:426-431. ArticlePubMed
- 34. Yilmaz MI, Baykal Y, Kilic M, Sonmez A, Bulucu F, Aydin A, Sayal A, Kocar IH. Effects of statins on oxidative stress. Biol Trace Elem Res 2004;98:119-127. ArticlePubMed
- 35. Braverman NE, Moser AB. Functions of plasmalogen lipids in health and disease. Biochim Biophys Acta 2012;1822:1442-1452. ArticlePubMed
- 36. Wallner S, Schmitz G. Plasmalogens the neglected regulatory and scavenging lipid species. Chem Phys Lipids 2011;164:573-589. ArticlePubMed
- 37. Lewis JH. Clinical perspective: statins and the liver: harmful or helpful? Dig Dis Sci 2012;57:1754-1763. ArticlePubMedPDF
- 38. Bjornsson E, Jacobsen EI, Kalaitzakis E. Hepatotoxicity associated with statins: reports of idiosyncratic liver injury post-marketing. J Hepatol 2012;56:374-380. ArticlePubMed
- 39. Athyros VG, Tziomalos K, Gossios TD, Griva T, Anagnostis P, Kargiotis K, Pagourelias ED, Theocharidou E, Karagiannis A, Mikhailidis DP. GREACE Study Collaborative Group. Safety and efficacy of long-term statin treatment for cardiovascular events in patients with coronary heart disease and abnormal liver tests in the Greek Atorvastatin and Coronary Heart Disease Evaluation (GREACE) Study: a post-hoc analysis. Lancet 2010;376:1916-1922. ArticlePubMed
- 40. Eslami L, Merat S, Malekzadeh R, Nasseri-Moghaddam S, Aramin H. Statins for non-alcoholic fatty liver disease and non-alcoholic steatohepatitis. Cochrane Database Syst Rev 2013;12:CD008623Article
REFERENCES
Statin treatment attenuates methionine- and choline-deficient diet (MCDD)-induced hepatic steatosis and steatohepatitis. Representative histological images of each experimental group. H&E (×200; scale bar=100 µm), MT (×100; scale bar=50 µm). ND, normal chow diet; MT, Masson's trichrome.
Histologic scores and hepatic triglyceride (TG) content and plasma alanine aminotransferase (ALT) level. (A) Histologic scores for location and severity of steatosis, inflammation, and fibrosis, according to criteria of Kleiner et al. [18]. (B) Hepatic TG content and plasma ALT level in mice fed normal chow diet (ND) and methionine- and choline-deficient diet (MCDD) with or without various statins for 6 weeks. F, fluvastatin; P, pravastatin; S, simvastatin; A, atorvastatin; R, rosuvastatin. aP<0.05 compared with ND, bP<0.05 compared with MCDD.
Treatment with statins recovers methionine- and choline-deficient diet (MCDD)-induced suppression of peroxisomal proliferator-activated receptor α (PPARα) and target gene expression levels in the liver. (A) mRNA expression levels and (B) protein expression levels of PPARα. Expression levels of genes involved in mitochondrial and peroxisomal (C) fatty acid oxidation (FAO), and (D) peroxisomal biogenesis factor (Pex) 7. ND, normal chow diet; F, fluvastatin; P, pravastatin; S, simvastatin; A, atorvastatin; R, rosuvastatin; CPT, carnitine palmitoyltransferase; ACOX, acyl CoA oxidase; DBP, D-bifunctional protein. aP<0.05 compared with ND, bP<0.05 compared with MCDD.
Measurement of hepatic fatty acid oxidation (FAO) in mice fed methionine- and choline-deficient diet (MCDD) with or without statins. (A) Mitochondrial FAO. (B) Peroxisomal FAO. DPM, disintegrations per minute; ND, normal chow diet; F, fluvastatin; P, pravastatin; S, simvastatin; A, atorvastatin; R, rosuvastatin. aP<0.05 compared with ND, bP<0.05 compared with MCDD.
Changes in hepatic lipid peroxidation and gene expression levels of several anti-oxidative enzymes. (A) Hepatic malondialdehyde (MDA) levels in mice fed methionine- and choline-deficient diet (MCDD) and fluvastatin supplementation. (B) mRNA expression levels of catalase, (C) manganese superoxide dismutase (MnSOD), and (D) glutathione peroxidase 1 (GPx-1). ND, normal chow diet; F, fluvastatin; P, pravastatin; S, simvastatin; A, atorvastatin. aP<0.05 compared with ND, bP<0.05 compared with MCDD.
Primer sets for real-time polymerase chain reaction analysis
Metabolic characteristics of mice fed methionine- and choline-deficient diet with or without statins
Values are presented as mean±standard error of means (n=6–10).
ND, normal chow diet; MCDD, methionine- and choline-deficient diet; F, fluvastatin; P, pravastatin; S, simvastatin; A, atorvastatin; R, rosuvastatin; BW, body weight; LW, liver weight; FFA, free fatty acid; TG, triglyceride.
aP<0.05 between ND and MCDD groups, bP<0.05 between MCDD and MCDD with statin-treated groups.
Figure & Data
References
Citations
- Organelle stress and alterations in interorganelle crosstalk during liver fibrosis
Saloni Sinha, Nora Hassan, Robert E. Schwartz
Hepatology.2024; 79(2): 482. CrossRef - Statin therapy: a potential adjuvant to immunotherapies in hepatocellular carcinoma
Jiao Wang, Chengyu Liu, Ronghua Hu, Licheng Wu, Chuanzhou Li
Frontiers in Pharmacology.2024;[Epub] CrossRef - Recent Progress in Anti‐Tumor Nanodrugs Based on Tumor Microenvironment Redox Regulation
Lan Yao, Xiang Zhu, Yunyi Shan, Liang Zhang, Jing Yao, Hui Xiong
Small.2024;[Epub] CrossRef - Exploration of the Key Genes Involved in Non-alcoholic Fatty Liver Disease and Possible MicroRNA Therapeutic Targets
Ali Mahmoudi, Amin Jalili, Alexandra E. Butler, Seyed H. Aghaee-Bakhtiari, Tannaz Jamialahmadi, Amirhossein Sahebkar
Journal of Clinical and Experimental Hepatology.2024; 14(4): 101365. CrossRef - Inflammation drives pathogenesis of early intestinal failure-associated liver disease
Scott C. Fligor, Savas T. Tsikis, Thomas I. Hirsch, Ashish Jain, Liang Sun, Shira Rockowitz, Kathleen M. Gura, Mark Puder
Scientific Reports.2024;[Epub] CrossRef - Effects of metformin and simvastatin treatment on ultrastructural features of liver macrophages in HFD mice
Darko Ciric, Tamara Kravic-Stevovic, Vladimir Bumbasirevic, Sasa Petricevic, Sofija Jovanovic, Vladimir Trajkovic, Tamara Martinovic
Ultrastructural Pathology.2023; 47(1): 1. CrossRef - Statins for the Treatment of Nonalcoholic Fatty Liver Disease and Nonalcoholic Steatohepatitis: A Systematic Review and Meta-Analysis
Weiwei Dai, Baohong Xu, Peng Li, Junhua Weng
American Journal of Therapeutics.2023; 30(1): e17. CrossRef - Atorvastatin Attenuates Diet-Induced Non-Alcoholic Steatohepatitis in APOE*3-Leiden Mice by Reducing Hepatic Inflammation
José A. Inia, Geurt Stokman, Elsbet J. Pieterman, Martine C. Morrison, Aswin L. Menke, Lars Verschuren, Martien P. M. Caspers, Martin Giera, J. Wouter Jukema, Anita M. van den Hoek, Hans M. G. Princen
International Journal of Molecular Sciences.2023; 24(9): 7818. CrossRef - The interplay between nonalcoholic fatty liver disease and atherosclerotic cardiovascular disease
Alexandra C. Finney, Sandeep Das, Dhananjay Kumar, M. Peyton McKinney, Bishuang Cai, Arif Yurdagul, Oren Rom
Frontiers in Cardiovascular Medicine.2023;[Epub] CrossRef - Serum metabolomic signatures of fatty acid oxidation defects differentiate host-response subphenotypes of acute respiratory distress syndrome
Tomeka L. Suber, Stacy G. Wendell, Steven J. Mullett, Benjamin Zuchelkowski, William Bain, Georgios D. Kitsios, Bryan J. McVerry, Prabir Ray, Anuradha Ray, Rama K. Mallampalli, Yingze Zhang, Faraaz Shah, Seyed Mehdi Nouraie, Janet S. Lee
Respiratory Research.2023;[Epub] CrossRef - Statins on nonalcoholic fatty liver disease: A systematic review and meta-analysis of 14 RCTs
Haiyan Zhou, Maeda Toshiyoshi,, Wenli Zhao, Ye Zhao, Yan Zhao,
Medicine.2023; 102(26): e33981. CrossRef - Atorvastatin rescues hyperhomocysteinemia-induced cognitive deficits and neuroinflammatory gene changes
Erica M. Weekman, Sherika N. Johnson, Colin B. Rogers, Tiffany L. Sudduth, Kevin Xie, Qi Qiao, David W. Fardo, Teodoro Bottiglieri, Donna M. Wilcock
Journal of Neuroinflammation.2023;[Epub] CrossRef - Crosstalk between Lipids and Non-Alcoholic Fatty Liver Disease
Divyavani Gowda, Chandra Shekhar, Siddabasave Gowda B. Gowda, Yifan Chen, Shu-Ping Hui
Livers.2023; 3(4): 687. CrossRef - Empagliflozin: Potential Protective Effects on Hepatocytes and Liver Outcomes in Streptozotocin -Diabetic Rats.
Alia Khwaldeh, Nour Al-Sawalha, Shefa' Aljabali, Ziad Shraideh, Sokiyna Ababneh, Roba Bdeir
Biomedical and Pharmacology Journal.2023; 16(4): 2123. CrossRef - Is there a role of lipid-lowering therapies in the management of fatty liver disease?
Ismini Tzanaki, Aris P Agouridis, Michael S Kostapanos
World Journal of Hepatology.2022; 14(1): 119. CrossRef - Bifidobacterium animalis subsp. lactis A6 Enhances Fatty Acid β-Oxidation of Adipose Tissue to Ameliorate the Development of Obesity in Mice
Yanxiong Huo, Guoping Zhao, Jinwang Li, Ran Wang, Fazheng Ren, Yixuan Li, Xiaoyu Wang
Nutrients.2022; 14(3): 598. CrossRef - PharmOmics: A species- and tissue-specific drug signature database and gene-network-based drug repositioning tool
Yen-Wei Chen, Graciel Diamante, Jessica Ding, Thien Xuan Nghiem, Jessica Yang, Sung-Min Ha, Peter Cohn, Douglas Arneson, Montgomery Blencowe, Jennifer Garcia, Nima Zaghari, Paul Patel, Xia Yang
iScience.2022; 25(4): 104052. CrossRef - Pleyotropic Effects of Statins Non-Alcoholic Fat Disease of the Liver Non-Alcoholic Steatohepatitis
И.Р. Агабабян, Ш.Ш. Садыкова
Рецепт.2022; (2): 194. CrossRef - PPAR Alpha as a Metabolic Modulator of the Liver: Role in the Pathogenesis of Nonalcoholic Steatohepatitis (NASH)
Simona Todisco, Anna Santarsiero, Paolo Convertini, Giulio De Stefano, Michele Gilio, Vito Iacobazzi, Vittoria Infantino
Biology.2022; 11(5): 792. CrossRef - Association between organochlorine pesticides and nonalcoholic fatty liver disease in the National Health and Nutrition Examination Survey 2003–2004
Hyunji Sang, Kyu-Na Lee, Chang Hee Jung, Kyungdo Han, Eun Hee Koh
Scientific Reports.2022;[Epub] CrossRef - Integrating the contributions of mitochondrial oxidative metabolism to lipotoxicity and inflammation in NAFLD pathogenesis
Curtis C. Hughey, Patrycja Puchalska, Peter A. Crawford
Biochimica et Biophysica Acta (BBA) - Molecular and Cell Biology of Lipids.2022; 1867(11): 159209. CrossRef - Supplementation of Lycium barbarum Polysaccharide Combined with Aerobic Exercise Ameliorates High-Fat-Induced Nonalcoholic Steatohepatitis via AMPK/PPARα/PGC-1α Pathway
Dou-Dou Li, Jia-Min Ma, Ming-Jing Li, Lu-Lu Gao, Yan-Na Fan, Yan-Nan Zhang, Xiu-Juan Tao, Jian-Jun Yang
Nutrients.2022; 14(15): 3247. CrossRef - Targeted therapeutics and novel signaling pathways in non-alcohol-associated fatty liver/steatohepatitis (NAFL/NASH)
Xiaohan Xu, Kyle L. Poulsen, Lijuan Wu, Shan Liu, Tatsunori Miyata, Qiaoling Song, Qingda Wei, Chenyang Zhao, Chunhua Lin, Jinbo Yang
Signal Transduction and Targeted Therapy.2022;[Epub] CrossRef - Regulation of Hepatic Lipid and Glucose Metabolism by INSP3R1
Rachel J. Perry
Diabetes.2022; 71(9): 1834. CrossRef - Effects of SLCO1B1 Genetic Variant on Metabolite Profile in Participants on Simvastatin Treatment
Lilian Fernandes Silva, Rowmika Ravi, Jagadish Vangipurapu, Anniina Oravilahti, Markku Laakso
Metabolites.2022; 12(12): 1159. CrossRef - Acute and chronic effects of environmental realistic concentrations of simvastatin in danio rerio: evidences of oxidative alterations and endocrine disruptive activity
D. Rebelo, A.T. Correia, B. Nunes
Environmental Toxicology and Pharmacology.2021; 81: 103522. CrossRef - Allopurinol ameliorates high fructose diet induced hepatic steatosis in diabetic rats through modulation of lipid metabolism, inflammation, and ER stress pathway
In-Jin Cho, Da-Hee Oh, Jin Yoo, You-Cheol Hwang, Kyu Jeung Ahn, Ho-Yeon Chung, Soung Won Jeong, Ju-Young Moon, Sang-Ho Lee, Sung-Jig Lim, In-Kyung Jeong
Scientific Reports.2021;[Epub] CrossRef - Atorvastatin Modulates Bile Acid Homeostasis in Mice with Diet-Induced Nonalcoholic Steatohepatitis
Hana Lastuvkova, Fatemeh Alaei Faradonbeh, Jolana Schreiberova, Milos Hroch, Jaroslav Mokry, Hana Faistova, Zuzana Nova, Radomír Hyspler, Ivone Cristina Igreja Sa, Petr Nachtigal, Alzbeta Stefela, Petr Pavek, Stanislav Micuda
International Journal of Molecular Sciences.2021; 22(12): 6468. CrossRef - PPARs as Metabolic Sensors and Therapeutic Targets in Liver Diseases
Hugo Christian Monroy-Ramirez, Marina Galicia-Moreno, Ana Sandoval-Rodriguez, Alejandra Meza-Rios, Arturo Santos, Juan Armendariz-Borunda
International Journal of Molecular Sciences.2021; 22(15): 8298. CrossRef - Simvastatin affects the PPARα signaling pathway and causes oxidative stress and embryonic development interference in Mugilogobius abei
Chao Wang, Tianli Tang, Yimeng Wang, Xiangping Nie, Kaibin Li
Aquatic Toxicology.2021; 239: 105951. CrossRef - Impact of statin use on the risk and prognosis of hepatocellular carcinoma: a meta-analysis
Jianfeng Wang, Xiaogang Li
European Journal of Gastroenterology & Hepatology.2021; 33(12): 1603. CrossRef - Statins in Non-alcoholic Steatohepatitis
Jose D. Torres-Peña, Laura Martín-Piedra, Francisco Fuentes-Jiménez
Frontiers in Cardiovascular Medicine.2021;[Epub] CrossRef - Comparison of the liver findings after simvastatin-treatment between Spontaneously Diabetic Torii-Leprfa (SDT fatty) rats and Sprague-Dawley rats
Tadakazu Takahashi, Yusuke Suzuki, Naohito Yamada, Kaoru Toyoda, Keisuke Goda, Katsunori Ryoke, Chizuru Matsuura, Akio Kobayashi, Shoichiro Sugai, Kayoko Shimoi
Fundamental Toxicological Sciences.2020; 7(1): 41. CrossRef - Current and emerging pharmacotherapeutic interventions for the treatment of liver fibrosis
Joeri Lambrecht, Leo A. van Grunsven, Frank Tacke
Expert Opinion on Pharmacotherapy.2020; 21(13): 1637. CrossRef - The Influence of Statins on the Aerobic Metabolism of Endothelial Cells
Izabela Broniarek, Karolina Dominiak, Lukasz Galganski, Wieslawa Jarmuszkiewicz
International Journal of Molecular Sciences.2020; 21(4): 1485. CrossRef - NADPH Oxidase Inhibition in Fibrotic Pathologies
Karen Bernard, Victor J. Thannickal
Antioxidants & Redox Signaling.2020; 33(6): 455. CrossRef - Pleiotropic Effects of Statins in the Light of Non-Alcoholic Fatty Liver Disease and Non-Alcoholic Steatohepatitis
Farah Ahsan, Federico Oliveri, Harshit K Goud, Zainab Mehkari, Lubna Mohammed, Moiz Javed, Aldanah Althwanay, Ian H Rutkofsky
Cureus.2020;[Epub] CrossRef - Peroxisomal footprint in the pathogenesis of nonalcoholic steatohepatitis
S.M. Touhidul Islam, Jeseong Won, Mushfiquddin Khan, Kenneth D. Chavin, Inderjit Singh
Annals of Hepatology.2020; 19(5): 466. CrossRef - Structural Basis for Activation of Human Sirtuin 6 by Fluvastatin
Weijie You, Clemens Steegborn
ACS Medicinal Chemistry Letters.2020; 11(11): 2285. CrossRef - Specificity of transaminase activities in the prediction of drug-induced hepatotoxicity
Akio Kobayashi, Yusuke Suzuki, Shoichiro Sugai
The Journal of Toxicological Sciences.2020; 45(9): 515. CrossRef - Disease-associated gut microbiome and metabolome changes in patients with chronic obstructive pulmonary disease
Kate L. Bowerman, Saima Firdous Rehman, Annalicia Vaughan, Nancy Lachner, Kurtis F. Budden, Richard Y. Kim, David L. A. Wood, Shaan L. Gellatly, Shakti D. Shukla, Lisa G. Wood, Ian A. Yang, Peter A. Wark, Philip Hugenholtz, Philip M. Hansbro
Nature Communications.2020;[Epub] CrossRef - Simvastatin Reduces Hepatic Oxidative Stress and Endoplasmic Reticulum Stress in Nonalcoholic Steatohepatitis Experimental Model
Graziella Rodrigues, Andrea Janz Moreira, Silvia Bona, Elizângela Schemitt, Cláudio Augusto Marroni, Fábio Cangeri Di Naso, Alexandre Simões Dias, Thienne Rocha Pires, Jaqueline Nascimento Picada, Norma Possa Marroni
Oxidative Medicine and Cellular Longevity.2019; 2019: 1. CrossRef - Impaired Peroxisomal Fitness in Obese Mice, a Vicious Cycle Exacerbating Adipocyte Dysfunction via Oxidative Stress
Lingjuan Piao, Debra Dorotea, Songling Jiang, Eun Hee Koh, Goo Taeg Oh, Hunjoo Ha
Antioxidants & Redox Signaling.2019; 31(18): 1339. CrossRef - (5R)-5-hydroxytriptolide ameliorates liver lipid accumulation by suppressing lipid synthesis and promoting lipid oxidation in mice
Yunxia Dong, Henglei Lu, Qiang Li, Xinming Qi, Yuanchao Li, Zean Zhang, Jing Chen, Jin Ren
Life Sciences.2019; 232: 116644. CrossRef - Simvastatin alleviates bone resorption in apical periodontitis possibly by inhibition of mitophagy‐related osteoblast apoptosis
C.‐N. Yang, S.‐H. Kok, H.‐W. Wang, J. Z.‐C. Chang, E. H.‐H. Lai, C.‐T. Shun, H. Yang, M.‐H. Chen, C.‐Y. Hong, S.‐K. Lin
International Endodontic Journal.2019; 52(5): 676. CrossRef - Different Effects of Pravastatin on Preeclampsia-like Symptoms in Different Mouse Models
Jing Huai, Zi Yang, Yan-Hong Yi, Guang-Jiao Wang
Chinese Medical Journal.2018; 131(4): 461. CrossRef - Ameliorating effects of D-47, a newly developed compound, on lipid metabolism in an animal model of familial hypercholesterolemia (WHHLMI rabbits)
Shohei Tamura, Yui Koike, Hiroaki Takeda, Tomonari Koike, Yoshihiro Izumi, Ryosuke Nagasaka, Tetsuto Tsunoda, Motoo Tori, Kazuo Ogawa, Takeshi Bamba, Masashi Shiomi
European Journal of Pharmacology.2018; 822: 147. CrossRef - Fluvastatin activates sirtuin 6 to regulate sterol regulatory element-binding proteins and AMP-activated protein kinase in HepG2 cells
Ji-Hye Kim, Jun Mi Lee, Jong-Hoon Kim, Kwang Rok Kim
Biochemical and Biophysical Research Communications.2018; 503(3): 1415. CrossRef - Statin use and the risk of hepatocellular carcinoma in patients at high risk: A nationwide nested case-control study
Gyuri Kim, Suk-Yong Jang, Chung Mo Nam, Eun Seok Kang
Journal of Hepatology.2018; 68(3): 476. CrossRef - Membrane Remodeling as a Key Player of the Hepatotoxicity Induced by Co-Exposure to Benzo[a]pyrene and Ethanol of Obese Zebrafish Larvae
Muhammad Imran, Odile Sergent, Arnaud Tête, Isabelle Gallais, Martine Chevanne, Dominique Lagadic-Gossmann, Normand Podechard
Biomolecules.2018; 8(2): 26. CrossRef - Corticosterone-Induced Lipogenesis Activation and Lipophagy Inhibition in Chicken Liver Are Alleviated by Maternal Betaine Supplementation
Yun Hu, Qinwei Sun, Yan Hu, Zhen Hou, Yibo Zong, Nagmeldin A Omer, Halima Abobaker, Ruqian Zhao
The Journal of Nutrition.2018; 148(3): 316. CrossRef - Simvastatin protects against acetaminophen-induced liver injury in mice
Huan Liang, Yang Feng, Ruixia Cui, Minglong Qiu, Jingyao Zhang, Chang Liu
Biomedicine & Pharmacotherapy.2018; 98: 916. CrossRef - Effects of Pitavastatin on Insulin Sensitivity and Liver Fat: A Randomized Clinical Trial
Laurie R Braun, Meghan N Feldpausch, Natalia Czerwonka, Julian Weiss, Karen Branch, Hang Lee, Edgar L Martinez-Salazar, Martin Torriani, Craig A Sponseller, Steven K Grinspoon, Takara L Stanley
The Journal of Clinical Endocrinology & Metabolism.2018; 103(11): 4176. CrossRef - Inactivation of SREBP-1a Phosphorylation Prevents Fatty Liver Disease in Mice: Identification of Related Signaling Pathways by Gene Expression Profiles in Liver and Proteomes of Peroxisomes
Birgit Knebel, Sonja Hartwig, Sylvia Jacob, Ulrike Kettel, Martina Schiller, Waltraud Passlack, Cornelia Koellmer, Stefan Lehr, Dirk Müller-Wieland, Jorg Kotzka
International Journal of Molecular Sciences.2018; 19(4): 980. CrossRef - MicroRNA-124 Regulates Fatty Acid and Triglyceride Homeostasis
Tyler A. Shaw, Ragunath Singaravelu, Megan H. Powdrill, Jordan Nhan, Nadine Ahmed, Dennis Özcelik, John Paul Pezacki
iScience.2018; 10: 149. CrossRef - Liver Disease in Singapore
Mark Muthiah, Chern H Chong, Seng G Lim
Euroasian Journal of Hepato-Gastroenterology.2018; 8(1): 66. CrossRef - Accelerating Treatment of Skeletal Class II Malocclusion using Fixed Twin Block Appliances
Snigdha Pattanaik, Navya Puvvula, Noorjahan Mohammad
International Journal of Clinical Pediatric Dentistry.2018; 11(2): 146. CrossRef - Effect of a Papain-based Chemomechanical Agent on Structure of Dentin and Bond Strength: Anin vitroStudy
Veena S Pai, Yashwanth Gowda, Sruthi Nair
International Journal of Clinical Pediatric Dentistry.2018; 11(3): 161. CrossRef - Perception of Indian Dental Surgeons regarding Molar Incisor Hypomineralization
Sumita Upadhyay, Jatinder K Dhillon
International Journal of Clinical Pediatric Dentistry.2018; 11(2): 116. CrossRef - Association between Obesity and Oral Health Status in Schoolchildren: A Survey in Five Districts of West Bengal, India
Rahul Kaul, Paras Angrish, Subrata Saha, Sonali Halder, Bhaswar Bhattacharya, Malay Mitra
International Journal of Clinical Pediatric Dentistry.2018; 11(3): 233. CrossRef - Burden of Alcoholic Liver Disease: Bhutan Scenario
Pelden Wangchuk
Euroasian Journal of Hepato-Gastroenterology.2018; 8(1): 81. CrossRef - Comparative Evaluation of Effects ofTriphala, Garlic Extracts, and Chlorhexidine Mouthwashes on SalivaryStreptococcus mutansCounts and Oral Hygiene Status
Shweta Gupta, Narendra Padiyar, Bharathi Padiyar
International Journal of Clinical Pediatric Dentistry.2018; 11(4): 299. CrossRef - Evaluation of Dentin–Pulp Complex Response after Conservative Clinical Procedures in Primary Teeth
Thais Marchini Oliveira, Bianca Mello, Tassia C Stafuzza, Luciana Vitor, Daniela Rios, Thiago Silva, Maria Machado
International Journal of Clinical Pediatric Dentistry.2018; 11(3): 188. CrossRef - Nonalcoholic Fatty Liver Disease: Time to Take the Bull by the Horns
Preetam Nath, Shivaram P Singh
Euroasian Journal of Hepato-Gastroenterology.2018; 8(1): 47. CrossRef - F-18 Fluorodeoxyglucose Positron Emission Tomography/ Computed Tomography Findings of Isolated Gastric Tuberculosis mimicking Gastric Cancer and Lymphoma
Remzi A Akdogan, Halil Rakici, Serkan Güngör, Recep Bedir, Elif Akdogan
Euroasian Journal of Hepato-Gastroenterology.2018; 8(1): 93. CrossRef - Clinical, Radiological, and Histological Assessment of Magnetic Nanoparticles as Pulpotomy Medicament in Primary Molars
Manoj K Mallela, Harivinder R Konyala, Ajay R Mareddy, N Venugopal Reddy, Keerthi P Susheela
International Journal of Clinical Pediatric Dentistry.2018; 11(4): 283. CrossRef - Determination of ABO Blood Groups and Rh Typing from Dry Salivary Samples
Laxmi Lakade, Priyam R Velani
International Journal of Clinical Pediatric Dentistry.2018; 11(2): 100. CrossRef - Orofacial Manifestations of Leukemic Children on Treatment: A Descriptive Study
Keerthilatha M Pai, Aparna Aggarwal
International Journal of Clinical Pediatric Dentistry.2018; 11(3): 193. CrossRef - Mandibular Regional Odontodysplasia in an 8-year-old Boy showing Teeth Disorders, Gubernaculum Tracts, and Altered Bone Fractal Pattern
Davi de Sá Cavalcante, Cristiane SR Fonteles, Thyciana R Ribeiro, Lúcio M Kurita, Alynne Vde M Pimenta, Francisco SR Carvalho, Fábio WG Costa
International Journal of Clinical Pediatric Dentistry.2018; 11(2): 128. CrossRef - Evaluation of Chemokines in the Gingival Crevicular Fluid of Children with Down Syndrome
Harshini Togaru, Veerakishore Kumar Reddy, Naveen K Kommineni, Prathyusha Padakandla, John P Indupalli, Swapna P Nanga
International Journal of Clinical Pediatric Dentistry.2018; 11(4): 288. CrossRef - Hepatitis B Virus Infection among Health Care Workers in Indonesia
David H Muljono, Teguh Wijayadi, Rizalinda Sjahril
Euroasian Journal of Hepato-Gastroenterology.2018; 8(1): 88. CrossRef - Comparison of the Effectiveness of Probiotic, Chlorhexidine-based Mouthwashes, and Oil Pulling Therapy on Plaque Accumulation and Gingival Inflammation in 10- to 12-year-old Schoolchildren: A Randomized Controlled Trial
Saravana K Kandaswamy, Asokan Sharath, PR Geetha Priya
International Journal of Clinical Pediatric Dentistry.2018; 11(2): 66. CrossRef - Evaluation of Changes in Salivary pH after Intake of Different Eatables and Beverages in Children at Different Time Intervals
Ankit Pachori, Haalaswamy Kambalimath, Garima Bhambhani, Garima Malhotra
International Journal of Clinical Pediatric Dentistry.2018; 11(3): 177. CrossRef - Customized Hybrid Bluegrass Appliance: An Innovative Technique
Ziauddin Mohammad, Apeksha Bagalkotkar, Ashank Mishra, Gopi Veerala
International Journal of Clinical Pediatric Dentistry.2018; 11(2): 141. CrossRef - Postobstructive Cyst Formation in Pancreatic Duct affecting Surgical Approach
Alper Parlakgumus, Ali Ezer
Euroasian Journal of Hepato-Gastroenterology.2018; 8(1): 99. CrossRef - Validating the Usage of Cariogram in 5- and 12-year-old School-going Children in Paonta Sahib, Himachal Pradesh, India: A 12-month Prospective Study
Manish Madan, Pallav Singhal, Anu Garg, Akash Dupper
International Journal of Clinical Pediatric Dentistry.2018; 11(2): 110. CrossRef - Epidemiology of Chronic Hepatitis B in Turkey
Hasan Ozkan
Euroasian Journal of Hepato-Gastroenterology.2018; 8(1): 73. CrossRef - A Comparative Evaluation of Time-dependent Changes on the Surface Hardness of Bulk Cure Composites: Anin vitroStudy
Anindita Sarma
International Journal of Clinical Pediatric Dentistry.2018; 11(3): 183. CrossRef - Management of Hepatocellular Carcinoma: Bangladesh Perspective
Mohammad Noor-E-Alam
Euroasian Journal of Hepato-Gastroenterology.2018; 8(1): 52. CrossRef - Trichobezoar: Ravenous for Hair
Aman Kamra
Euroasian Journal of Hepato-Gastroenterology.2018; 8(1): 97. CrossRef - Comparative Evaluation of the Fracture Resistance of Two Different Fiber-reinforced Composite Restorations with Particulate Filler Composite Restorations
Vanga V Narasimha Rao, Srinivas K Chandrabhatla, Vabbala R Rajasekhar
International Journal of Clinical Pediatric Dentistry.2018; 11(4): 277. CrossRef - A Comparative Evaluation of Efficacy ofStreptococcus mutansCounts in Saliva: Anin vivoStudy
Inder K Pandit
International Journal of Clinical Pediatric Dentistry.2018; 11(2): 94. CrossRef - Liver Cancer in Nepal
Ananta Shrestha
Euroasian Journal of Hepato-Gastroenterology.2018; 8(1): 63. CrossRef - Pre-eruptive Intracoronal Radiolucency in First Permanent Molar
Mariana C Ilha, Paulo F Kramer, Simone H Ferreira, Henrique C Ruschel
International Journal of Clinical Pediatric Dentistry.2018; 11(2): 151. CrossRef - Comparative Evaluation of Various Temperature Changes on Stress Distribution in Class II Mesial-occlusal-distal Preparation restored with Different Restorative Materials: A Finite Element Analysis
Binita Srivastava, Neorem N Devi
International Journal of Clinical Pediatric Dentistry.2018; 11(3): 167. CrossRef - A Survey on the Use of Antibiotics among the Dentists of Kolkata, West Bengal, India
Rahul Kaul, Paras Angrish, Subrata Saha, Ashok V Sengupta, Shantanu Mukherjee
International Journal of Clinical Pediatric Dentistry.2018; 11(2): 122. CrossRef - Changing Etiology in Liver Cirrhosis in Sapporo, Japan
Jong-Hon Kang, Takeshi Matsui
Euroasian Journal of Hepato-Gastroenterology.2018; 8(1): 77. CrossRef - Epidemiology, Genotype Distribution, Prognosis, Control, and Management of Viral Hepatitis B, C, D, and Hepatocellular Carcinoma in Mongolia
Oidov Baatarkhuu, Tsagaantsooj Gerelchimeg, Dashchirev Munkh-Orshikh, Badamnachin Batsukh, Ganbold Sarangua, Jazag Amarsanaa
Euroasian Journal of Hepato-Gastroenterology.2018; 8(1): 57. CrossRef - Impact of Diabetes Mellitus Type 1 on Lebanese Families’ Quality of Life
Nahla Nassif, Balsam Noueiri
International Journal of Clinical Pediatric Dentistry.2018; 11(2): 61. CrossRef - Pediatric Dental Appointments No-show: Rates and Reasons
Anup Panda, Rupinder Bhatia, Esha C Vora
International Journal of Clinical Pediatric Dentistry.2018; 11(3): 171. CrossRef - A Case of Painless Excision
Rupinder Bhatia, Ipshita A Suyash
International Journal of Clinical Pediatric Dentistry.2018; 11(2): 135. CrossRef - Manuka Honey: A Potent Cariostatic Agent–Anin vitroStudy
Sapna Konde, Javaregowda P Beena, Punyatoya Sahoo, N Sunil Raj, Narayana C Kumar
International Journal of Clinical Pediatric Dentistry.2018; 11(2): 105. CrossRef - Reviewing of Research Finding of Hepatitis B Virus Infection in Lao People's Democratic Republic
Angkham Ounavong
Euroasian Journal of Hepato-Gastroenterology.2018; 8(1): 75. CrossRef - Nonalcoholic Fatty Liver Disease: Identifying the Disease Burden in Sri Lanka
Anuradha S Dassanayake
Euroasian Journal of Hepato-Gastroenterology.2018; 8(1): 69. CrossRef - Comparative Evaluation of Microhardness by Common Drinks on Esthetic Restorative Materials and Enamel: Anin vitroStudy
Manish Madan, Akash Dupper, Roli Gupta, Trilok Kainthla
International Journal of Clinical Pediatric Dentistry.2018; 11(3): 155. CrossRef - Hepatocellular Carcinoma Surveillance: Benefit of Serum Alfa-fetoprotein in Real-world Practice
Patharapan Lersritwimanmaen, Supot Nimanong
Euroasian Journal of Hepato-Gastroenterology.2018; 8(1): 83. CrossRef - Body Mass Index and Dental Caries: A Systematic Review
International Journal of Clinical Pediatric Dentistry.2018; 11(3): 228. CrossRef - Evaluation of Surgical Options for Supernumerary Teeth in the Anterior Maxilla
Gianluca Porcaro, Luca Mirabelli, Ernesto Amosso
International Journal of Clinical Pediatric Dentistry.2018; 11(4): 294. CrossRef - A Comparative Study to evaluate Parent's Ability to assess Dental Fear in their 6- to 10-year-old Children using Children's Fear Survey Schedule—Dental Subscale
Ritika Malhotra, Anchal Sahni
International Journal of Clinical Pediatric Dentistry.2018; 11(3): 205. CrossRef - Estimation of Salivary Glucose, Calcium, Phosphorus, Alkaline Phosphatase, and Immunoglobulin A among Diabetic and Nondiabetic Children: A Case–Control Study
Kalyani Uppu, Suzan Sahana, Ghanashyam P Madu, Aron AK Vasa, Sowjanya Nalluri
International Journal of Clinical Pediatric Dentistry.2018; 11(2): 71. CrossRef - Pedodontic Considerations in a Child with Attention Deficit Hyperactivity Disorder: Literature Review and a Case Report
Siddhi Sinha, Prasanna Praveen, S Prathibha Rani, Athimuthu Anantharaj
International Journal of Clinical Pediatric Dentistry.2018; 11(3): 254. CrossRef - Salivary Cortisol and Alpha-amylase—Biomarkers of Stress in Children undergoing Extraction: Anin vivoStudy
Neha Agarwal, Shefali Chaturvedy, Saurabh Chaturvedi, Yogita Chaturvedi
International Journal of Clinical Pediatric Dentistry.2018; 11(3): 214. CrossRef - Influence of Storage Media and Duration of Fragment in the Media on the Bond Strength of the Reattached Tooth Fragment
Prashant Jalannavar
International Journal of Clinical Pediatric Dentistry.2018; 11(2): 83. CrossRef - Comparative Evaluation of Mucosal Vibrator with Topical Anesthetic Gel to reduce Pain during Administration of Local Anesthesia in Pediatric Patients: Anin vivoStudy
Mahima Gandhi, Garima Kalia, Khushboo Rathore
International Journal of Clinical Pediatric Dentistry.2018; 11(4): 261. CrossRef - Management of Autistic Patients in Dental Office: A Clinical Update
Jyothi S Bommangoudar
International Journal of Clinical Pediatric Dentistry.2018; 11(3): 219. CrossRef - Foreign Body causing Displacement of Immature Fractured Apical Root Fragment: An Unusual Case Report
Aman Moda, Rajesh Singla, Preeti M Agrawal
International Journal of Clinical Pediatric Dentistry.2018; 11(3): 247. CrossRef - Validity and Reliability of the Hindi Version of the Modified Child Perceptions Questionnaire 11 to 14
Mohit Sharma, Prasanna Kumar, Dempsy CM Mandanna
International Journal of Clinical Pediatric Dentistry.2018; 11(4): 271. CrossRef - Nonsyndromic Gingival Fibromatosis: A Rare Case Report
Mahima Gandhi, Akshat Vijay
International Journal of Clinical Pediatric Dentistry.2018; 11(3): 250. CrossRef - Prevalence of Deleterious Oral Habits among 3- to 5-yearold Preschool Children in Bhubaneswar, Odisha, India
Brahmananda Dutta, Tulika Verma
International Journal of Clinical Pediatric Dentistry.2018; 11(3): 210. CrossRef - Evaluation of Antimicrobial Activity of Two Endodontic Sealers: Zinc Oxide with Thyme Oil and Zinc Oxide Eugenol against Root Canal Microorganisms—Anin vitroStudy
Manoj Chandak, Nilima Thosar, Silpi Basak
International Journal of Clinical Pediatric Dentistry.2018; 11(2): 79. CrossRef - Prevalence and Risk Factors for Dental Caries among Preschool Children: A Cross-sectional Study in Eastern India
Vinay K Chugh, Kushal K Sahu, Ankita Chugh
International Journal of Clinical Pediatric Dentistry.2018; 11(3): 238. CrossRef - Squamous Papilloma on Hard Palate: Case Report and Literature Review
Penmatsa Chaitanya, Satyam Martha, Ramachandran Punithvathy, Madhusudhan Reddy
International Journal of Clinical Pediatric Dentistry.2018; 11(3): 244. CrossRef - Comparison of Vitamin D Level of Children with Severe Early Childhood Caries and Children with No Caries
Anchal Chhonkar, Vishal Arya
International Journal of Clinical Pediatric Dentistry.2018; 11(3): 199. CrossRef - Use of “Surface Analyzer” to evaluate the Effect of Two Polishing Systems on Surface Texture of Four Newer Composites
Shefally Garg, Munish Goel, Shweta Verma, Nanika Mahajan, Bhawna Kaul, Vikas Garg
International Journal of Clinical Pediatric Dentistry.2018; 11(4): 266. CrossRef - Clinical Evaluation of Preventive Effect of Fissure Sealants on Initial Carious Lesion of Permanent Mandibular Molars Pretreated with and without Fluoride Varnish by Fluorescence Camera
Madhagudanahalli S Lakshmi, Kudlapur T Srilatha, Bhojraj Nandlal, Seema Deshmukh
International Journal of Clinical Pediatric Dentistry.2018; 11(2): 89. CrossRef - Hepatocellular Carcinoma in Malaysia and Its Changing Trend
Rosmawati Mohamed, Ruksana Raihan, Amirah Azzeri, Fatiha H Shabaruddin
Euroasian Journal of Hepato-Gastroenterology.2018; 8(1): 54. CrossRef - Advances in the Understanding and Treatment of Mitochondrial Fatty Acid Oxidation Disorders
Eric S. Goetzman
Current Genetic Medicine Reports.2017; 5(3): 132. CrossRef - Hepatokines: linking nonalcoholic fatty liver disease and insulin resistance
Ruth C. R. Meex, Matthew J. Watt
Nature Reviews Endocrinology.2017; 13(9): 509. CrossRef - In ovo injection of betaine alleviates corticosterone-induced fatty liver in chickens through epigenetic modifications
Yun Hu, Qinwei Sun, Jie Liu, Yimin Jia, Demin Cai, Abdulrahman A. Idriss, Nagmeldin A. Omer, Ruqian Zhao
Scientific Reports.2017;[Epub] CrossRef - The therapeutic effect of silymarin in the treatment of nonalcoholic fatty disease
Sheng Zhong, Yuxiang Fan, Qi Yan, Xingyu Fan, Bo Wu, Yujuan Han, Ying Zhang, Yong Chen, Huimao Zhang, Junqi Niu
Medicine.2017; 96(49): e9061. CrossRef - Atorvastatin reduces lipid accumulation in the liver by activating protein kinase A-mediated phosphorylation of perilipin 5
Xing Gao, Yang Nan, Yuanlin Zhao, Yuan Yuan, Bincheng Ren, Chao Sun, Kaiyu Cao, Ming Yu, Xuyang Feng, Jing Ye
Biochimica et Biophysica Acta (BBA) - Molecular and Cell Biology of Lipids.2017; 1862(12): 1512. CrossRef - Aerobic capacity mediates susceptibility for the transition from steatosis to steatohepatitis
E. Matthew Morris, Colin S. McCoin, Julie A. Allen, Michelle L. Gastecki, Lauren G. Koch, Steven L. Britton, Justin A. Fletcher, Xiarong Fu, Wen‐Xing Ding, Shawn C. Burgess, R. Scott Rector, John P. Thyfault
The Journal of Physiology.2017; 595(14): 4909. CrossRef - Use of Statins in Patients with Chronic Liver Disease and Cirrhosis: Current Views and Prospects
Jose Ignacio Vargas, Marco Arrese, Vijay H. Shah, Juan Pablo Arab
Current Gastroenterology Reports.2017;[Epub] CrossRef - Endogenous catalase delays high-fat diet-induced liver injury in mice
Lingjuan Piao, Jiyeon Choi, Guideock Kwon, Hunjoo Ha
The Korean Journal of Physiology & Pharmacology.2017; 21(3): 317. CrossRef - Clinical implications of understanding the association between oxidative stress and pediatric NAFLD
Jake P. Mann, Massimiliano Raponi, Valerio Nobili
Expert Review of Gastroenterology & Hepatology.2017; 11(4): 371. CrossRef
 PubReader
 Cite
Cite


