The Preventive Effects of 8 Weeks of Resistance Training on Glucose Tolerance and Muscle Fiber Type Composition in Zucker Rats
Article information
Abstract
Background
We investigated the therapeutic effects of resistance training on Zucker rats before and after the onset of diabetes to understand the importance of the timing of exercise intervention. We assessed whether 8 weeks of resistance training ameliorated impaired glucose tolerance and altered muscle fiber type composition in Zucker rats.
Methods
Five-week-old male Zucker rats were divided into Zucker lean control (ZLC-Con), non-exercised Zucker diabetic fatty (ZDF-Con), and exercised Zucker diabetic fatty (ZDF-Ex) groups. The ZDF-Ex rats climbed a ladder three times a week for 8 weeks. Intraperitoneal glucose tolerance tests (IPGTT) were performed on the 1st and 8th weeks of training, and grip strength was measured during the last week. We also measured glucose transporter 4 (GLUT4) expression by Western blot and immunofluorescence. Moreover, immunohistochemistry was performed to assess muscle fiber type composition.
Results
Fasting glucose levels and area under the curve responses to IPGTTs gradually increased as diabetes progressed in the ZDF-Con rats but decreased in the ZDF-Ex rats. Grip strength decreased in the ZDF-Con rats. However, resistance training did not improve grip strength in the ZDF-Ex rats. GLUT4 expression in the ZLC-Con and the ZDF-Con rats did not differ, but it increased in the ZDF-Ex rats. The proportions of myosin heavy chain I and II were lower and higher, respectively, in the ZDF-Con rats compared to the ZLC-Con rats. Muscle fiber type composition did not change in the ZDF-Ex rats.
Conclusion
Our results suggest that regular resistance training initiated at the onset of diabetes can improve glucose tolerance and GLUT4 expression without changing muscle morphology in Zucker rats.
INTRODUCTION
Type 2 diabetes mellitus (T2DM) is rapidly becoming a worldwide epidemic because of a combination of sedentary lifestyles, physical inactivity, high nutrient intake, and genetic factors. T2DM is characterized by hyperglycemia and hyperinsulinemia. Impaired glucose tolerance (IGT) is an intermediate condition between normal and diabetic status [12]. Chronic T2DM leads to extensive muscle dysfunction, including loss of skeletal muscle mass, muscle weakness, reduced oxidative capacity, and peripheral insulin resistance [3].
The Zucker diabetic fatty (ZDF) rat is a commonly used model for T2DM. This type of rat displays characteristics similar to T2DM in humans [45]. The progression of diabetes in the ZDF rats is defined by several age-dependent stages. The hyperglycemic condition rapidly progresses beginning at 4 weeks of age, and the blood glucose concentration reaches a maximal steady-state level after 12 weeks of age [5].
Skeletal muscles undergo glucose utilization and lipid metabolism. The metabolic characteristics of skeletal muscle depend on its mass and fiber type [678]. Mature rat skeletal muscle fibers are generally classified according to the presence of four different myosin heavy chain (MHC) isoforms: type I (slow oxidative), IIa (fast glycolytic/oxidative), IIx (hybrid), and IIb (fast glycolytic). Adult skeletal muscle demonstrates plasticity, with the ability to transform its fiber types, generally by switching between adjacent MHC isoforms (I↔IIa↔IIx↔IIb) in response to various external stimuli, including chronic contractile activity, loading state, motor neuron activity, and environmental and pathological conditions [910111213].
Chronic contractile activity during resistance training can stimulate transitions between muscle fiber types, which is accompanied by corresponding changes in metabolic function. Several studies have reported that resistance training can induce muscle fiber-type shifting from fast to slow and between MHC isoforms [141516171819]. Additionally, research suggests that hyperinsulinemia and diabetes cause muscle fiber-type switching from MHC I to MHC II [20]. Individuals with T2DM and their offspring have proportionally fewer type I fibers, and thus, oxidative enzyme activity is lower than in normal individuals. Additionally, glucose transporter protein 4 (GLUT4) expression, which is more abundant in slow muscle fibers than in fast muscle fibers, is decreased [21222324].
A number of studies have reported the effects of exercise on intraperitoneal glucose tolerance and IGT in chronic T2DM. However, the therapeutic effects of resistance exercise before and after the onset of diabetes have not been elucidated. Therefore, to obtain a better understanding of the importance of the timing of exercise intervention, we introduced resistance exercise training during the period (6 to 13 weeks of age) where diabetes characteristics in Zucker rats change most rapidly. GLUT4 expression and muscle fiber type composition were assessed to elucidate the effects of resistance exercise on skeletal muscle in diabetic rats.
METHODS
Animals and research design
Five-week-old male Zucker rats were used for the experiments. The animals were randomly assigned to one of the following groups: Zucker lean control (ZLC-Con, Lepr+/+; n=4); Zucker diabetic fatty control (ZDF-Con, Leprfa/fa; n=4); or Zucker diabetic fatty exercise (ZDF-Ex, n=4). All of the rats were housed in a controlled environment with a 12:12-hour light:dark cycle, and room temperature was maintained at 22℃. All of the rats were provided with water and food ad libitum as recommended by Genetic Models Co. (Purina, St. Louis, MO, USA). The animals were cared for in accordance with the Guide for the Care and Use of Laboratory Animals issued by the Institute of Laboratory Animal Resources, USA, 1996. The experimental protocol was approved by the Institutional Animal Care and Use Committee of Seoul National University. All of the experiments were conducted to minimize suffering and the number of animals used.
Resistance training protocol
The laddering exercise protocol was conducted according to the method by Lee et al. [25] with modifications. The rats in the ZDF-Ex group were forced to climb a vertical ladder (1 m long with 2 cm grid steps, inclined at 85°) 3 day/week for 8 weeks. Initially, the rats gained familiarity with the ladder by climbing without weight for 3 days during the adaptation period. The only encouragement necessary was an occasional handclap near the animal's tail. A food reward or stimulation, such as an electric shock or forced air, was not required. The initial weight attached to each animal's tail was 50% of its body weight. The rat was positioned at the bottom of the vertical ladder and was encouraged to climb with a slight touch to the tail. When the rat reached the top of the ladder, it was allowed to rest for 2 minutes. After the rest period, an additional 20 g of weight was added, and the rat was returned to the bottom of the ladder for subsequent climbs. If the rat was able to climb the ladder, an additional 20 g of weight was added on the next climb. This procedure was repeated until the rat climbed 10 times or the rat failed to climb the entire length of the ladder. In the subsequent exercise session, the initial intensity was set at 50% of the maximal weight lifted in the previous session during weeks 1 to 3, 70% of the maximal weight during weeks 4 to 6, and 80% of the maximal weight during the remaining weeks.
Intraperitoneal glucose tolerance test
Blood glucose concentration was measured by intraperitoneal glucose tolerance test (IPGTT) after 1 week of exercise training. The rats were given an intraperitoneal injection of 50% D-glucose solution (2 g/kg) and were fasted for 6 hours. Blood samples were drawn from the tail vein at 0, 15, 30, 60, 90, and 120 minutes after glucose administration. Blood glucose levels were measured using a glucometer (ACCU-CHEK; Roche Diagnostics, Mannheim, Germany).
Grip strength test
In the grip strength test, the rat grasped a thin bar attached to a force gauge. The rat was then pulled away from the gauge until its hindlimb and forelimb released the bar. This test provided a value for the force of maximal grip strength. The force measurements were recorded in three separate trials, and the maximum strength results were used in the analyses. Grip strength was measured during the last week of the exercise period using a Grip Strength Meter (Bioseb, Vitrolles Cedex, France). Once the rat grasped the grid with all its' limbs, the rat was pulled back gently but steadily until it released its' grip. The maximum force (g) achieved by the rat before it released the grid was recorded.
Sample collection
Forty-eight hours after exercise training, the rat was anesthetized with 30 mg/kg Zoletil 50 (Virbac, Carros, France) and perfused transcardially with 0.1 M phosphate-buffered saline (PBS, pH 7.4). The right side of the medial gastrocnemius muscle was extracted, snap frozen in liquid nitrogen, and stored at -80℃. The rat was then perfused transcardially with 4% paraformaldehyde in 0.1 M phosphate buffer (PB, pH 7.4). The left side of the medial gastrocnemius muscle was removed, fixed in 4% paraformaldehyde in 0.1 M PB (pH 7.4) overnight, and then embedded with 30% sucrose overnight. The paraffin-embedded muscle tissue was serially cut into 4 µm thick sections using a microtome (Leica Microsystems, Wetzlar, Germany).
Immunohistochemistry and immunofluorescence
Tissue sections were incubated with diluted mouse anti-myosin fast skeletal antibody (MY-32, 1:2,000; Novus Biologicals, Littleton, CO, USA) or rabbit anti-GLUT4 antibody (1:1,000; Novus Biologicals) overnight at 4℃. After washing, the slides were subsequently incubated with biotinylated goat anti-mouse immunoglobulin G (1:200; Vector Lavoratories, Burlingame, CA, USA) or fluorescein isothiocyanate (FITC)-conjugated antibody (1:50; Novus Biologicals) for 1 hour at room temperature under a foil cover to prevent fluorophore fading. The Vectastain avidin-biotin complex (ABC) kit (Vector Laboratories) was used for the ABC method according to the manufacturer's instructions. Peroxidase activity was visualized with 3,3'-diaminobenzidine tetrachloride (Sigma-Aldrich Co., St. Louis, MO, USA) in 0.1 M PBS. The sections were dehydrated and mounted in Canada balsam (Kanto, Tokyo, Japan). For immunofluorescence, the sections were mounted in Vectashield antifading medium (Vector Laboratories). The images were captured using an inverted microscope (ECLIPSE E100; Nikon, Kanagawa, Japan), or the slides were viewed by fluorescence microscopy (BX50; Olympus, Milan, Italy). The images were analyzed using INFINITYlite software (Innerview 2.0; Lumenera, Ottawa, ON, Canada). Approximately 800 fibers were analyzed in each muscle cross-section.
Western blot
The medial gastrocnemius muscle was rapidly homogenized in 1.0 mL of extraction buffer (RIPA; Sigma-Aldrich). The extracts were then centrifuged at 12,000 rpm at 4℃ for 15 minutes to remove the insoluble materials. The concentration of protein in the supernatant was measured using a BCA protein assay kit (Pierce Biotechnology, Rockford, IL, USA). The proteins were treated with Laemmli sample buffer containing dithiothreitol and were boiled for 5 minutes. Aliquots containing similar amounts of protein (2.5 µg/µL) were loaded onto a 8% sodium dodecyl sulfate polyacrylamide gel electrophoresis (SDS-PAGE) gel in a miniature slab gel apparatus (Bio-Rad, Hercules, CA, USA) and subjected to SDS-PAGE. The proteins were transferred to a nitrocellulose membrane for 3 hours at 160 V (constant voltage) in a miniature transfer apparatus (Bio-Rad). Nonspecific antibody binding to the nitrocellulose was reduced by pre-incubation in a blocking buffer (5% skim milk in Tris buffered saline with Tween 20 [TBS-T]: 10 mmol/L Tris, 150 mmol/L NaCl, and 0.02% Tween 20) for 1 hour at 22℃. The membranes were incubated overnight at 4℃ with antibodies against GLUT4, which was diluted in 3% skim milk/TBS-T, and then washed for 30 minutes in TBS-T. The blots were subsequently incubated with a peroxidase-conjugated secondary antibody for 90 minutes at room temperature with gentle stirring and then washed for 30 minutes. The blots were incubated for 2 minutes with Amersham ECL Prime Western Blotting Detection Reagent (GE Healthcare Life Sciences, Piscataway, NJ, USA), and chemiluminescence was detected using a charge-coupled device camera (LAS-2000; Fujifilm Life Science, Düsseldorf, Germany). The signals were quantified using the Multi Gauge version 3.0 (Fuji Photo Film Co., Tokyo, Japan) and NIH ImageJ software. The protein levels were normalized to the levels of α-tubulin.
Statistical analysis
Values are presented as mean±standard error. Statistical comparisons between the subgroups were assessed by one-way analysis of variance (ANOVA) with Tukey's and Scheffe's post hoc test. The week-to-week changes in exercise performance were assessed with one-way ANOVA with repeated measures. A P value of less than 0.05 was considered statistically significant.
RESULTS
Changes in body weight and medial gastrocnemius muscle weight
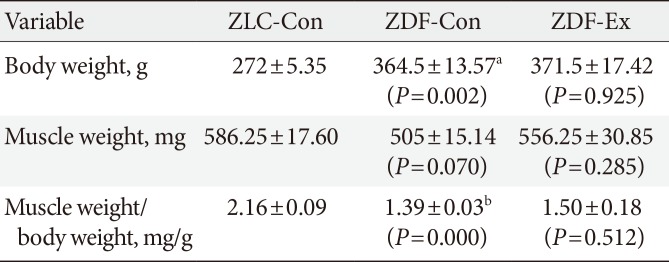
In the present study, the body weight of the ZDF-Con rats was higher than the ZLC-Con rats. However, the body weight of the ZDF-Ex and the ZDF-Con rats did not differ. The weight of the medial gastrocnemius muscle was not significantly different than any of the groups despite a relatively modest muscle weight gain of 10.1% in the ZDF-Ex rats. When muscle weight was divided by body weight, significant difference was observed between the ZLC-Con and the ZDF-Con rats (Table 1).

Body weight and gastrocnemius muscle characteristics
Grip strength and exercise performance
Muscle strength was approximately 36% lower in the ZDF-Con rats than in the ZLC-Con rats (P=0.009). Although a 30.3% increase in muscle strength was observed after 8 weeks of resistance exercise training, the change was not statistically significant (Table 2). Exercise performance progressively increased during the training period (P<0.001). At the end of training, the rats were able to lift 785 g, a weight 2.13-fold higher than their body weight (Table 3).

Grip-strength test

Changes in weekly exercise performance
Progression of diabetes
Blood glucose levels and blood glucose area under the curve (AUC) responses were measured during the first week of exercise training, before the onset of diabetes, and during the last week of training, after the onset of diabetes (Fig. 1). Blood glucose levels in the ZLC-Con, ZDF-Con, and ZDF-Ex rats were not significantly different in the first week. However, blood glucose levels had increased significantly in the ZDF-Con rats by the end of the training period (P<0.001 vs. ZLC-Con), whereas blood glucose levels in the ZDF-Ex rats hardly changed (P<0.001 vs. ZDF-Con). The AUC responses to IPGTTs during the 1st and 8th weeks followed a similar pattern as the blood glucose levels, except that the AUC response in the ZDF-Con rats was significantly higher (P<0.05) than that in the other groups during the first week. These results indicate that resistance exercise training alleviated the progressive worsening of the rat's diabetes status.
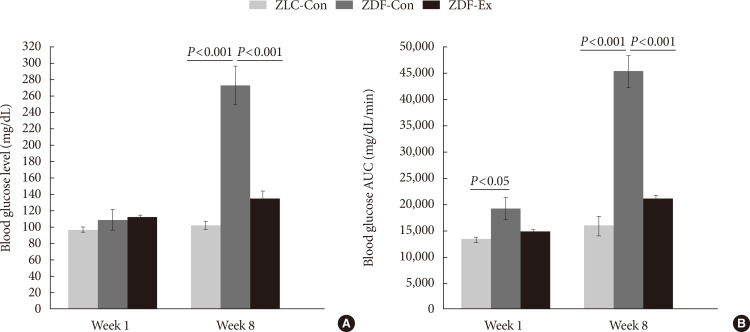
Fasting blood glucose levels (A) and blood glucose area under the curve (AUC) responses to intraperitoneal glucose tolerance tests (B) during the first and last weeks of exercise training; Zucker lean control (ZLC-Con), non-exercised Zucker diabetic fatty (ZDF-Con), and exercised Zucker diabetic fatty (ZDF-Ex). Values are presented as mean±standard error of mean.
Effect of exercise on IPGTT
The results of the IPGTTs in all of the groups are shown in Fig. 2. During the 1st week of exercise training, higher blood glucose levels were seen in the ZDF-Con rats compared to the ZLC-Con rats after injection (P=0.04), and the levels remained high for 120 minutes after the injection. However, there was no difference between the ZDF-Con rats and the ZDF-Ex rats (Fig. 2A). During the 8th week of exercise training, blood glucose levels remained high 120 minutes after glucose administration in the ZDF-Con rats (P<0.001). Blood glucose levels in the ZDF-Ex rats were significantly lower than the blood glucose levels in the ZDF-Con rats at each time point tested. These results suggest that 8 weeks of resistance exercise training was sufficient to control glucose intolerance in the ZDF-Ex rats.
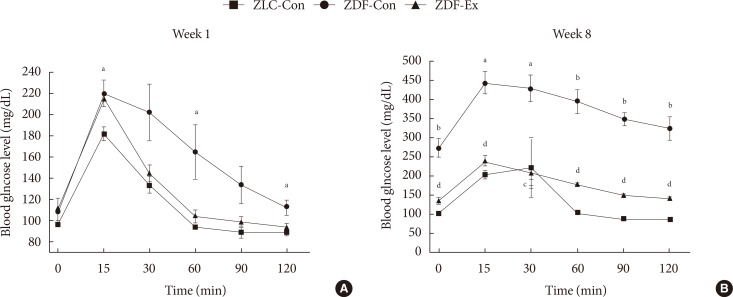
Changes in blood glucose levels during the (A) first and (B) last weeks of exercise training in the Zucker lean control (ZLC-Con), non-exercised Zucker diabetic fatty (ZDF-Con), and exercised Zucker diabetic fatty (ZDF-Ex) rats at 0 (baseline), 15, 30, 60, 90, and 120 minutes after glucose administration (2 g/kg). Values are presented as mean±standard error of mean. aP<0.05 vs. ZLC-Con, bP<0.001 vs. ZLC-Con, cP<0.05 vs. ZDF-Con, dP<0.001 vs. ZDF-Con.
GLUT4 expression
The relative expression of GLUT4 in skeletal muscles was assessed by Western blot (Fig. 3A). In the ZDF-Con rats, a 25.6% decrease in GLUT4 density was observed (7,565.01±824.26 vs. 10,167.15±1,781.58 in ZLC-Con), but the difference was not statistically significant. Interestingly, GLUT4 protein levels increased markedly in the ZDF-Ex rats after 8 weeks of resistance exercise training (14,259.26±2,073.51, P=0.044 vs. ZDF-Con). In addition, we performed immunofluorescence to observe the expression of GLUT4 protein in a cross-sectional area of the gastrocnemius muscle. There was more intense GLUT4 staining in the ZDF-Ex rats compared to the ZLC-Con and the ZDF-Con rats (Fig. 3B-D).

(A) Glucose transporter 4 (GLUT4) protein levels assessed by Western blot and immunofluorescence assay in the skeletal muscle of the (B) Zucker lean control (ZLC-Con), (C) non-exercised Zucker diabetic fatty (ZDF-Con), and (D) exercised Zucker diabetic fatty (ZDF-Ex) rats. Paraffin sections were incubated with GLUT4 antibody (1:1,000) and then with a fluorescein isothiocyanate-conjugated secondary antibody (1:50). Values are presented as mean±standard error of mean (immunofluorescence assay, ×400; scale bar=50 µm).
Muscle fiber type composition
We performed immunohistochemical staining with an MHC II (MY-32) antibody to classify the muscle fiber types and assess the composition of the medial gastrocnemius muscle (Fig. 4A-C). The percentage of MHC I fibers was significantly lower in the ZDF-Con rats than in the ZLC-Con rats, whereas the percentage of MHC II fibers was higher in the ZDF-Con rats than in the ZLC-Con rats (Fig. 4D and E). The ratio of MHC I:MHC II fibers in the ZLC-Con rats also differed from the ZDF-Con rats (0.28 in ZLC-Con rats and 0.17 in ZDF-Con rats, P=0.003) and the ZDF-Ex rats (0.21 in ZDF-Ex rats, P=0.004). However, the ratio in the ZDF-Ex rats was not significantly different from the ratio in the ZDF-Con rats (P=0.071). When the ZDF rats performed the resistance exercise, the percentage of MHC I fibers increased, while the percentage of MHC II fibers decreased. However, the results did not reach statistical significance (P=0.091).
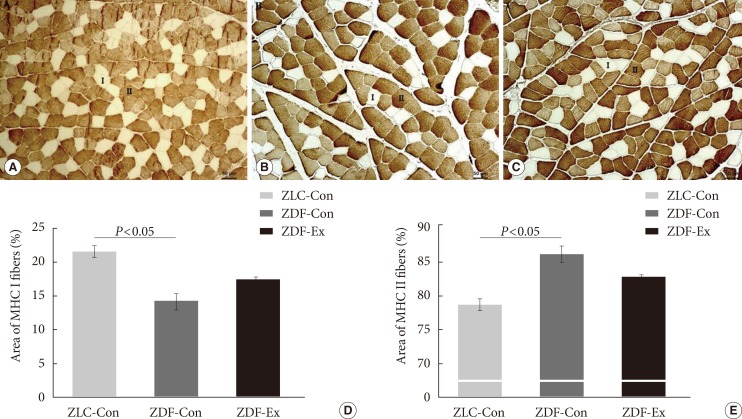
Immunohistochemistry was performed on the medial gastrocnemius muscle from the (A) Zucker lean control (ZLC-Con), (B) non-exercised Zucker diabetic fatty (ZDF-Con), and (C) exercised Zucker diabetic fatty (ZDF-Ex) rats. Paraffin sections of the muscle were immunostained with fast myosin heavy chain (MHC II) antibody (1:2,000 dilution). MHC I fibers were calculated from the unstained areas, and MHC II fibers were calculated from the stained areas, which appear dark (×100, scale bar=50 µm). The percentage of (D) MHC I-positive and (E) MHC II-positive areas were calculated using Innerview 2.0 software (Lumenera). Values are presented as mean±standard error of mean.
DISCUSSION
In this study, we investigated the therapeutic effects of resistance exercise training on Zucker rats before and after the onset of diabetes in order to obtain a better understanding of the importance of timing in exercise intervention. We also assessed the effects of exercise on GLUT4 expression in skeletal muscle and muscle fiber type composition. We found that progressive resistance training significantly: (1) reduced fasting blood glucose levels and AUC responses in diabetic rats and (2) increased GLUT4 levels in skeletal muscles. However, after 8 weeks of resistance training, skeletal muscle composition (fast/slow fiber) was not significantly altered.
The animal model used in this study is a commonly used model of T2DM, in which the animals show characteristics similar to T2DM in humans [45]. The hyperglycemia observed in these animals is due to an increase in hepatic production of very low density lipoproteins. Adipocytes increase both in size and in number, and the largest increase in the number of fat cells occurs in subcutaneous fat deposits. In the present study, although we scheduled the training period as fast as the rats were capable of climbing the ladder to minimize the progression of diabetes, the results of IPGTT and AUC during the 1st week of training in the ZDF-Con rats were higher than the normal group (Fig. 1B and 2A). These observations might be due to the hyperglycemic condition of the ZDF rat model, which rapidly progresses from 4 to 12 weeks of age [5]. In addition, the ZDF rats present with insulin insufficiency between 7 and 8 weeks old, and impaired glucose disposal and hepatic glucose output suppression are considered factors that contribute to the progression of diabetes. Several studies have described the beneficial effects of exercise intervention on several diagnostic criteria of diabetes, such as fasting glucose levels, fasting insulin levels, and glycosylated hemoglobin results, in T2DM in both patients and animal models [262728]. In contrast to these studies, our study focused on the timing of the intervention with respect to the progression of T2DM in Zucker rats.
We used a model of resistance training that comprised regular sessions of progressive ladder climbing. This model was developed to replicate exercise parameters and physiological changes in trained humans [29]. The resistance exercise stimulates various muscle groups, including the extensor digitorum longus, soleus, flexor hallucis longus, and gastrocnemius muscles. Studies have reported that the ladder climbing regimen produces a 5% to 34% increase in muscle mass, depending on the duration, frequency, and intensity of the training [30313233].
In the present investigation, the ladder climbing exercise protocol described by Lee et al. [25] was modified to increase the exercise intensity. Despite this change, 8 weeks of training did not alter body weight and muscle weight (Table 1). It is possible that anthropometrical changes do not always accompany improvements in glucose tolerance. A previous study indicated that resistance exercise on its own improved glucose tolerance without affecting body weight or muscle weight [34]. Similarly, even though the ZDF-Ex rats were able to carry increasingly heavier weights (range, 240 to 785 g) over the course of the training period, the grip strength of the ZDF-Con and the ZDF-Ex rats did not differ (Tables 2 and 3). However, muscle strength in the ZDF-Con rats was 35.9% lower than in the ZLC-Con rats, suggesting that diabetic rats have poor glucoregulation and consequent muscle weakness (Table 2).
In the present study, even though the resistance exercise training regimen was sufficient to improve glucose tolerance and insulin sensitivity through upregulation of GLUT4 expression (Fig. 3), it was not stringent enough to alter skeletal muscle fiber composition in the gastrocnemius of the ZDF rats (Fig. 4A-C). Histological analysis showed that the percentage of MHC I fibers increased by 28% and the percentage of MHC II fibers decreased by 8% in the ZDF-Ex rats, compared to the fiber composition in the ZDF-Con rats. However, the results did not reach statistical significance (P=0.091) (Fig. 4D and E).
In this present study, a low sample size (n=4) and large variation may have limited our ability to obtain statistically significant results. For future studies, it would be beneficial to compare aerobic exercise training to resistance training with respect to monitoring improvements in glucose tolerance. Furthermore, additional, more detailed muscle fiber type analysis (fast/slow fiber) using different muscles (i.e., forelimb vs. hindlimb) recruited from the training would clearly elucidate the effect of resistance training on changes in fiber type composition.
In conclusion, we demonstrated that 8 weeks of ladder climbing resistance training improved muscle glucose tolerance and insulin sensitivity in obese Zucker rats. Furthermore, GLUT4 levels in skeletal muscles increased as a result of the training. However, muscle composition was not altered. Taken together, our results indicate that three sessions per week of regular resistance training initiated at the onset of diabetes can improve glucose tolerance and GLUT4 expression without changing muscle morphology in Zucker rats. Thus, resistance training might serve as an adjunct therapy in diabetes. Our results have important practical relevance for the optimal design of exercise training programs for animal models of T2DM.
ACKNOWLEDGMENTS
This work was supported by National Research Foundation of Korea (NRF) funded by Ministry of Science, ICT and Future Planning (NRF-2013M3A9B046417, NRF-2013M3A9D5072550, and MEST 2011-0030135) and Ministry of Education (NRF-2014R1A1A2058645).
Notes
CONFLICTS OF INTEREST: No potential conflict of interest relevant to this article was reported.