Changing Clinical Characteristics according to Insulin Resistance and Insulin Secretion in Newly Diagnosed Type 2 Diabetic Patients in Korea
Article information
Abstract
Background
The role of increased insulin resistance in the pathogenesis of type 2 diabetes has been emphasized in Asian populations. Thus, we evaluated the proportion of insulin resistance and the insulin secretory capacity in patients with early phase type 2 diabetes in Korea.
Methods
We performed a cross-sectional analysis of 1,314 drug-naive patients with newly diagnosed diabetes from primary care clinics nationwide. The homeostasis model assessment of insulin resistance (HOMA-IR) was used as an index to measure insulin resistance, which was defined as a HOMA-IR ≥2.5. Insulin secretory defects were classified based on fasting plasma C-peptide levels: severe (<1.1 ng/mL), moderate (1.1 to 1.7 ng/mL) and mild to non-insulin secretory defect (≥1.7 ng/mL).
Results
The mean body mass index (BMI) was 25.2 kg/m2; 77% of patients had BMIs >23.0 kg/m2. Up to 50% of patients had central obesity based on their waist circumference (≥90 cm in men and 85 cm in women), and 70.6% had metabolic syndrome. Overall, 59.5% of subjects had insulin resistance, and 20.2% demonstrated a moderate to severe insulin secretory defect. Among those with insulin resistance, a high proportion of subjects (79.0%) had a mild or no insulin secretory defect. Only 2.6% of the men and 1.9% of the women had both insulin resistance and a moderate to severe insulin secretory defect.
Conclusion
In this study, patients with early phase type 2 diabetes demonstrated increased insulin resistance, but preserved insulin secretion, with a high prevalence of obesity and metabolic syndrome.
INTRODUCTION
There are several differences in the susceptibility to type 2 diabetes among ethnic groups [1]. In Asia, diabetes is distinguished by an explosive increase in its prevalence within a relatively short period of time and a trend toward developing diabetes with a lesser degree of obesity compared with patients in the West [2]. These characteristics have been explained by the fact that some Asians are unable to increase insulin secretion even if there is a slight decrease in insulin sensitivity because they have vulnerable β-cells [3]. Several relevant studies have demonstrated that β-cell dysfunction rather than insulin resistance may be the initial basis for diabetes development in Asian populations [45678].
Rapid socioeconomic change has occurred because of Westernization; the prevalence of obesity has gradually increased over the last decade. According to data from the Korean National Health and Nutrition Examination Surveys (KNHANES), the overall obesity prevalence in a Korean adult with a body mass index (BMI) >25 kg/m2 was 30.6% and the prevalence of metabolic syndrome was 31.3%, which has increased 0.6% annually since the late 1990s [910]. Recent reports demonstrate that up to 40% of diabetics are obese, which is approximately 2-fold greater than the rate reported 20 years ago, indicating that the Korean diabetic patient's body shape is changing rapidly [1112]. Obesity and metabolic syndrome are closely associated with insulin resistance [1314]. Based on these epidemiological characteristics, insulin resistance may be becoming increasingly important in the pathogenesis of impaired glucose metabolism.
Individualized therapy for patients with diabetes has recently been emphasized. It has therefore become more important to identify changes in the pathogenesis of diabetes to ensure appropriate treatment, and the characteristics of type 2 diabetics must be investigated from a pathophysiological perspective. One recent study revealed that the proportion of Korean type 2 diabetic patients with insulin resistance was greater than that of patients with insulin secretory defects [11]. However, this study consisted of patients who had a long duration of diabetes and who were already exposed to various antidiabetic drugs, which may have biased the evaluation of insulin resistance and β-cell dysfunction. Thus, limited data are available regarding the clinical characteristics of early phase diabetes based on insulin secretion and insulin resistance in Asian populations.
To address this issue, utilizing a nationwide cross-sectional primary care clinic-based study, we evaluated whether insulin resistance or insulin deficiency is a possible primary pathogenesis in newly diagnosed, drug-naive Korean patients with type 2 diabetes.
METHODS
Study subjects
The study was performed between September 2009 and July 2010. Data were collected using a nationwide cross-sectional primary care clinic-based format from a total of 100 organizations that were randomly selected based on the geographical population distribution. The geographical population distribution and sample representation were considered for subject recruitment. First, we evaluated the geographical population distribution using data from the National Statistical Office in 2008, and patients were distributed into equal proportions by dividing the total population among four regions. The allowable error for each region was ±15%. Patients who were older than 18 years of age and who had been diagnosed with type 2 diabetes within the past 3 months were selected. Type 2 diabetes was diagnosed based upon the 2009 American Diabetes Association guidelines [15], and patients with type 2 diabetes who had not been administered oral hypoglycemic agents were selected for the study. Patients with C-peptide levels less than 0.6 ng/mL or who had type 1 diabetes, defined as ketosis at diagnosis, were excluded. However, there might be a misclassification bias due to a lack of information about auto-antibodies for type 1 diabetes and genetic testing for maturity-onset diabetes of the young. Written informed consent was obtained from all subjects. The study protocol was performed in compliance with the Declaration of Helsinki principles (as revised in 2000) and was approved by the local Institutional Review Board.
Anthropometric and laboratory assessments
Height (m) and body weight (kg) were measured for all patients, and BMI (kg/m2) was calculated. Waist measurements (cm) were taken from the bottom of the lower lumbar spine to the middle of the pelvic iliac crest using a tapeline in the upright position. Systolic and diastolic blood pressure were measured with an automatic blood pressure gauge after 5 minutes of sitting to calm the patients. All subjects fasted for more than 8 hours before their blood was collected to measure the fasting plasma glucose (FPG), glycated hemoglobin, total cholesterol, high density lipoprotein cholesterol (HDL-C), triglyceride, low density lipoprotein cholesterol, fasting plasma insulin (FPI), and C-peptide levels. Pancreatic β-cell function and insulin resistance were calculated using the homeostasis model assessment (HOMA) index [16]: HOMA-insulin resistance (IR)=[FPI (µIU/mL)×FPG (mmol/L)]/22.5; HOMA-β=20×FPI (µIU/mL)/[FPG (mmol/L)-3.5]. Patients with a HOMA-IR ≥2.5 were placed into the insulin resistant group, and patients with a HOMA-IR <2.5 were placed into the insulin sensitive group [17]. Patients with fasting serum C-peptide concentrations <1.1 ng/mL (0.37 nmol/L), 1.1 to 1.7 ng/mL (0.37 to 0.56 nmol/L), or more than 1.7 ng/mL (0.57 nmol/L) were classified as having a severe secretory defect, moderate secretory defect, or mild to no secretory defect, respectively [1118].
Patients were standardized for obesity according to their BMIs following the Asia-Pacific region obesity standard as determined by the World Health Organization. Patients were classified as underweight (BMI <18.5 kg/m2), normal weight (BMI 18.5 to 22.9 kg/m2), overweight (BMI 23.0 to 24.9 kg/m2), obesity stage I (BMI 25.0 to 29.9 kg/m2), and obesity stage II (BMI ≥30 kg/m2) [19]. Men and women with waist circumferences >90 or 85 cm, respectively, were defined as having central obesity based on the Asia-Pacific region abdominal obesity standard [20]. Metabolic syndrome was defined according to the Modified Adult Treatment Panel III guidelines. Because all of the subjects had diabetes, the presence of metabolic syndrome was defined as a subject meeting two or more of the following criteria: (1) increased waist circumference (>90 cm for men and >85 cm for women); (2) elevated plasma triglyceride levels (≥1.69 mmol/L); (3) low plasma HDL-C levels (<1.04 mmol/L for men and <1.29 mmol/L for women); and (4) increased blood pressure (≥130 mm Hg systolic and/or ≥85 mm Hg diastolic) [21].
Statistical analysis
All data are represented as the mean±standard deviation or as percentages. The patient distribution data were based on the degree of obesity and metabolic syndrome components and were expressed as patient numbers and percentages. For study subjects with or without insulin resistance as assessed by HOMA-IR, significant differences in continuous and categorical variables were determined using independent t-test and chi-square tests, respectively. Statistical data analyses were performed utilizing SPSS version 11.00 (SPSS Inc., Chicago, IL, USA), and P<0.05 was considered to be statistically significant.
RESULTS
A total of 1,439 subjects participated in this study. Of these participants, 95 subjects did not comply with the inclusion and exclusion criteria; 20 subjects did not provide blood samples; one subject overlapped (did not comply with study criteria and did not provide blood samples); and nine type 1 diabetic patients with C-peptide levels <0.6 ng/mL were excluded from the study. Therefore, a total of 1,314 subjects (693 males [52.7%] and 621 females [47.3%]) were evaluated in the current study.
Table 1 shows the clinical and biochemical characteristics of the study subjects. The mean patient age was 55 years, and the mean BMI was 25.3 kg/m2 for men and 25.2 kg/m2 for women. The waist circumferences for men and women were 89.5 and 85.2 cm, respectively. Hypertension was the most frequent accompanying disorder (563 subjects, 42.8%), followed by dyslipidemia (315 subjects, 24.0%), and fatty liver (93 subjects, 7.1%). Overall, the FPG, triglyceride, HDL-C, and total cholesterol levels were 9.34, 10.26, 2.60, and 10.92 mmol/L, respectively. Male patients had significantly higher FPG (P=0.0091) and triglyceride (P<0.0001) levels but significantly lower HDL-C levels (P<0.0001) compared with female patients. The FPI, C-peptide, and glycosylated hemoglobin (HbA1c) levels were 14.0 µIU/mL, 1.02 mmol/L, and 7.6%, respectively, with no significant gender differences. The HOMA-IR and HOMA-β values were 6.18 and 29.4, respectively, and no significant gender differences were observed.

Baseline characteristics of the study subjects
As demonstrated in Fig. 1, 49.8% of the subjects were obese with BMIs >25.0 kg/m2, and 27.5% of all patients were overweight (BMI 23.0 to 24.9 kg/m2), indicating that 77.3% of the subjects were overweight or obese (BMI ≥23.0 kg/m2). Overall, the central obesity prevalence was 49.8%. In addition, 70.6% of the subjects had more than three of the five metabolic syndrome components; of these subjects, 68.4% were men and 73.3% were women. When classified according to insulin resistance, as shown in Table 2, the mean HbA1c level (7.93% vs. 7.25%, P<0.0001) was significantly higher in insulin resistant patients compared with insulin sensitive patients. As expected, the insulin resistant subjects also had a high prevalence of metabolic syndrome as well as central and overall obesity.
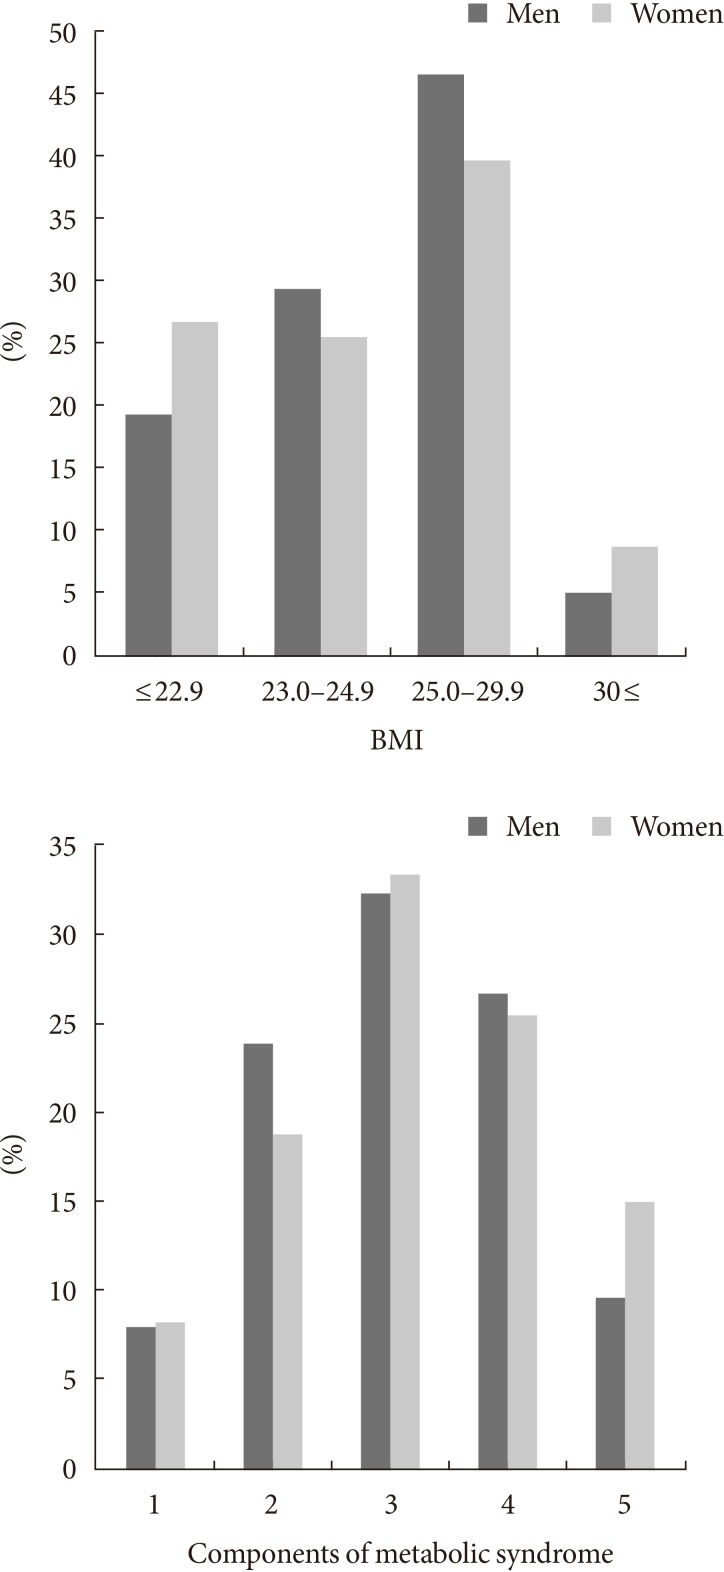
The proportion of study subjects according to body mass index (BMI) and the presence of metabolic syndrome among newly diagnosed patients with type 2 diabetes.

The relationship between HOMA-IR, C-peptide levels, metabolic syndrome, and obesity
When the subjects were divided according to their insulin resistance and insulin secretion phenotypes (Fig. 2), 782 patients (59.5%) exceeded a HOMA-IR of 2.5. In contrast, only 3.3% of patients had severe insulin secretory defects with C-peptide levels <1.1 ng/mL, while 17.7% of subjects had moderate insulin secretion defects; most of the subjects (79.0%) had mild or non-secretory defects. Only 2.6% of men and 1.9% of women had both insulin resistance and decreased insulin secretion. Consequently, the subjects who were insulin resistant with preserved insulin secretion were the most predominant group in this study.
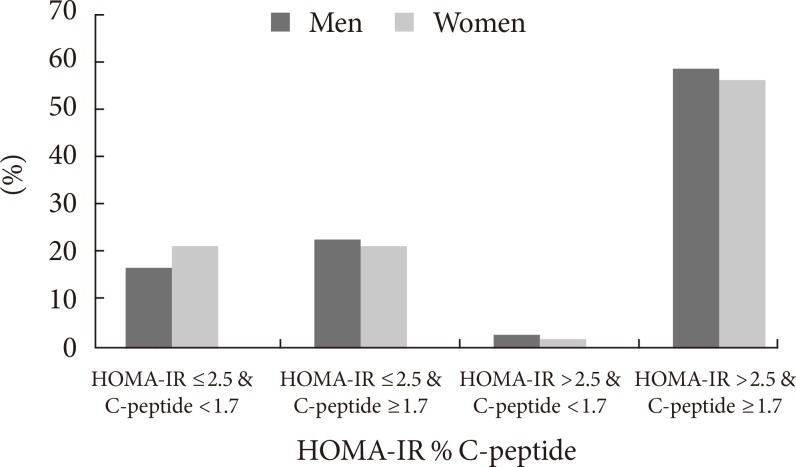
The proportion of study subjects according to insulin resistance and insulin secretion among newly diagnosed patients with type 2 diabetes. HOMA-IR, homeostasis model assessment of insulin resistance.
DISCUSSION
Although both insulin deficiency and insulin resistance are involved in type 2 diabetes pathogenesis, an investigation of the main pathogenesis involved in the development of type 2 diabetes is important. In the present study, only 21% of drug-naive patients with type 2 diabetes had moderate to severe insulin secretory defects, whereas 59.5% exhibited insulin resistance. Within the insulin resistant group, there was a high proportion of subjects with mild secretory defects (C-peptide >1.7 ng/mL). The patient group with both insulin resistance and insulin deficiency was the smallest (2.6% in men and 1.9% in women). These findings suggest that in Korea, insulin resistance is more likely related to the pathophysiology of type 2 diabetes than insulin deficiency.
Recently, obesity has increased because of rapid socioeconomic changes, consumption of a high fat diet, and low physical activity, and obesity is an important factor that has been associated with diabetes incidence since 2000 [22]. During this period, the mean BMI of Korean diabetics has gradually increased from 23.8 [23] to 25.6 kg/m2 [12]. Although 20% to 30% of diabetic patients were obese in the 1980s and 1990s [24], recent studies (including ours) have demonstrated that 40% to 50% of diabetics in Korea are obese [1112]. In addition to general obesity, up to 50% of the subjects in our study have central obesity. Asians demonstrate prominent central obesity at a given BMI, which may explain the different association between BMI and diabetes risk in interethnic groups [25]. This alteration in body fat distribution is another possible explanation for increased insulin resistance with less obesity in Asian populations compared with Western populations [2627]. Furthermore, a higher metabolic syndrome frequency of up to 80% was observed among type 2 diabetes patients, and these patients had exacerbated insulin resistance and worse glucose tolerance, which aligns with our results [28]. The prevalence of metabolic syndrome in Korean children and adolescents also doubled between KNHANES 1998 and KNHANES 2007 [29]. Together, these changes support the premise that insulin resistance prevalence explosively increased in Korean diabetics after rapid Westernization.
Several studies could potentially explain our findings. Because Korean populations are genetically close to Japanese populations, findings in diabetic Japanese Americans indicate how environmental changes can affect pathophysiologic heterogeneity in type 2 diabetic populations in Korea. Previously, comparing a study of Japanese individuals living in Hiroshima to those in Hawaii, the Hawaiian Japanese subjects demonstrated a higher prevalence of type 2 diabetes and increased insulin resistance without differences in insulin secretory capacity [30]. This finding explained the potential environmental effects on diabetes prevalence after Westernization. Data obtained from a 75-g oral glucose tolerance test also demonstrated that the prevalence of isolated impaired fasting glucose levels increased from 17% to 28.8% between the early 1990s [23] and the mid-2000s [31] in pre-diabetic Korean adults. The main pathogenesis of impaired fasting glucose levels is closely related with increased insulin resistance rather than an insulin secretory defect [32]. Therefore, this increasing importance of insulin resistance in pre-diabetes was aligned with the results of our study.
Unexpectedly, the ratio of subjects with insulin secretion disorders in our study was much lower than that of previous studies of Korean subjects. It is difficult to explain this discrepancy. Such differences among studies may have occurred because these previous studies were performed in a single center in an urban area, the subjects had diabetes for a longer period of time, or because the subjects were exposed to insulin secretagogues or insulin. However, our observation does not diminish the importance of β-cell dysfunction in the development of type 2 diabetes. There is a strong genetic susceptibility that is represented by early β-cell failure in some Asian populations. Numerous studies have already demonstrated the relative importance of an early phase insulin secretory defect compared with insulin resistance in the development of glucose intolerance, independent of the degree of obesity in Korean subjects [333435]. Thus, although C-peptide can be used to assess endogenous insulin secretion in our study [36], fasting C-peptide levels are not representative of the insulin secretory response or early diabetes progression. Taken together, we assumed that our subjects who were exposed to a Western lifestyle did not produce a sufficient insulin secretion response to overcome rapidly increasing insulin resistance, which resulted in higher diabetes prevalence. These results must be confirmed by further investigation.
The current study had some limitations. Although the HOMA-IR is a useful estimate of insulin resistance, certain limitations should be noted. HOMA-IR has merit because it is easily used to confirm type 2 diabetic patient clinical properties in large-scale studies, and reasonable reference intervals for HOMA-IR have recently been established. It was difficult to elucidate causal relationships because of the limitation of the cross-sectional design and because there were no comparative patient groups, such as those with a normal glucose tolerance or pre-diabetes, but we were able to demonstrate the clinical properties of newly diagnosed diabetes patients in a large, national investigation compared with other small cohort studies.
In conclusion, the present study demonstrated remarkably increased obesity and metabolic syndrome-associated insulin resistance in early phase diabetic patients in Korean populations. This finding suggests that the main pathogenesis of type 2 diabetes may have shifted from insulin deficiency to insulin resistance in the Korean population. Considering that insulin resistance-related components were modifiable, unlike β-cell dysfunction, which may be genetically determined, one must evaluate the degree of insulin resistance and establish individual treatment approaches for insulin resistance or insulin secretory defects. Based on our findings, interventions for improving insulin resistance would be a more effective treatment for newly diagnosed, drug-naïve Korean type 2 diabetics. In the future, along with multi-institutional prospective studies, more evidence is required to determine whether insulin secretion or insulin resistance is important for the type 2 diabetes pathophysiology in Asian populations.
Notes
CONFLICTS OF INTEREST: This work was supported by GlaxoSmithKline Korea, Inc.

