
- Current
- Browse
- Collections
-
For contributors
- For Authors
- Instructions to authors
- Article processing charge
- e-submission
- For Reviewers
- Instructions for reviewers
- How to become a reviewer
- Best reviewers
- For Readers
- Readership
- Subscription
- Permission guidelines
- About
- Editorial policy
Articles
- Page Path
- HOME > Diabetes Metab J > Volume 47(4); 2023 > Article
-
Original ArticleCardiovascular Risk/Epidemiology Two-Year Changes in Diabetic Kidney Disease Phenotype and the Risk of Heart Failure: A Nationwide Population-Based Study in Korea
-
Seung Eun Lee1
 , Juhwan Yoo2, Han Seok Choi1, Kyungdo Han3, Kyoung-Ah Kim1
 -
Diabetes & Metabolism Journal 2023;47(4):523-534.
DOI: https://doi.org/10.4093/dmj.2022.0096
Published online: April 25, 2023
- 1,662 Views
- 100 Download
1Division of Endocrinology and Metabolism, Department of Internal Medicine, Dongguk University Ilsan Hospital, Goyang, Korea
2Department of Biomedicine & Health Science, The Catholic University of Korea, Seoul, Korea
3Department of Statistics and Actuarial Science, Soongsil University, Seoul, Korea
- Corresponding authors: Kyoung-Ah Kim https://orcid.org/0000-0001-5629-830X Division of Endocrinology and Metabolism, Department of Internal Medicine, Dongguk University Ilsan Hospital, 27 Dongguk-ro, Ilsandong-gu, Goyang 10326, Korea E-mail: kyoung-ah.kim@dumc.or.kr
-
Kyungdo Han Department of Statistics and Actuarial Science, Soongsil University, 369 Sangdo-ro, Dongjak-gu, Seoul 06978, Korea E-mail: hkd@ssu.ac.kr
Copyright © 2023 Korean Diabetes Association
This is an Open Access article distributed under the terms of the Creative Commons Attribution Non-Commercial License (http://creativecommons.org/licenses/by-nc/4.0/) which permits unrestricted non-commercial use, distribution, and reproduction in any medium, provided the original work is properly cited.
ABSTRACT
-
Background
- Diabetic kidney disease (DKD) is a risk factor for hospitalization for heart failure (HHF). DKD could be classified into four phenotypes by estimated glomerular filtration rate (eGFR, normal vs. low) and proteinuria (PU, negative vs. positive). Also, the phenotype often changes dynamically. This study examined HHF risk according to the DKD phenotype changes across 2-year assessments.
-
Methods
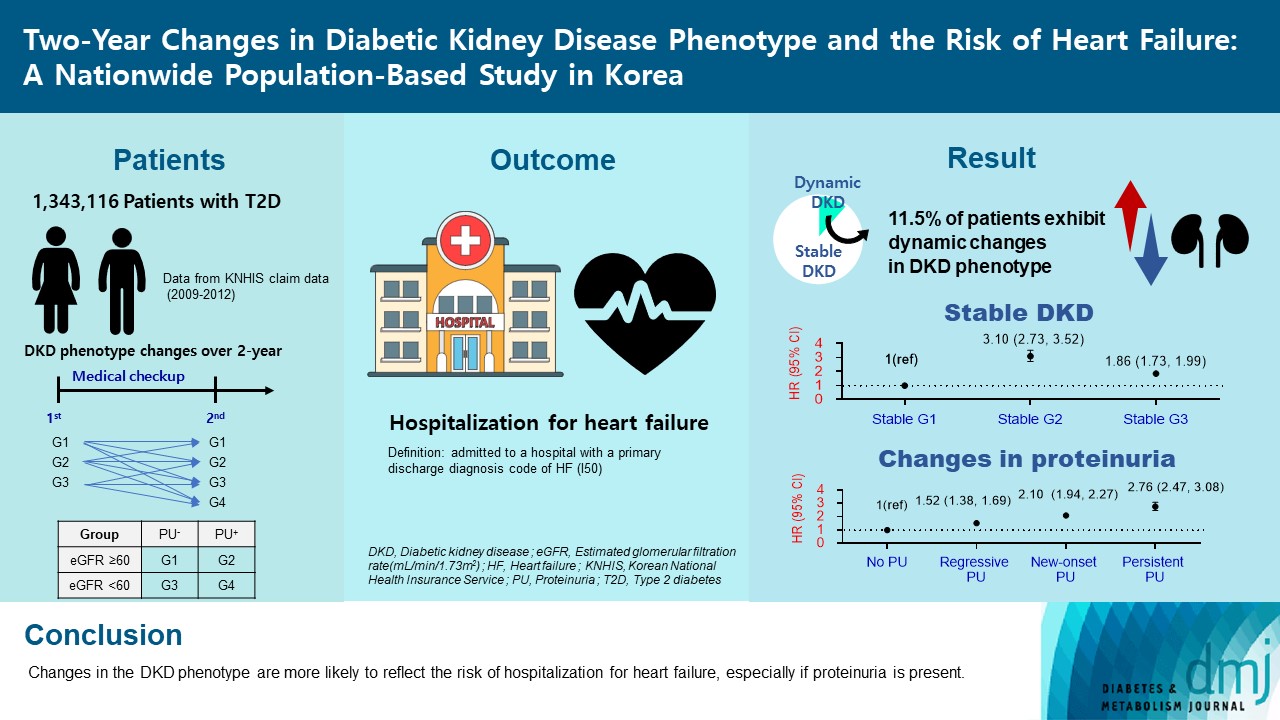
- The study included 1,343,116 patients with type 2 diabetes mellitus (T2DM) from the Korean National Health Insurance Service database after excluding a very high-risk phenotype (eGFR <30 mL/min/1.73 m2) at baseline, who underwent two cycles of medical checkups between 2009 and 2014. From the baseline and 2-year eGFR and PU results, participants were divided into 10 DKD phenotypic change categories.
-
Results
- During an average of 6.5 years of follow-up, 7,874 subjects developed HHF. The cumulative incidence of HHF from index date was highest in the eGFRlowPU– phenotype, followed by eGFRnorPU+ and eGFRnorPU–. Changes in DKD phenotype differently affect HHF risk. When the persistent eGFRnorPU– category was the reference, hazard ratios for HHF were 3.10 (95% confidence interval [CI], 2.73 to 3.52) in persistent eGFRnorPU+ and 1.86 (95% CI, 1.73 to 1.99) in persistent eGFRlowPU–. Among altered phenotypes, the category converted to eGFRlowPU+ showed the highest risk. In the normal eGFR category at the second examination, those who converted from PU– to PU+ showed a higher risk of HHF than those who converted from PU+ to PU–.
-
Conclusion
- Changes in DKD phenotype, particularly with the presence of PU, are more likely to reflect the risk of HHF, compared with DKD phenotype based on a single time point in patients with T2DM.
- Patients with type 2 diabetes mellitus (T2DM) are at high-risk for both chronic kidney disease (CKD) [1] and heart failure (HF) [2]. The prevalence of CKD and HF is increasing [3] because of the aging population and improved treatment for acute cardiovascular events [4]. Hence, CKD and HF are emerging as major complications in T2DM [2].
- Diabetic kidney disease (DKD) is CKD attributed to diabetes and characterized by sustained reduction in estimated glomerular filtration rate (eGFR) less than 60 mL/min/1.73 m2 and persistently high urinary albumin-to-creatinine ratio (UACR, ≥30 mg/g creatinine) [5]. DKD has been traditionally characterized by albuminuria, followed by reduced glomerular filtration rate (GFR) [6]. However, recent epidemiological studies highlight the heterogeneity of DKD. Approximately 40% of patients with T2DM and eGFR lower than 60 mL/min/1.73 m2 manifest loss of renal function without proteinuria, known as nonproteinuric DKD [7]. The absence of albuminuria phenotypes is attributed to the use of renoprotective drugs and an increase in the size of elderly population [6].
- Based on reduced eGFR (<60 mL/min/1.73 m2) and elevated levels of UACR (≥30 mg/g) or proteinuria, DKD is arbitrarily classified into four distinct phenotypes: (1) no-DKD; (2) proteinuric DKD without reduced eGFR; (3) non-proteinuric DKD with reduced eGFR; and (4) proteinuric DKD with reduced eGFR [7-9]. This classification is pragmatic because risks of kidney and cardiovascular outcomes, comorbidities, and mortality might also differ among phenotypes of DKD.
- However, DKD phenotype often changes dynamically, showing either progression or regression. The impact of DKD phenotype changes on the risk of future HF risk remains largely unknown. Previous studies typically measured eGFR or proteinuria only once and focused on the long‐term effect of such eGFR or proteinuria on long‐term cardiovascular events. Understanding the trajectories of GFR and albuminuria is therefore important for risk stratification and early intervention.
- The present study was designed to evaluate the association between changes in DKD phenotype across 2-year assessments and the risk of hospitalization for heart failure (HHF) in a patient cohort with T2DM.
INTRODUCTION
- Data source and study population
- This study used data from Korean National Health Insurance Service (NHIS). The Korean NHIS is a sole insurance provider for all Korean residents. The NHIS established databases (DBs) including qualification DB, treatment DB, and medical checkup DB [10].
- In this study, patients were categorized according to the DKD phenotype change across 2-year assessments. DKD phenotype was classified into four distinct groups based on eGFR levels (normal vs. low) and proteinuria (PU, negative vs. positive): group 1 (GFRnorPU−), normal eGFR and negative PU; group 2 (GFRnorPU+), normal eGFR and positive PU; group 3 (GFRlow PU−), low eGFR and negative PU; group 4 (GFRlowPU+), low eGFR and positive proteinuria (Supplementary Fig. 1A). Patients were followed until the date of HHF or December 31, 2018.
- A total of 1,779,819 subjects with T2DM underwent at least two general medical checkups between 2009 and 2012 (Supplementary Fig. 1B). The exclusion criteria were: (1) individuals diagnosed with cancer (n=68,282); (2) individuals diagnosed with thyrotoxicosis (n=78,467); (3) individuals with renal diseases other than DKD (n=135,698); (4) individuals with rheumatic mitral valve disease (n=4,695); (5) individuals with missing values (n=48,959); and (6) those who had eGFR less than 30 mL/min/1.73 m2 (n=14,889) at the second examination, since very high-risk KDIGO categories are well known for poor cardiovascular outcomes [11]. In addition, those with proteinuric DKD with reduced eGFR at the first examination were excluded because these patients were less likely to move to another group in real clinical practice. Likewise, those transitioning from reduced eGFR to normal eGFR were also excluded (n=85,713). Finally, 1,343,116 patients with 10 categories of changes in DKD phenotype were identified: group 1 → group 1–4; group 2 → group 1–4; and group 3 → group 3–4 (Supplementary Fig. 1B).
- Because previously collected and de-identified data were used, this study was exempted from ethical review by the Institutional Review Board (IRB no.: SSU-202003-HR-201-01).
- Definition of T2DM and DKD phenotype
- T2DM was defined by the diagnostic code (International Classification of Diseases 10th Revision [ICD-10] code: E11–E14) in addition to prescription with relevant glucose-lowering drugs. Although participants did not meet aforementioned criteria, they were defined as having T2DM if their fasting plasma glucose levels ≥126 mg/dL during medical checkup.
- The eGFR was calculated using the equation from the Modification of Diet in Renal Disease study [12] and low eGFR was defined by values less than 60 mL/min/1.73 m2. The degree of proteinuria is measured as negative, trace, 1+, 2+, 3+, or 4+ using the urine dipstick test. Proteinuria ≥1+ was defined as positive proteinuria; negative or +/– were classified into negative proteinuria.
- Laboratory and clinical examination
- In this study, the laboratory results and clinical characteristics were based on the second examination. Body mass index (BMI) was calculated as the weight divided by height squared (kg/m2). Venous sample after an overnight fasting was used to evaluate fasting plasma glucose, total cholesterol, triglyceride, high-density lipoprotein cholesterol, low-density lipoprotein cholesterol, creatinine, aspartate aminotransferase, alanine aminotransferase, gamma-glutamyltransferase, and hemoglobin levels.
- Health-related lifestyles were evaluated using self-administered questionnaires and categorized as current smokers or non-smokers, heavy drinkers (≥5 days/week) or non-drinkers, and subjects with or without regular exercise.
- Operational definitions for comorbidities
- HF was diagnosed based on the ICD-10 codes for HF (I50). Hypertension was defined by an ICD-10 code for hypertension (I10–I15) with antihypertensive medications. Participants were also considered hypertensive if their systolic blood pressure ≥140 mm Hg and/or diastolic blood pressure ≥90 mm Hg during general medical checkup. Dyslipidemia was defined by ICD-10 code for dyslipidemia (E78) with ongoing treatment using lipid-lowering agents or a total cholesterol level ≥240 mg/dL during medical checkup. Proliferative diabetic retinopathy (PDR) was established if participants had two or more diagnoses for diabetic retinopathy (H360) and procedure code for pan-retinal photocoagulation (S5160).
- Outcome
- The primary outcome of this study was HHF. Cases were defined as patients who were admitted to a hospital with a primary discharge diagnosis code of HF (I50).
- Statistical analysis
- We used descriptive statistics to summarize baseline characteristics. Baseline characteristics according to changes in DKD phenotype are presented as numbers (percentages) for categorical variables and mean±standard deviation for continuous variables. If the distribution of continuous variables was heavily skewed, a geometric mean was used. To analyze the differences in baseline characteristics between groups, one-way analysis of variance was used for continuous variables and chi-squared test was used for categorical variables.
- Cumulative incidence of HHF was calculated using Kaplan-Meier estimates. We performed a log-rank test to analyze the differences in HHF risk across the phenotypes. The incidence rate (IR) of HHF was expressed as the number of events per 1,000 person-years (PYs). Cox proportional-hazards regression analysis was performed to evaluate the hazard ratio (HR) for HHF across the categories of changes in DKD phenotype. Model 1 was unadjusted. Model 2 was adjusted for age, sex, BMI, smoking, alcohol, and physical activity. Model 3 was additionally adjusted for comorbidities including hypertension, dyslipidemia, atrial fibrillation, and ischemic heart disease. Finally, model 4 was additionally adjusted for fasting glucose, diabetes duration, hemoglobin levels, and insulin usage. Subgroup analyses with tests for interaction were performed according to age group (<65 years vs. ≥65 years), BMI (<25 kg/m2 vs. ≥25 kg/m2), and the presence or absence of prevalent HF. In addition to the primary analysis, we performed sensitivity analyses using proteinuria cut-off values ≥2+ for dipstick-positive proteinuria.
- Statistical analyses were conducted using SAS version 9.4 software (SAS Institute, Cary, NC, USA). P<0.05 was considered statistically significant.
METHODS
- Baseline characteristics of study subjects
- Characteristics of study population according to changes in DKD phenotype are presented in Table 1. Based on the results of the first examination, the rates of prevalence of group 1 (GFRnorPU–), group 2 (GFRnorPU+), and group 3 (GFRlowPU–) were 91.9%, 4.8%, and 3.3%, respectively. At the second examination, the prevalence rates of GFRnorPU–, GFRnorPU+, and GFRlowPU–were 87.4%, 4.1%, and 7.7%, respectively; 0.8% of study population was newly classified as group 4 (GFRlowPU+).
- Based on the second examination, the GFRlowPU– showed a higher proportion of female subjects than the other groups. The mean age was higher in the GFRlowPU– than in other groups. Comorbidities including prevalent HF were frequently observed in the groups with low eGFR (both GFRlowPU– and GFRlowPU+). Indicators for severe diabetes including insulin usage, longer duration of diabetes, polypharmacy, and PDR were most frequently observed in the GFRlowPU+ group. Interestingly, the mean level of BMI was the highest in the GFRnor PU+ with the poorest glycemic control.
- Risk of HHF according to changes in DKD phenotype
- During a mean follow-up of 6.5 years, 7,874 patients were hospitalized for HF among a total of 1,343,116 patients. Based on the results of the first examination, the cumulative incidence of HHF was significantly higher in GFRlowPU–, followed by GFRnorPU+ (log-rank test, P<0.001) (Fig. 1A). Further analysis of the results according to changes in DKD phenotype revealed that the cumulative incidence of HHF was the highest in the category converted to GFRlowPU+, followed by GFRlowPU–, GFRnorPU+, and GFRnorPU–, respectively (Fig. 1B-D). The cumulative incidence of 10 categories of changes in DKD phenotype is presented together in Supplementary Fig. 2.
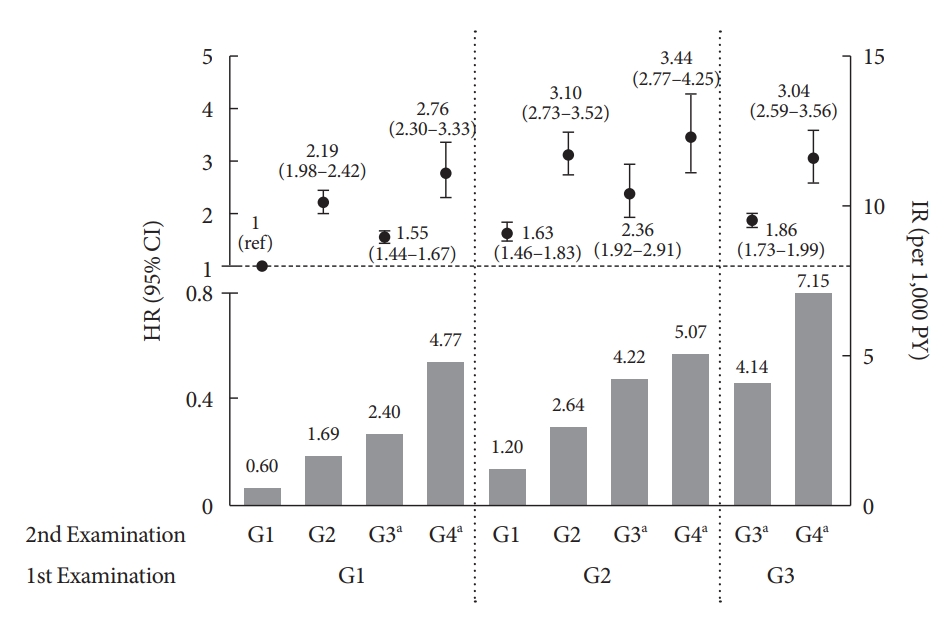
- IRs of HHF in patients according to changes in DKD phenotype are presented in Fig. 2, Supplementary Table 1. Among patients in group 1 (GFRnorPU–) at the first examination, IR of HHF was the highest in category 1 → 4 conversion (IR, category 1 → 1=0.60; 1 → 2=1.69; 1 → 3=2.40; 1 → 4=4.77 per 1,000 PYs). Similarly, among patients in group 2 (GFRnorPU+) at the first examination, the IR of HHF was the highest in category 2 → 4 conversion (IR, category 2 → 1=1.20; 2 → 2=2.64; 2 → 3=4.22; 2 → 4=5.07 per 1,000 PYs). Among patients in group 3(GFRlowPU+) at the first examination, the incidence of HHF was higher in those who progressed to group 4 than in those who remained in group 3 (IR, category 3 → 3=4.14; 3 → 4=7.15 per 1,000 PYs).
- Among stable phenotypes, when the persistent eGFRnorPU– was the reference, the adjusted HR (aHR) for HHF were 3.10 (95% confidence interval [CI], 2.73 to 3.52) in persistent eGFRnorPU+ and 1.86 (95% CI, 1.73 to 1.99) in persistent eGFRlow PU– (Fig. 2). Among altered phenotypes, the categories converted to eGFRlowPU+ showed higher risk regardless of the first phenotypes. In the normal eGFR group at the second examination, those who converted from eGFRnorPU– to eGFRnorPU+ (new-onset proteinuria) showed a higher risk of HHF (aHR, 2.19; 95% CI, 1.98 to 2.42) than those who converted from eGFRnorPU+ to eGFRnorPU– (regressive proteinuria: aHR, 1.63; 95% CI, 1.46 to 1.83). Similarly, in the low eGFR group at the second examination, those who converted from eGFRnorPU+ to eGFRlowPU– (regressive proteinuria) had a higher risk of HHF (aHR, 2.36; 95% CI, 1.92 to 2.91) than eGFRnorPU– to eGFRlowPU– (no proteinuria: aHR, 1.55; 95% CI, 1.44 to 1.67).
- The aHR of HHF based on changes in proteinuria phenotype (no, regressive, new-onset, persistent proteinuria) accompanied by eGFR changes are shown in Supplementary Fig. 3. Overall, the risk of HHF was determined according to changes in proteinuria phenotype between the first and second examinations.
- Risk of HHF based on changes in proteinuria phenotype
- We further analyzed the risk of HHF according to changes in proteinuria phenotype between first and subsequent examinations, regardless of eGFR levels (Supplementary Table 2). Approximately 92% of total population had no proteinuria (PU– → PU–). The proportion of patients manifesting regressive proteinuria (PU+ → PU–), new-onset proteinuria (PU– → PU+), and persistent proteinuria (PU+ → PU+) was 3.4%, 3.5%, and 1.4%, respectively. The aHR values for regressive, new-onset, and persistent proteinuria were 1.52 (95% CI, 1.38 to 1.69), 2.10 (95% CI, 1.94 to 2.27), and 2.76 (95% CI, 2.47 to 3.08), respectively, compared with no proteinuria.
- Sensitivity analyses
- We performed sensitivity analyses using positive proteinuria ≥2+ based on urinary dipstick test. Baseline characteristics according to changes in DKD phenotype are presented in Supplementary Table 3. Similar to primary analyses, the IR of HHF was the highest in group 4, followed by groups 3, 2, and 1 based on the result of the second examination. Taking category 1 → 1 as the reference, the aHR for HHF in each phenotype change from baseline group 1 were 2.85 (95% CI, 2.51 to 3.24), 1.53 (95% CI, 1.42 to 1.64), and 3.61 (95% CI, 2.89 to 4.51) in categories 1 → 2, 1 → 3, and 1 → 4, respectively. Similarly, the aHR of HHF from baseline group 2 were 2.05 (95% CI, 1.76 to 2.40), 3.37 (95% CI, 2.73 to 4.15), 2.84 (95% CI, 2.18 to 3.71), and 4.25 (95% CI, 3.19 to 5.66) in categories 2 → 1, 2 → 2, 2 → 3, and 2 → 4, respectively. From baseline group 3, the aHR values were 1.88 (95% CI, 1.76 to 2.01) and 3.10 (95% CI, 2.53 to 3.79) in categories 3 → 3 and 3 → 4, respectively (Supplementary Table 4).
- Subgroup analysis
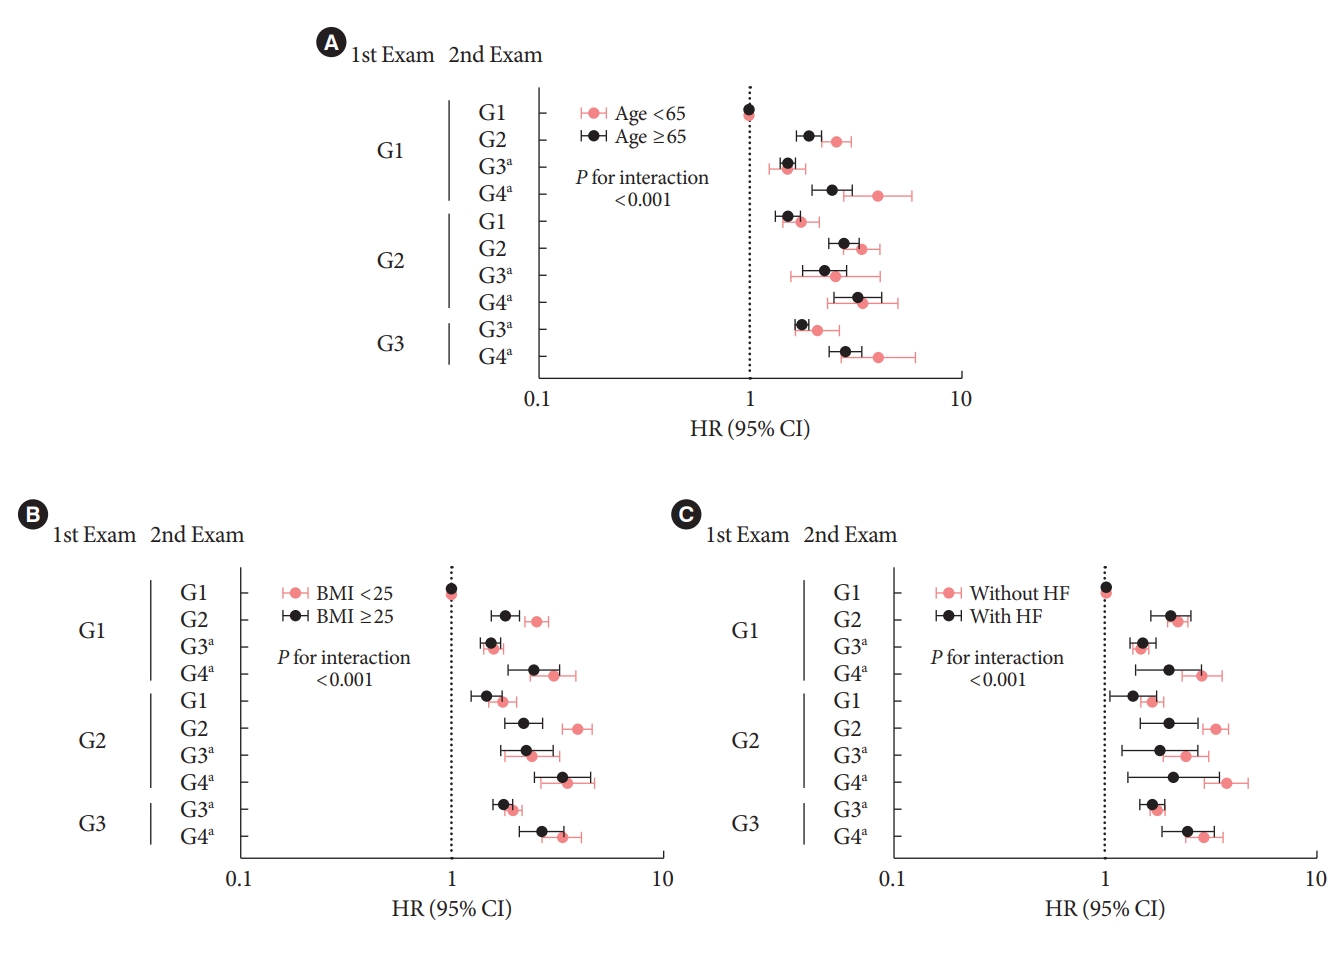
- Subgroup analyses were performed to identify the subgroups that were more strongly affected by changes in DKD phenotype (Fig. 3). Compared with persistent eGFRnorPU–, those in the other categories showed a significantly higher risk of HHF regardless of age, BMI level, and presence or absence of previous HF. The increased risk of HHF associated with changes in DKD phenotype was more prominent in patients aged <65 years than in those 65 years or older (P for interaction <0.001). Compared with patients having a BMI ≥25 kg/m2 or those with HF at baseline, subjects with BMI less than 25 kg/m2 or those without HF were strongly affected by changes in DKD phenotype (P for interaction <0.001).
RESULTS
- Using a nationwide population DB, the current study demonstrated that 2-year trajectories of eGFR or proteinuria provide valuable insight into HHF risk stratification of patients with T2DM with an initial eGFR >30 mL/min/1.73 m2. Especially, patients with proteinuria carried a higher risk of HHF.
- T2DM is the most powerful risk factor for incident HHF [13]. Regarding the prognostic implications of concurrent T2DM and HF, it is important to develop a screening strategy for unrecognized HF among patients with T2DM. Nevertheless, the current screening strategies for HF in patients with T2DM are scarce and primarily based on the clinical characteristics of elderly subjects [14,15] or HF with reduced ejection fraction [16]. Since T2DM has been considered as a broadspectrum disease with many associated complications, HHF risk stratification remains an important issue. Our findings point to the significance of evaluating changes in DKD phenotype in assessing the risk of diabetes-related HHF.
- The DKD phenotype in our study was based on previous studies [7-9]. The distribution of each phenotype at the second examination was 87.4%, 4.1%, 7.7%, and 0.8% for group 1 (GFRnorPU–), group 2 (GFRnorPU+), group 3 (GFRlowPU–), and group 4 (GFRlowPU+), respectively. It is similar to the distribution of phenotypes of 87.6%, 2.8%, 8.4%, and 1.2%, respectively in the Korea National Health and Nutrition Examination Survey 2011 to 2013 survey using UACR >300 mg/g as proteinuria among adults with diabetes aged ≥20 years [17]. Although this study had the inherent weakness using dipstick proteinuria, it showed a distribution similar to the national survey, indicating the reliability of our study design.
- Notably, the risk of HHF has been shown to increase in the presence of transient or persistent proteinuria. Our finding is similar to a previous study showing higher risk of CVD events in GFRnorPU+ than in GFRlowPU– [7,8]. A recent meta-analysis showed that albuminuria contributes to better HF risk prediction than eGFR and most modifiable traditional risk factors [18,19]. HHF risk stratification using a novel clinical risk score in patients with T2DM based on the Does Saxagliptin Reduce the Risk of Cardiovascular Events When Used Alone or Added to Other Diabetes Medications (SAVOR-TIMI 53) trial also showed a strong association of UACR >300 mg/g than eGFR <60 mL/min/1.73 m2 [20]. However, most of the aforementioned studies have been based on high-risk T2DM and a single time point DKD phenotype. We analyzed the changes in DKD phenotype over a 2-year assessment, which could further stratify the HHF risk than those studies focused on a single time point DKD phenotype. Interestingly, the transient proteinuria whether regressive or new-onset, revealed an increased hazard of HHF. Even in normal eGFR phenotype at the second examination, the regression of proteinuria showed a higher hazard for HHF than no proteinuria, but a lower hazard for new-onset proteinuria. This is in line with the latest DKD guidelines recommending reducing proteinuria as a top priority [21]. Surprisingly, the persistent GFRlowPU– showed lower hazard of HHF than persistent GFRnorPU+ or the altered phenotype from GFRnorPU– to GFRnorPU+. As such, the dedicated renal trial, The Study of Heart and Kidney Protection With Empagliflozin (EMPA-KIDNEY), should answer important questions regarding the CVD outcomes of this category [22].
- Further analysis of changes in proteinuria phenotype regardless of eGFR status revealed that persistent proteinuria was associated with the highest HR for HHF. Notably, the HR for HHF increased in the transient proteinuria compared with absence of proteinuria. This trend is similar to the study of myocardial infarction in diabetes, which showed that the HR of remittent, incident, and persistent proteinuria was 0.85 (95% CI, 0.35 to 0.85), 1.29 (95% CI, 0.85 to 1.97), and 2.50 (95% CI, 1.48 to 4.22), respectively, compared with absence of proteinuria [23]. In our study, combined changes of proteinuria and eGFR showed additive predictive value on HHF risk.
- Because the urine dipstick test had poor sensitivity and high false-positive rates for UACR ≥30 mg/g detection [24], we performed a sensitivity analysis using proteinuria ≥2+ based on dipstick test, which revealed robust HHF risk. Although we did not analyze the medications that affect proteinuria or prevent CKD progression such as sodium-glucose cotransporter 2 inhibitors (SGLT2i), we analyzed the use of renin-angiotensin-aldosterone system inhibitors (RAASi). In each group, the use of RAASi increased with advancing CKD.
- Advanced age, obesity, and previous HF per se are well known traditional risk factors for HF [25]. Therefore, in patients with these risk factors, the relative risk of HF attributable to DKD may be attenuated by the presence of comorbidities. Interestingly, our subgroup analyses showed that the increased risk of HHF in DKD phenotype changes was more prominent in subjects aged <65 years after adjusting for confounders, although the incidence of HHF was higher in those aged 65 and older than in those below 65 years. Furthermore, patients with BMI less than 25 kg/m2 or those without HF were more strongly affected by DKD phenotype changes compared with patients with BMI ≥25 kg/m2, or those having HF at baseline. Thus, DKD may exert a relatively stronger effect on the development of HHF in patients without traditional risk factors than in those with comorbid conditions, suggesting the need for screening of HHF in patients with DKD, even in the lower-risk population.
- Our study results support the American Diabetes Association recommendations for the annual screening of asymptomatic adults for eGFR and UACR [5], especially for risk stratification of HHF. However, the adherence to CKD guidelines in T2DM is low, with the rate of annual UACR assessment at 43%, while the rate of annual eGFR assessments was 85% in patients with T2DM [26]. As a result of this study, clinicians should be aware that changes in DKD phenotype based on eGFR or proteinuria help predict HF.
- To the best of our knowledge, this was the first population-based longitudinal study that explored the association between changes in DKD phenotype and the risk of HHF in patients with T2DM. However, the present study had some limitations that should be considered when interpreting the results. First, in this nationwide study, we defined eGFR or proteinuria using only one-time values although the guideline suggests repeated measurements. Second, the use of spot dipstick urinalysis alone to detect proteinuria is another limitation, since the test is not sensitive enough to detect microalbuminuria [27]. Third, the prevalence of HF in Korea was 1.53% according to the National Health Insurance Service-National Sample Cohort in 2013, which is relatively low compared with the prevalence in South Asian countries (4.5% to 6.7%) [28]. Also, Asians carry the heaviest burden of DKD [29]. Thus, the results of this analysis based on the Korean setting may not be directly applicable to other countries. Fourth, no adjustments were made for drugs affecting CKD or HF in this study such as SGLT2i and angiotensin receptor neprilysin inhibitor. Fifth, we did not investigate the mortality, which might affect the final HHF occurrence. It might inadvertently affect baseline GFRlowPU-phenotype which is expected to carry a high burden of all-cause death. Lastly, having only two observation points or excluding those who had eGFR less than 30 mL/min/1.73 m2 at baseline may also be considered as a weakness.
- Current recommendations for HF screening are limited to symptomatic patients [30]. Neither European Society of Cardiology nor American Heart Association guidelines recommend biomarker use for stratifying patients at risk for HF. The results of our study suggest that eGFR and proteinuria trajectories in T2DM facilitate HHF risk stratification, especially in patients manifesting proteinuria.
DISCUSSION
SUPPLEMENTARY MATERIALS
Supplementary Table 1.
Supplementary Table 2.
Supplementary Table 3.
Supplementary Table 4.
Supplementary Fig. 1.
Supplementary Fig. 2.
Supplementary Fig. 3.
-
CONFLICTS OF INTEREST
No potential conflict of interest relevant to this article was reported.
-
AUTHOR CONTRIBUTIONS
Conception or design: S.E.L., H.S.C., K.H., K.A.K.
Acquisition, analysis, or interpretation of data: S.E.L., J.Y., H. S.C., K.H., K.A.K.
Drafting the work or revising: S.E.L., H.S.C.
Final approval of the manuscript: S.E.L., J.Y., H.S.C., K.H., K.A.K.
-
FUNDING
None
NOTES
-
Acknowledgements
- Data used in this study was provided by the Korea National Health Insurance Service (NHIS). We are grateful to Korea NHIS for cooperation and participation in health checkup provided by Korean NHIS.

|
First examination (2009–2012) |
Group 1a (GFRnorPU−), 91.9% |
Group 2a (GFRnorPU+), 4.8% |
Group 3a (GFRlowPU−), 3.3% |
P value | ||||||||
|---|---|---|---|---|---|---|---|---|---|---|---|---|
|
Second examination (2011–2014) |
Group 1a (GFRnorPU−) |
Group 2a (GFRnorPU−) |
Group 3b (GFRlowPU−) |
Group 4b (GFRlowPU+) |
Group 1a (GFRnorPU−) |
Group 2a (GFRnorPU−) |
Group 3b (GFRlowPU−) |
Group 4b (GFRlowPU+) |
Group 3b (GFRlowPU−) |
Group 4b (GFRlowPU+) |
||
| Category of changes in DKD phenotype | 1→1 | 1→2 | 1→3 | 1→4 | 2→1 | 2→2 | 2→3 | 2→4 | 3→3 | 3→4 | ||
| Number | 1,132,531 (84.3) | 39,584 (2.9) | 58,347 (4.3) | 3,990 (0.3) | 41,799 (3.1) | 15,619 (1.2) | 3,523 (0.3) | 2,908 (0.2) | 40,963 (3.0) | 3,852 (0.3) | ||
| Male sex | 738,987 (65.3) | 27,970 (70.7) | 26,926 (46.2) | 2,355 (59.0) | 28,655 (68.6) | 12,060 (77.2) | 1,967 (55.8) | 2,099 (72.2) | 17,102 (41.8) | 2,071 (53.86) | <0.001 | |
| Age, yr | 56.3±11.9 | 57.3±11.7 | 66.4±9.7 | 65.2±10.1 | 57.2±11.3 | 57.5±11.0 | 66.0±9.7 | 62.8±10.0 | 70.1±8.3 | 68.7±9.1 | <0.001 | |
| BMI, kg/m2 | 24.9±3.3 | 25.5±3.6 | 25.1±3.2 | 25.2±3.4 | 25.4±3.5 | 25.8±3.7 | 25.4±3.4 | 25.2±3.4 | 25.1±3.3 | 25.1±3.4 | <0.001 | |
| WC, cm | 84.9±8.5 | 86.9±8.9 | 85.6±8.5 | 86.8±8.6 | 86.5±8.8 | 88.1±9.0 | 87.1±8.8 | 87.4±8.5 | 86.3±8.6 | 87.0±9.0 | <0.001 | |
| Current smoker | 308,378 (27.2) | 12,269 (31.0) | 8,124 (13.9) | 752 (18.9) | 12,185 (29.2) | 5,171 (33.1) | 587 (16.7) | 686 (23.6) | 4,020 (9.8) | 534 (13.9) | <0.001 | |
| Heavy drinker | 113,621 (10.0) | 5,449 (13.8) | 2,787 (4.8) | 270 (6.8) | 5,038 (12.1) | 2,185 (14.0) | 209 (5.9) | 192 (6.6) | 1,116 (2.7) | 147 (3.8) | <0.001 | |
| Regular exercise | 256,468 (22.7) | 8,247 (20.8) | 12,345 (21.2) | 813 (20.4) | 9,258 (22.2) | 3,397 (21.8) | 728 (20.7) | 643 (22.1) | 8,156 (19.9) | 737 (19.1) | <0.001 | |
| Comorbidities | ||||||||||||
| Hypertension | 578,956 (51.1) | 26,284 (66.4) | 43,331 (74.3) | 3,270 (82.0) | 27,214 (65.1) | 11,936 (76.4) | 3,027 (85.9) | 2,623 (90.2) | 34,197 (83.5) | 3,405 (88.4) | <0.001 | |
| Dyslipidemia | 453,034 (40.0) | 19,056 (48.1) | 30,844 (52.9) | 2,266 (56.8) | 19,776 (47.3) | 8,710 (55.8) | 2,028 (57.6) | 1,870 (64.3) | 23,289 (56.9) | 2,329 (60.5) | <0.001 | |
| IHD | 163,411 (14.4) | 6,777 (17.1) | 14,748 (25.3) | 1,101 (27.6) | 7,156 (17.1) | 3,055 (19.6) | 1,005 (28.5) | 800 (27.5) | 13,397 (32.7) | 1,357 (35.2) | <0.001 | |
| AF | 9,689 (0.9) | 620 (1.2) | 1,213 (2.1) | 117 (2.9) | 598 (1.4) | 277 (1.8) | 94 (2.7) | 61 (2.1) | 1,209 (3.0) | 154 (4.0) | <0.001 | |
| Stroke | 60,159 (5.3) | 2,782 (7.0) | 7,054 (12.1) | 577 (14.5) | 2,800 (6.7) | 1,317 (8.4) | 569 (16.2) | 424 (14.6) | 6,665 (16.3) | 773 (20.1) | <0.001 | |
| PAD | 186,665 (16.5) | 7,538 (19.0) | 16,289 (27.9) | 1,116 (28.0) | 8,008 (19.2) | 3,262 (20.9) | 1,031 (29.3) | 809 (27.8) | 12,620 (30.8) | 1,225 (31.8) | <0.001 | |
| CVD | 328,687 (29.0) | 13,425 (33.9) | 28,462 (48.8) | 2,082 (52.2) | 14,200 (34.0) | 5,926 (37.9) | 1,882 (53.4) | 1,477 (50.8) | 23,499 (57.4) | 2,338 (60.7) | <0.001 | |
| Heart failure | 24,818 (2.2) | 1,136 (2.9) | 3,435 (5.9) | 289 (7.2) | 1,227 (2.9) | 558 (3.6) | 260 (7.4) | 184 (6.3) | 3,689 (9.0) | 400 (10.4) | <0.001 | |
| Severity of diabetes | ||||||||||||
| FPG ≥150 mg/dL | 259,945 (23.0) | 16,894 (42.7) | 12,881 (22.1) | 1,447 (36.3) | 12,767 (30.5) | 7,127 (45.6) | 1,006 (28.6) | 1,124 (38.7) | 8,062 (19.7) | 1,173 (30.5) | <0.001 | |
| FPG, mg/dL | 133.8±43.0 | 155.2±53.6 | 133.1±45.5 | 149.2±57.7 | 142.1±50.3 | 158.7±56.2 | 139.5±57.2 | 151.0±60.3 | 129.2±43.9 | 140.2±52.1 | <0.001 | |
| DM ≥5 years | 362,229 (32) | 17,260 (43.6) | 28,524 (48.9) | 2,385 (59.8) | 16,834 (40.3) | 8,741 (56.0) | 2,123 (60.3) | 2,180 (75.0) | 24,993 (61.0) | 2,768 (71.9) | <0.001 | |
| Insulin use | 73,554 (6.5) | 4,877 (12.3) | 6,670 (11.4) | 887 (22.2) | 4,506 (10.8) | 2,832 (18.1) | 743 (21.1) | 964 (33.2) | 6,701 (16.4) | 1,109 (28.8) | <0.001 | |
| ≥2 Oral GLD | 449,285 (39.7) | 20,120 (50.8) | 30,970 (53.1) | 2,350 (58.9) | 21,749 (52) | 9,477 (60.7) | 2,237 (63.5) | 1,986 (68.3) | 23,241 (56.7) | 2,328 (60.4) | <0.001 | |
| PDR | 4,188 (0.4) | 542 (1.4) | 506 (0.9) | 107 (2.78) | 406 (1.0) | 445 (2.9) | 89 (2.5) | 212 (7.3) | 409 (1.0) | 105 (2.7) | <0.001 | |
| Medication | ||||||||||||
| RAS inhibitor | 384,398 (33.9) | 17,926 (45.3) | 33,907 (58.1) | 2,637 (66.1) | 19,765 (47.3) | 9,007 (57.7) | 2,564 (72.8) | 2,298 (79.0) | 28,197 (68.8) | 2,843 (73.8) | <0.001 | |
| Sulfonylurea | 392,530 (34.7) | 18,282 (46.2) | 28,902 (49.5) | 2,227 (55.8) | 18,990 (45.4) | 8,647 (55.4) | 2,085 (59.2) | 1,885 (64.8) | 22,219 (54.2) | 2,262 (58.7) | <0.001 | |
| TZD | 49,341 (4.4) | 2,083 (5.3) | 3,489 (6.0) | 250 (6.3) | 2,217 (5.3) | 940 (6.0) | 240 (6.8) | 185 (6.4) | 2,689 (6.6) | 273 (7.1) | <0.001 | |
| SBP, mm Hg | 127.5±14.9 | 132.1±16.8 | 129.2±15.7 | 132.7±18.1 | 129.8±15.6 | 134.3±17 | 131.4±17 | 135.2±17.9 | 130.1± 16.1 | 134.3±17.6 | <0.001 | |
| DBP, mm Hg | 78.5±9.8 | 80.8±11 | 77.6±10.1 | 79.2±11.2 | 79.4±10.3 | 81.4±11 | 78±10.6 | 80±11.4 | 76.9±10.2 | 78.3±10.8 | <0.001 | |
| eGFR, mL/min/1.73 m2 | 91.8±37.7 | 90.8±37.4 | 54.3±5.4 | 52.9±6.4 | 92.1±43.2 | 89.1±40.5 | 52.9±6.3 | 51.1±7.2 | 50.6±7.3 | 47.8±8.1 | <0.001 | |
| eGFR at 1st exam, mL/min/1.73 m2 | 90.5±34.9 | 91.4±39.8 | 78.5±32.1 | 79.4±44.2 | 89.8±32.8 | 89.7±34.1 | 76.9±21.5 | 75.5±24.3 | 50.3±10.0 | 48.6±10.2 | <0.001 | |
| PU | 0 | 39,584 (100) | 0 | 3,990 (100) | 0 | 15,619 (100) | 0 | 2,908 (100) | 0 | 3,852 (100) | <0.001 | |
| PU at 1st exam | 0 | 0 | 0 | 0 | 41,799 (100) | 15,619 (100) | 3,523 (100) | 2,908 (100) | 0 | 0 | <0.001 | |
| Non-HDL-C, mg/dL | 140.9±40.7 | 146.7±51.5 | 139.9±42.1 | 144.6±49 | 140.4 ±44.1 | 148.2±47.9 | 138±43 | 147.2±47.4 | 135.9±44.7 | 138.3±43 | <0.001 | |
| AST, IU/L | 25.72 (25.7–25.74) | 28.55 (28.41–28.7) | 25.07 (24.99–25.15) | 25.81 (25.44–26.2) | 26.81 (26.69–26.92) | 27.27 (27.07–27.48) | 24.84 (24.49–25.18) | 23.71 (23.35–24.08) | 24.15 (24.06–24.23) | 24.13 (23.82–24.45) | <0.001 | |
| ALT, IU/L | 25.72 (25.7–25.75) | 28.87 (28.7–29.05) | 22.47 (22.38–22.57) | 23.39 (22.97–23.82) | 27.04 (26.89–27.19) | 27.65 (27.4–27.91) | 22.29 (21.89–22.7) | 21.67 (21.25–22.09) | 20.5 (20.4–20.61) | 20.81 (20.46–21.16) | <0.001 | |
| γ-GTP, IU/L | 35.57 (35.52–35.62) | 46.15 (45.75–46.55) | 29.54 (29.37–29.71) | 35.37 (34.5–36.27) | 40.97 (40.64–41.3) | 45.99 (45.38–46.6) | 31.47 (30.71–32.25) | 33.03 (32.14–33.94) | 26.57 (26.4–26.75) | 29.53 (28.87–30.19) | <0.001 | |
Values are presented as number (%), mean±standard deviation, or geometric mean (95% confidence interval). Results are based on data from the second examination.
DKD, diabetic kidney disease; GFR, glomerular filtration rate; PU, proteinuria; BMI, body mass index; WC, waist circumference; IHD, ischemic heart disease; AF, atrial fibrillation; PAD, peripheral artery disease; CVD, cardiovascular disease; FPG, fasting plasma glucose; DM, diabetes mellitus; GLD, glucose-lowering drug; PDR, proliferative diabetic retinopathy; RAS, renin-angiotensin system; TZD, thiazolidinedione; SBP, systolic blood pressure; DBP, diastolic blood pressure; eGFR, estimated glomerular filtration rate; HDL-C, high-density lipoprotein cholesterol; AST, aspartate aminotransferase; ALT, alanine aminotransferase; γ-GTP, gamma-glutamyltransferase.
a Group 1, eGFR ≥60 mL/min/1.73 m2, PU-; Group 2, eGFR ≥60 mL/min/1.73 m2, PU+; Group 3, eGFR <60 mL/min/1.73 m2, PU−; Group 4, eGFR <60 mL/min/1.73 m2, PU+,
b In case of group 3 and 4 at second examination, only patients with eGFR 30 to 60 mL/min/1.73 m2 were included according to the study inclusion criteria.
- 1. GBD Chronic Kidney Disease Collaboration. Global, regional, and national burden of chronic kidney disease, 1990-2017: a systematic analysis for the Global Burden of Disease Study 2017. Lancet 2020;395:709-33.PubMedPMC
- 2. Birkeland KI, Bodegard J, Eriksson JW, Norhammar A, Haller H, Linssen GC, et al. Heart failure and chronic kidney disease manifestation and mortality risk associations in type 2 diabetes: a large multinational cohort study. Diabetes Obes Metab 2020;22:1607-18.ArticlePubMedPMCPDF
- 3. Greene SJ, Butler J. Primary prevention of heart failure in patients with type 2 diabetes mellitus. Circulation 2019;139:152-4.ArticlePubMedPMC
- 4. Gregg EW, Li Y, Wang J, Burrows NR, Ali MK, Rolka D, et al. Changes in diabetes-related complications in the United States, 1990-2010. N Engl J Med 2014;370:1514-23.ArticlePubMed
- 5. American Diabetes Association Professional Practice Committee, Draznin B, Aroda VR, Bakris G, Benson G, Brown FM, et al. 11. Chronic kidney disease and risk management: standards of medical care in diabetes-2022. Diabetes Care 2022;45(Suppl 1):S175-84.
- 6. Oshima M, Shimizu M, Yamanouchi M, Toyama T, Hara A, Furuichi K, et al. Trajectories of kidney function in diabetes: a clinicopathological update. Nat Rev Nephrol 2021;17:740-50.ArticlePubMedPDF
- 7. Yokoyama H, Araki SI, Kawai K, Yamazaki K, Shirabe SI, Sugimoto H, et al. The prognosis of patients with type 2 diabetes and nonalbuminuric diabetic kidney disease is not always poor: implication of the effects of coexisting macrovascular complications (JDDM 54). Diabetes Care 2020;43:1102-10.ArticlePubMedPDF
- 8. Buyadaa O, Magliano DJ, Salim A, Koye DN, Shaw JE. Risk of rapid kidney function decline, all-cause mortality, and major cardiovascular events in nonalbuminuric chronic kidney disease in type 2 diabetes. Diabetes Care 2020;43:122-9.ArticlePubMedPDF
- 9. Lee SE, Yoo J, Kim KA, Han K, Choi HS. Hip fracture risk according to diabetic kidney disease phenotype in a Korean population. Endocrinol Metab (Seoul) 2022;37:148-58.ArticlePubMedPMCPDF
- 10. Korean National Health Insurance Service: National Health Insurance Data Sharing Service. Available from: https://nhiss.nhis.or.kr/bd/ab/bdaba000eng.do (cited 2023 Feb 10).
- 11. Kidney Disease: Improving Global Outcomes (KDIGO) Diabetes Work Group. KDIGO 2020 Clinical Practice Guideline for Diabetes Management in Chronic Kidney Disease. Kidney Int 2020;98(4S):S1-115.ArticlePubMed
- 12. Levey AS, Bosch JP, Lewis JB, Greene T, Rogers N, Roth D. A more accurate method to estimate glomerular filtration rate from serum creatinine: a new prediction equation. Modification of Diet in Renal Disease Study Group. Ann Intern Med 1999;130:461-70.ArticlePubMed
- 13. Avery CL, Loehr LR, Baggett C, Chang PP, Kucharska-Newton AM, Matsushita K, et al. The population burden of heart failure attributable to modifiable risk factors: the ARIC (Atherosclerosis Risk in Communities) study. J Am Coll Cardiol 2012;60:1640-6.PubMed
- 14. Seferovic PM, Petrie MC, Filippatos GS, Anker SD, Rosano G, Bauersachs J, et al. Type 2 diabetes mellitus and heart failure: a position statement from the Heart Failure Association of the European Society of Cardiology. Eur J Heart Fail 2018;20:853-72.ArticlePubMedPDF
- 15. Kievit RF, Gohar A, Hoes AW, Bots ML, van Riet EE, van Mourik Y, et al. Efficient selective screening for heart failure in elderly men and women from the community: a diagnostic individual participant data meta-analysis. Eur J Prev Cardiol 2018;25:437-46.ArticlePubMedPMCPDF
- 16. van Giessen A, Boonman-de Winter LJ, Rutten FH, Cramer MJ, Landman MJ, Liem AH, et al. Cost-effectiveness of screening strategies to detect heart failure in patients with type 2 diabetes. Cardiovasc Diabetol 2016;15:48.PubMedPMC
- 17. Park JI, Baek H, Jung HH. Prevalence of chronic kidney disease in Korea: the Korean National Health and Nutritional Examination Survey 2011-2013. J Korean Med Sci 2016;31:915-23.ArticlePubMedPMCPDF
- 18. Matsushita K, Ballew SH, Coresh J. Cardiovascular risk prediction in people with chronic kidney disease. Curr Opin Nephrol Hypertens 2016;25:518-23.ArticlePubMedPMC
- 19. Ballew SH, Matsushita K. Cardiovascular risk prediction in CKD. Semin Nephrol 2018;38:208-16.ArticlePubMed
- 20. Berg DD, Wiviott SD, Scirica BM, Gurmu Y, Mosenzon O, Murphy SA, et al. Heart failure risk stratification and efficacy of sodium-glucose cotransporter-2 inhibitors in patients with type 2 diabetes mellitus. Circulation 2019;140:1569-77.ArticlePubMedPMC
- 21. American Diabetes Association. 11. Microvascular complications and foot care: standards of medical care in diabetes-2021. Diabetes Care 2021;44(Suppl 1):S151-67.ArticlePubMedPDF
- 22. Herrington WG, Preiss D, Haynes R, von Eynatten M, Staplin N, Hauske SJ, et al. The potential for improving cardio-renal outcomes by sodium-glucose co-transporter-2 inhibition in people with chronic kidney disease: a rationale for the EMPAKIDNEY study. Clin Kidney J 2018;11:749-61.ArticlePubMedPMC
- 23. Wang A, Sun Y, Liu X, Su Z, Li J, Luo Y, et al. Changes in proteinuria and the risk of myocardial infarction in people with diabetes or pre-diabetes: a prospective cohort study. Cardiovasc Diabetol 2017;16:104.ArticlePubMedPMCPDF
- 24. Park JI, Baek H, Kim BR, Jung HH. Comparison of urine dipstick and albumin:creatinine ratio for chronic kidney disease screening: a population-based study. PLoS One 2017;12:e0171106.ArticlePubMedPMC
- 25. Dunlay SM, Givertz MM, Aguilar D, Allen LA, Chan M, Desai AS, et al. Type 2 diabetes mellitus and heart failure: a scientific statement from the American Heart Association and the Heart Failure Society of America. This statement does not represent an update of the 2017 ACC/AHA/HFSA heart failure guideline update. Circulation 2019;140:e294-324.ArticlePubMed
- 26. Folkerts K, Petruski-Ivleva N, Comerford E, Blankenburg M, Evers T, Gay A, et al. Adherence to chronic kidney disease screening guidelines among patients with type 2 diabetes in a US Administrative Claims Database. Mayo Clin Proc 2021;96:975-86.ArticlePubMed
- 27. Levey AS, Cattran D, Friedman A, Miller WG, Sedor J, Tuttle K, et al. Proteinuria as a surrogate outcome in CKD: report of a scientific workshop sponsored by the National Kidney Foundation and the US Food and Drug Administration. Am J Kidney Dis 2009;54:205-26.ArticlePubMed
- 28. Choi HM, Park MS, Youn JC. Update on heart failure management and future directions. Korean J Intern Med 2019;34:11-43.ArticlePubMedPDF
- 29. Thomas B. The global burden of diabetic kidney disease: time trends and gender gaps. Curr Diab Rep 2019;19:18.ArticlePubMedPDF
- 30. van der Meer P, Gaggin HK, Dec GW. ACC/AHA versus ESC guidelines on heart failure: JACC guideline comparison. J Am Coll Cardiol 2019;73:2756-68.PubMed
 PubReader
 ePub Link
 Cite
Cite


