The Ratio of Estimated Glomerular Filtration Rate Based on Cystatin C and Creatinine Reflecting Cardiovascular Risk in Diabetic Patients
Article information

Abstract
Background
The ratio of estimated glomerular filtration rate (eGFR) based on cystatin C and creatinine (eGFRcystatin C/eGFRcreatinine ratio) is related to accumulating atherosclerosis-promoting proteins and increased mortality in several cohorts.
Methods
We assessed whether the eGFRcystatin C/eGFRcreatinine ratio is a predictor of arterial stiffness and sub-clinical atherosclerosis in type 2 diabetes mellitus (T2DM) patients, who were followed up during 2008 to 2016. GFR was estimated using an equation based on cystatin C and creatinine.
Results
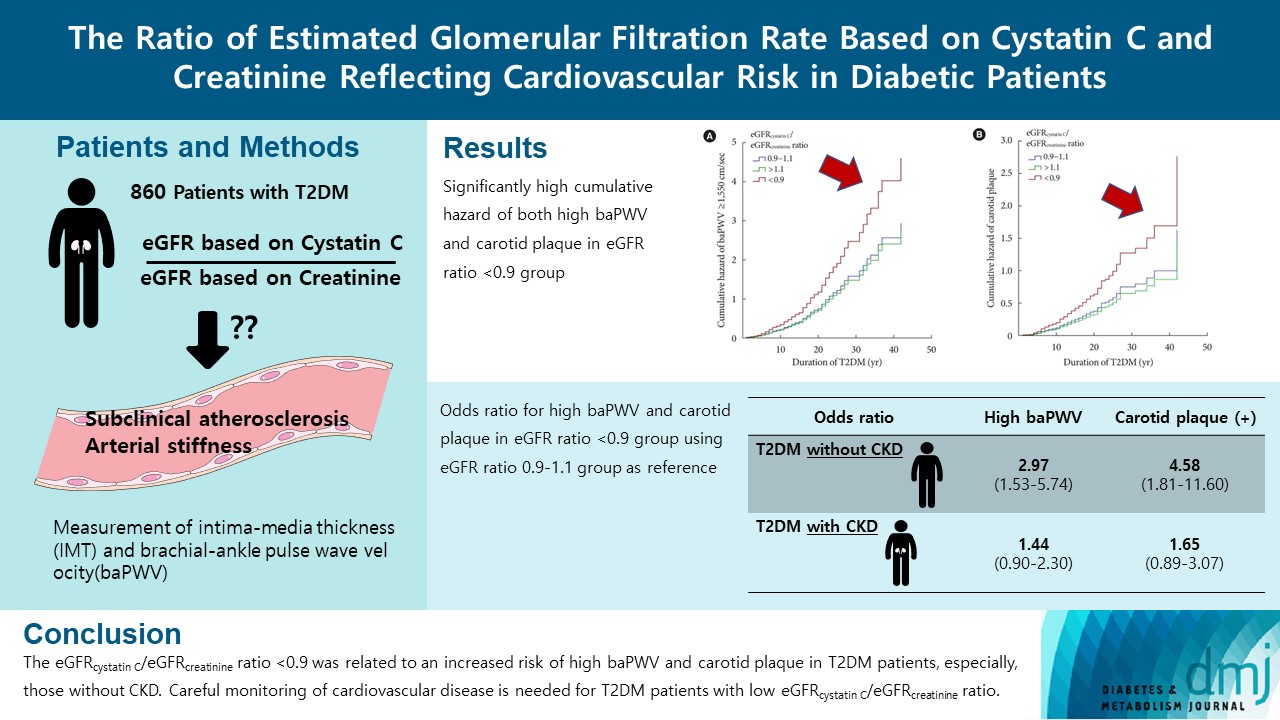
A total of 860 patients were stratified according to their eGFRcystatin C/eGFRcreatinine ratio (i.e., <0.9, 0.9–1.1 [a reference group], and >1.1). Intima-media thickness was comparable among the groups; however, presence of carotid plaque was frequent in the <0.9 group (<0.9 group, 38.3%; 0.9–1.1 group, 21.6% vs. >1.1 group, 17.2%, P<0.001). Brachial-ankle pulse wave velocity (baPWV) was faster in the <0.9 group (<0.9 group, 1,656.3±333.0 cm/sec; 0.9–1.1 group, 1,550.5±294.8 cm/sec vs. >1.1 group, 1,494.0±252.2 cm/sec, P<0.001). On comparing the <0.9 group with the 0.9–1.1 group, the multivariate-adjusted odds ratios of prevalence of high baPWV and carotid plaque were 2.54 (P=0.007) and 1.95 (P=0.042), respectively. Cox regression analysis demonstrated near or over 3-fold higher risks of the prevalence of high baPWV and carotid plaque in the <0.9 group without chronic kidney disease (CKD).
Conclusion
We concluded that eGFRcystatin C/eGFRcreatinine ratio <0.9 was related to an increased risk of high baPWV and carotid plaque in T2DM patients, especially, those without CKD. Careful monitoring of cardiovascular disease is needed for T2DM patients with low eGFRcystatin C/eGFRcreatinine ratio.
INTRODUCTION
Atherosclerotic cardiovascular disease (ASCVD) is the leading cause of morbidity and mortality in patients with type 2 diabetes mellitus (T2DM) and the largest contributor to the direct and indirect healthcare costs associated with the illness. It is important to construct a scientifically validated approach to identify individuals at high risk for ASCVD [1]. Improving ASCVD risk prediction beyond its current state is important, especially in individuals with T2DM, for primary illness prevention. In all patients with T2DM, cardiovascular risk factors should be systematically assessed, at least every 12 months. These risk factors include hypertension, age, obesity, dyslipidemia, and chronic kidney disease (CKD) [1,2]. An estimated glomerular filtration rate (eGFR) <60 mL/min/1.73 m2 is a well-known risk factor for both new and recurrent ASCVD in the general population and in people with existing cardiovascular risk factors [3–6].
The glomerular filtration rate (GFR) is the most preferable indicator of kidney function [7]. The assessment of GFR is fundamental in the diagnosis and monitoring of CKD. The eGFR is usually calculated with equations based on serum creatinine levels. Creatinine is a 0.1 kDa molecule produced in the muscle from the precursor molecule creatine. However, changes in muscle mass may limit the accuracy of serum creatinine as marker of renal function. Cystatin C is a 13.3 kDa molecular weight protein that is independent of muscle mass and less influenced by exogenous factors, e.g., age, sex, and dietary protein intake [8]. Cystatin C provides an alternative measure of eGFR, and is a superior predictor of risk for end-stage renal disease when compared to serum creatinine [9–11]. The National Institute for Health and Care Excellence guidelines for the diagnosis of CKD recommends the cystatin C-based equations for estimation of GFR in patients with CKD stage 3a and no proteinuria.
Several equations have been introduced to conveniently evaluate kidney function in clinical practice, including eGFR. As its predictive power for ASCVD may differ according to the equations used to determine the eGFR, choosing a better eGFR equation for ASCVD risk assessment in patients with T2DM is still debated. Grubb et al. [12] recently proposed a new hypothesis. It is based on differences in the glomerular filtration of small molecules (<0.2 kDa), e.g., water and creatinine, vs. medium-sized molecules (5 to 40 kDa), e.g., cystatin C and beta-2 microglobulin, over the glomerular filtration barrier, introduced as the “shrunken pore syndrome” (SPS) [12,13]. In addition to decreased pore size, thickening of the glomerular basal membrane, which is a major pathological change in early diabetic kidney disease (DKD), also contributes to lowering the eGFRcystatin C/eGFRcreatinine ratio [14]. SPS is characterized by a difference in renal filtration between cystatin C and creatinine, resulting in a low eGFRcystatin C/eGFRcreatinine ratio. Emerging data demonstrates a high risk for morbidity and mortality in ASCVD for patients with SPS [15,16].
This led us to hypothesize that the eGFRcystatin C/eGFRcreatinine ratio can be used to assess the risk for ASCVD in patients with T2DM. Thus, in this retrospective observational study, we assessed whether the eGFRcystatin C/eGFRcreatinine ratio can be used to predict arterial stiffness and sub-clinical atherosclerosis as indicators of pre-clinical ASCVD, namely brachial-ankle pulse wave velocity (baPWV) and carotid plaque, in patients with T2DM.
METHODS
Subjects and design
This was a retrospective observational study conducted in a tertiary hospital. The participants of this study were enrolled from 2008 to 2016 at the Pusan National University Yangsan Hospital Outpatient Clinic of Endocrinology and Metabolism. The inclusion criteria were as follows: (1) individuals aged 20 to 79 years; (2) individuals with T2DM; (3) individuals who underwent measurement of intima-media thickness (IMT) and baPWV with cystatin C. Exclusion criteria were (1) preexisting cardiovascular disease; (2) individual with type 1 or other type of diabetes mellitus; (3) individual with dialysis or abnormal thyroid function. Approval for this study was granted by the Pusan National University Yangsan Hospital Ethics Review Board (No.05-2022-080) prior to data collection. Informed consent was not required for this retrospective study. The included patients were stratified into three subgroups according to the eGFRcystatin C/eGFRcreatinine ratio. Hypertension was defined as systolic blood pressure (SBP) ≥140 mm Hg and/or diastolic blood pressure ≥90 mm Hg or a history of treatment for hypertension. Body mass index (BMI) was calculated as the weight in kilograms divided by the height in meters squared (kg/m2).
Carotid intima-media thickness and brachial-ankle pulse wave velocity
Atherosclerosis is a progressive disease, which has a long subclinical phase reached to emerging cardiovascular events. Carotid IMT is a good surrogate marker of atherosclerotic burden, used to identify a sub-clinical atherosclerosis [17]. It was assessed by a high-resolution B-mode ultrasound (Philips, Bothell, WA, USA) of the left and right common carotid arteries in patients with the supine position. Carotid IMT was measured as the distance between the luminal intimal interface and the medial adventitial interface. The mean IMT was calculated as the average of each 3-point IMT in both common carotid arteries. Carotid plaque was defined as localized IMT ≥1.5 mm at either the left or right common carotid artery. All carotid ultrasounds were performed by physicians trained in ultrasonography at hospitals. PWV is a robust index of arterial stiffness, the rigidity of the arterial walls and an independent predictor of cardiovascular risk [18,19]. A high baPWV was defined as greater than 1,550 cm/sec, being associated with a high cumulative incidence of ASCVD [20]. The baPWV and ankle-brachial index (ABI) were measured on both sides using an automatic waveform analyzer (VP-2000, Colin Co., Komaki, Japan). All individuals were examined after resting in a supine position for at least 5 minutes. We calculated the baPWV as the mean of the right and left baPWV values as markers of arterial stiffness. To obtain ABIs, a pneumatic cuff was placed around the ankle and both arms to measure the arterial pressure. ABI is calculated as the ratio of ankle SBP to the highest right and left brachial SBP, which is an indicator of atherosclerosis [21]. The lowest value obtained was the ABI for the individual. According to the recommendations of the American College of Cardiology/American Heart Association Task Force on Practice Guidelines, an estimated 10-year ASCVD risk score was calculated using the new pooled cohort risk assessment equations [22].
Laboratory assays
Blood pressure and heart rate were measured using an automated technique in a seated position after resting for at least 10 minutes. Blood specimens were obtained from subjects in the morning after an overnight fast and stored at −70°C after collection. We estimated the GFR based on creatinine from the revised Lund-Malmö GFR equation (LM revised) and cystatin C from the Caucasian, Asian, pediatric, and adult cohorts equation (CAPA) [23,24]. Data on the traditional risk factors for ASCVD, including hypertension, smoking, and obesity, were also obtained from the clinical records of each subject. Serum cystatin C levels were measured using the latex agglutination test (Modular P800, Roche Diagnostics, Indianapolis, IN, USA), and serum creatinine levels (modified Jaffe’s kinetic assay) were measured using an auto-analyzer and an enzymatic colorimetric method (Hitachi 7600, Hitachi Ltd., Tokyo, Japan). Toshiba TBA-c16000 (Toshiba, Tokyo, Japan) was used to quantify fasting serum glucose and lipid levels i.e., triglycerides, total cholesterol, high-density lipoprotein (HDL) cholesterol, and low-density lipoprotein cholesterol. All biochemical assays were performed by technicians at the hospital laboratory. GFR was estimated using the CAPA [24] and LM revised [23]:
CAPA=130×cystatin−1.069×age−0.117−7
Revised Lund Malmö creatinine=eX−0158×age+0.438×ln(age)
Female sex with creatinine <150 μmol/L (<1.7 mg/dL): X=2.50+0.0121×(150−creatinine)
Female sex with creatinine ≥150 μmol/L (≥1.7 mg/dL): X=2.50−0.926×ln(creatinine/150)
Male sex with creatinine <180 μmol/L (<2.0 mg/dL): X=2.56−0.00968×(180−creatinine)
Male sex with creatinine ≥180 μmol/L (≥2.0 mg/dL): X=2.56−0.926×ln(creatinine/180)
Statistical analysis
To evaluate the association of each potential risk factor with the outcomes of interest, we initially categorized the eGFRcystatin C/eGFRcreatinine ratios into one of three groups: <0.9, 0.9–1.1, and >1.1. The 0.9–1.1 group of eGFRcystatin C/eGFRcreatinine ratio is a reference group, in which the subject has comparable eGFR between creatinine-based and cystatin C-based equations. Continuous numerical data were expressed as mean±standard deviation, while categorical data were described as percentages. We compared IMT, baPWV, and carotid plaque burden between patient groups stratified according to eGFRcystatin C/eGFRcreatinine ratio using analysis of variance (ANOVA) with post hoc chi-squared testing, as appropriate. Pearson correlation coefficients were calculated to examine the linear relationships between the eGFRcystatin C/eGFRcreatinine ratio and cardiovascular risk factors. Univariate linear regression analysis and stepwise multivariable regression analysis were performed to detect independent relationships between IMT, baPWV, carotid plaque, and the categorized eGFRcystatin C/eGFRcreatinine ratio. Model 1 was adjusted for age, sex, BMI, hypertension, duration of T2DM, and HbA1c; Model 2 was Model 1 with further adjustment for pulse pressure, antiplatelet therapy, IMT, ABI, total cholesterol, HDL-cholesterol, and uric acid. Finally, we used a Cox proportional-hazards regression model to study independent predictors, including the eGFRcystatin C/eGFRcreatinine ratio, carotid plaque, and arterial stiffness. Statistically significance was set at a two-sided P<0.05. Data management was performed using the SPSS statistical software version 18 (SPSS Inc., Chicago, IL, USA).
RESULTS
Baseline characteristics of enrolled subjects according to the eGFRcystatin C/eGFRcreatinine ratio
A total of 860 patients with T2DM (447 men) were included in the current study. Baseline characteristics of the enrolled subjects according to the eGFRcystatin C/eGFRcreatinine ratio are shown in Table 1. The eGFRcystatin C and eGFRcreatinine levels differed by less than±10% (i.e., 0.9 eGFRcreatinine ≤eGFRcystatin C ≤1.1 eGFRcreatinine) for 176 (20.5%) patients, while 81 (9.4%) patients had an eGFRcystatin C <90% of the eGFRcreatinine. The patients with an eGFRcystatin C/eGFRcreatinine ratio <0.9 were significantly older compared to the rest of subjects (59.1±9.5 years, P< 0.001). IMT was similar among the groups. However, the presence of carotid plaque was significantly more frequent in the <0.9 group (<0.9 group, 38.3%, 0.9–1.1 group, 21.6% vs. >1.1 group, 17.2%, P<0.001) and baPWV was significantly faster in the <0.9 group (<0.9 group, 1,656.3±333.0 cm/sec, 0.9–1.1 group, 1,550.5±294.8 cm/sec vs. >1.1 group, 1,494.0± 252.2 cm/sec, P<0.001). The eGFR calculated using the CAPA based on cystatin C was higher with the eGFRcystatin C/eGFRcreatinine ratio, but eGFR using the LM revised based on creatinine showed no difference among the groups. Supplementary Table 1 shows the baseline characteristics of the enrolled subjects according to cystatin C tertiles.
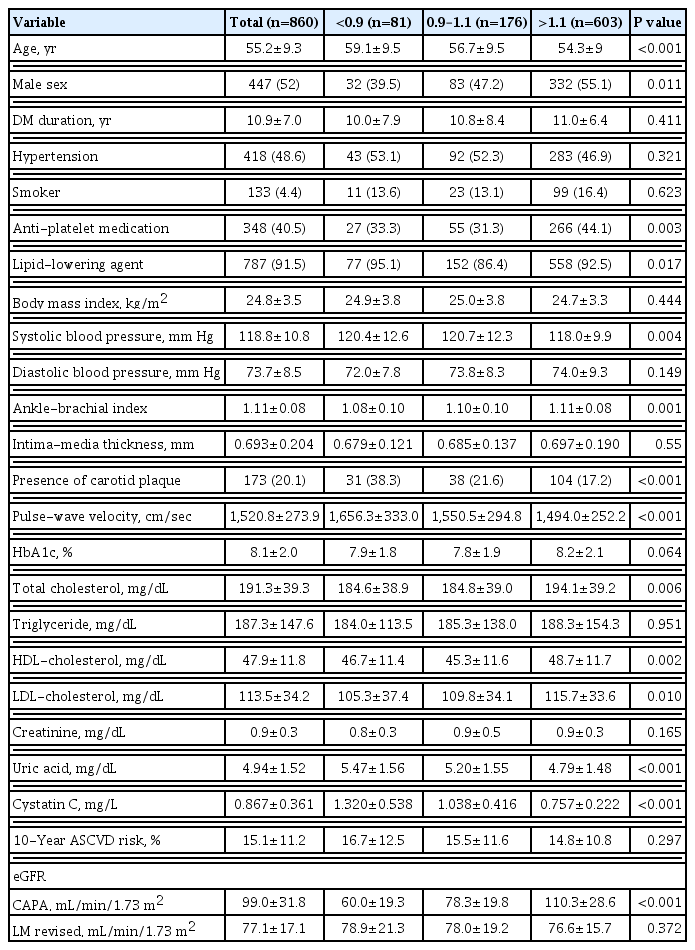
The baseline demographic and clinical characteristics of enrolled subjects according to eGFRcystatin C/eGFRcreatinine ratio
The relationship of the eGFRcystatin C/eGFRcreatinine ratio with cardiovascular risk factors
The prevalence of high baPWV (≥1,550 cm/sec) and carotid plaque decreased in parallel with the eGFRcystatin C/eGFRcreatinine ratio, with the highest prevalence in the eGFRcystatin C/eGFRcreatinine ratio <0.9 group (Fig. 1). This trend did not differ between men and women (data not shown). Subjects in the higher cystatin C tertile had a higher prevalence of high baPWV and carotid plaque (Fig. 2). The correlations of other cardiovascular risk factors with the eGFRcystatin C/eGFRcreatinine ratio or cystatin C are summarized in Table 2. The eGFRcystatin C/eGFRcreatinine ratio was significantly correlated with HbA1c (r=0.145, P<0.001), baPWV (r=−0.155, P<0.001), pulse pressure (r=−0.149, P< 0.001), uric acid (r=−0.175, P<0.001), and the calculated 10-year ASCVD risk (r=−0.081, P<0.001). Cystatin C was significantly correlated with IMT (r=0.114, P=0.001), baPWV (r= 0.355, P<0.001), pulse pressure (r=0.241, P<0.001), uric acid (r=0.414, P<0.001), and the calculated 10-year ASCVD risk (r=0.365, P<0.001). ABI showed no correlation with either cystatin C or the eGFRcystatin C/eGFRcreatinine ratio.

The prevalence of (A) brachial-ankle pulse wave velocity ≥1,550 cm/sec and (B) carotid plaque according to estimated glomerular filtration rate (eGFR)cystatin C/eGFRcreatinine ratio. aP<0.001, bP<0.01.
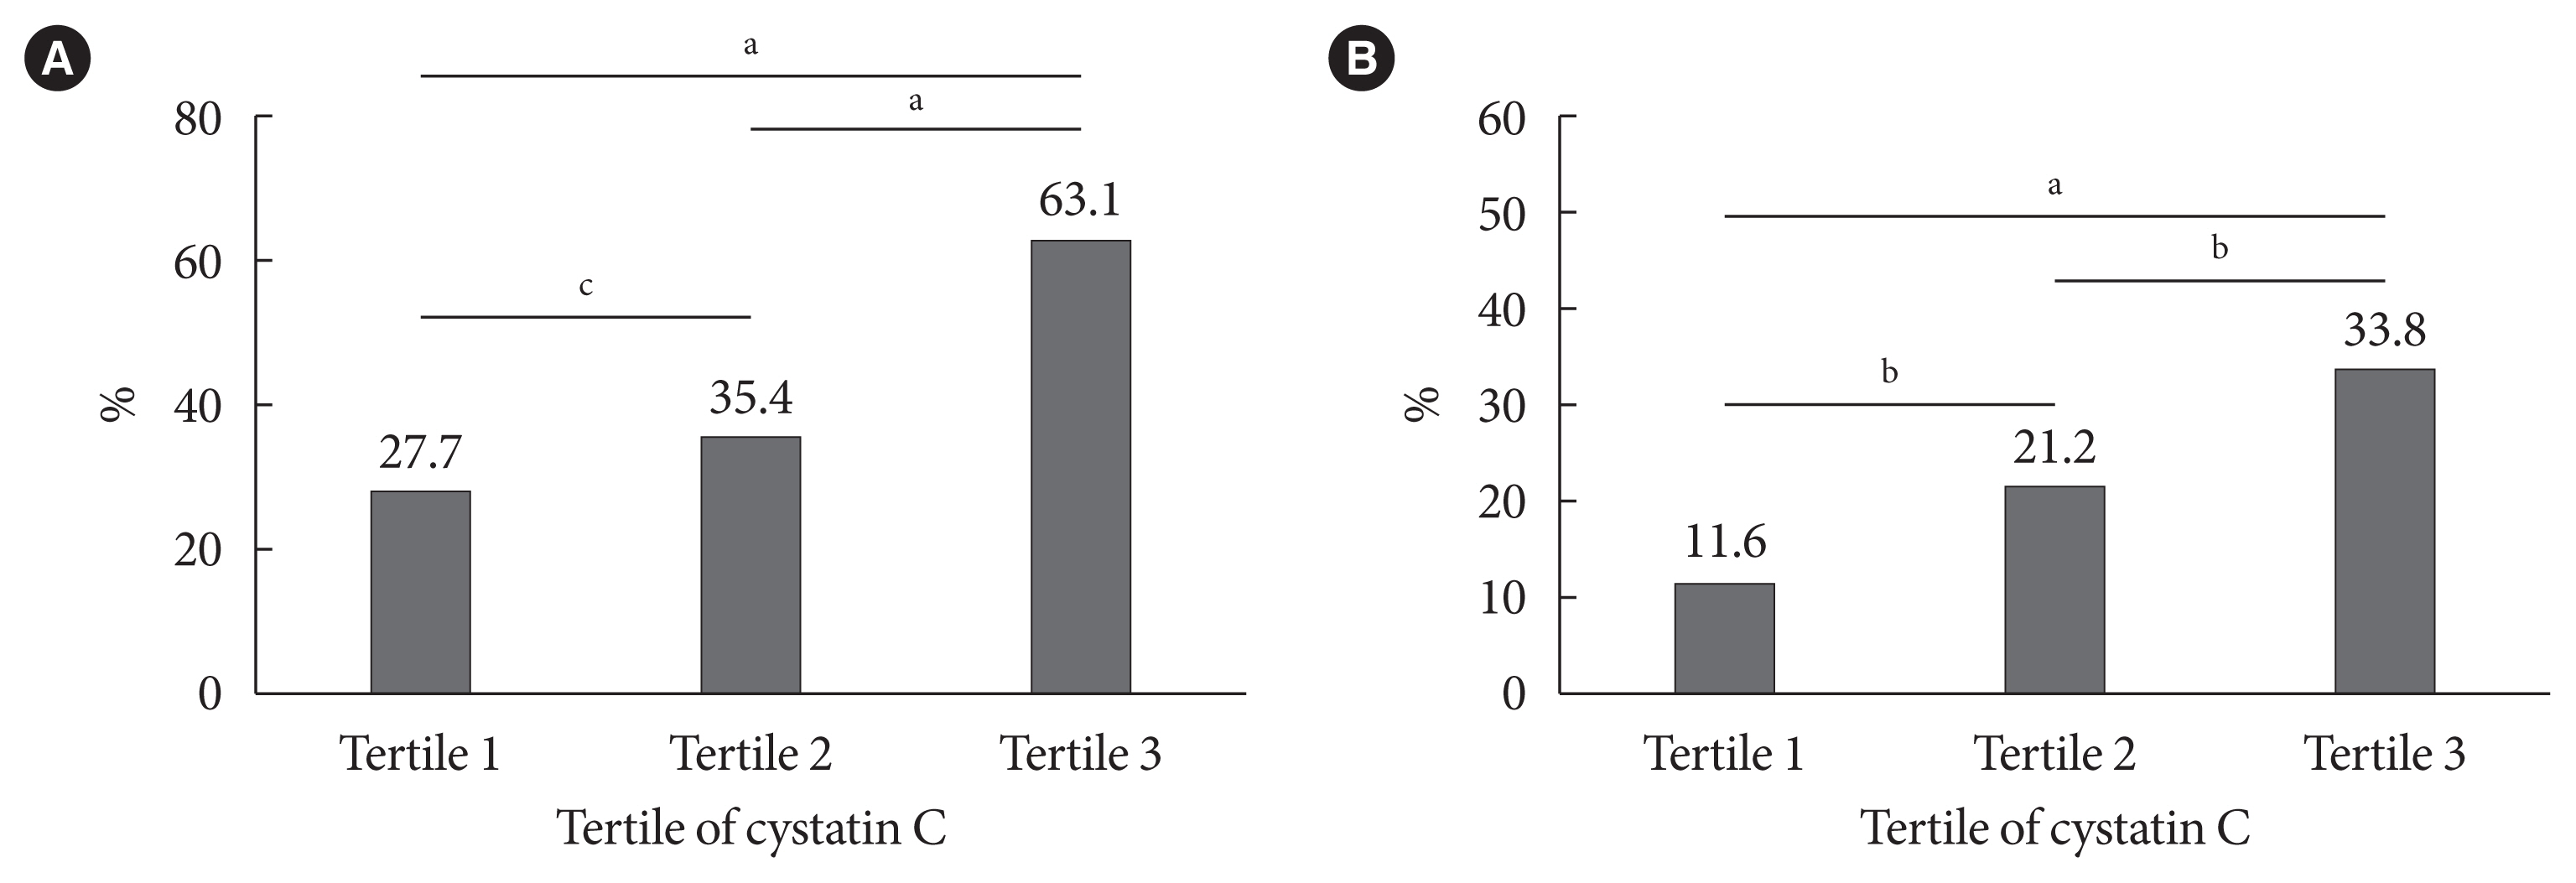
The prevalence of (A) brachial-ankle pulse wave velocity ≥1,550 cm/sec and (B) carotid plaque according to tertile of cystatin C. aP<0.001, bP<0.01, cP<0.05.

The correlation of other cardiovascular risk factors with cystatin C or eGFRcystatin C/eGFRcreatinine ratio
The association of the eGFRcystatin C/eGFRcreatinine ratio with baPWV and carotid plaque
The associations of the eGFRcystatin C/eGFRcreatinine ratio with high baPWV and carotid plaque are shown in Table 3. The eGFRcystatin C/eGFRcreatinine ratio <0.9 group had an increased risk for high baPWV compared to 0.9–1.1 group (odds ratio [OR], 2.34; 95% confidence interval [CI], 1.34 to 4.03). This group had a significantly higher prevalence of high baPWV after adjusting for other cardiovascular risk factors (OR, 2.54; 95% CI, 1.29 to 5.01). The eGFRcystatin C/eGFRcreatinine ratio >1.1 group tended to have a lower OR for high baPWV, but this difference was not statistically significant (OR, 0.82; 95% CI, 0.54 to 1.26). Supplementary Table 2 shows the association of tertile of cystatin C with high baPWV and carotid plaque. Cystatin C tertile was also significantly associated with the prevalence of high baPWV, but after adjustment of other risk factors, only the 3rd tertile of cystatin C showed a significant and independent association (OR, 1.89; 95% CI, 1.15 to 3.11). The prevalence of carotid plaque showed a high OR in eGFRcystatin C/eGFRcreatinine ratio <0.9 group compared to 0.9–1.1 group (OR, 2.25; 95% CI, 1.23 to 4.00). After adjusting for other cardiovascular risk factors, they still had a significantly higher prevalence of carotid plaque (OR, 1.95; 95% CI, 1.02 to 3.71). The tertile of cystatin C was significantly associated with the prevalence of carotid plaque, but this association disappeared after adjustment for other risk factors. These results indicated that the eGFRcystatin C/eGFRcreatinine ratio was a predictor of arterial stiffness and carotid plaque independent of conventional risk factors, and the highest tertile of cystatin C was only associated with arterial stiffness and not carotid plaque.
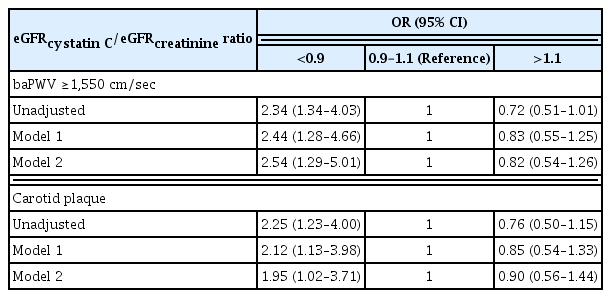
The associations of eGFRcystatin C/eGFRcreatinine ratio with baPWV ≥1,550 cm/sec and carotid plaque
In the final Cox proportional hazards multivariable regression models, the eGFRcystatin C/eGFRcreatinine ratio was independently associated with baPWV and carotid plaque after adjustment for other cardiovascular risk factors (Fig. 3). The eGFRcystatin C/eGFRcreatinine ratio <0.9 group showed significantly high cumulative hazard of both high baPWV and carotid plaque. To clarify the association of the eGFRcystatin C/eGFRcreatinine ratio with high baPWV and carotid plaque, we classified the subjects with or without CKD, which was defined by eGFR based on CAPA <60 mL/min/1.73 m2 or moderately increased albuminuria (≥30 mg/g) with reference to Kidney Disease: Improving Global Outcomes (KDIGO) [25]. Table 4 shows the results of Cox regression analysis for the association of the eGFRcystatin C/eGFRcreatinine ratio with high baPWV and carotid plaque depending on CKD status. This association was prominent in subjects without CKD and weak in subjects with CKD.
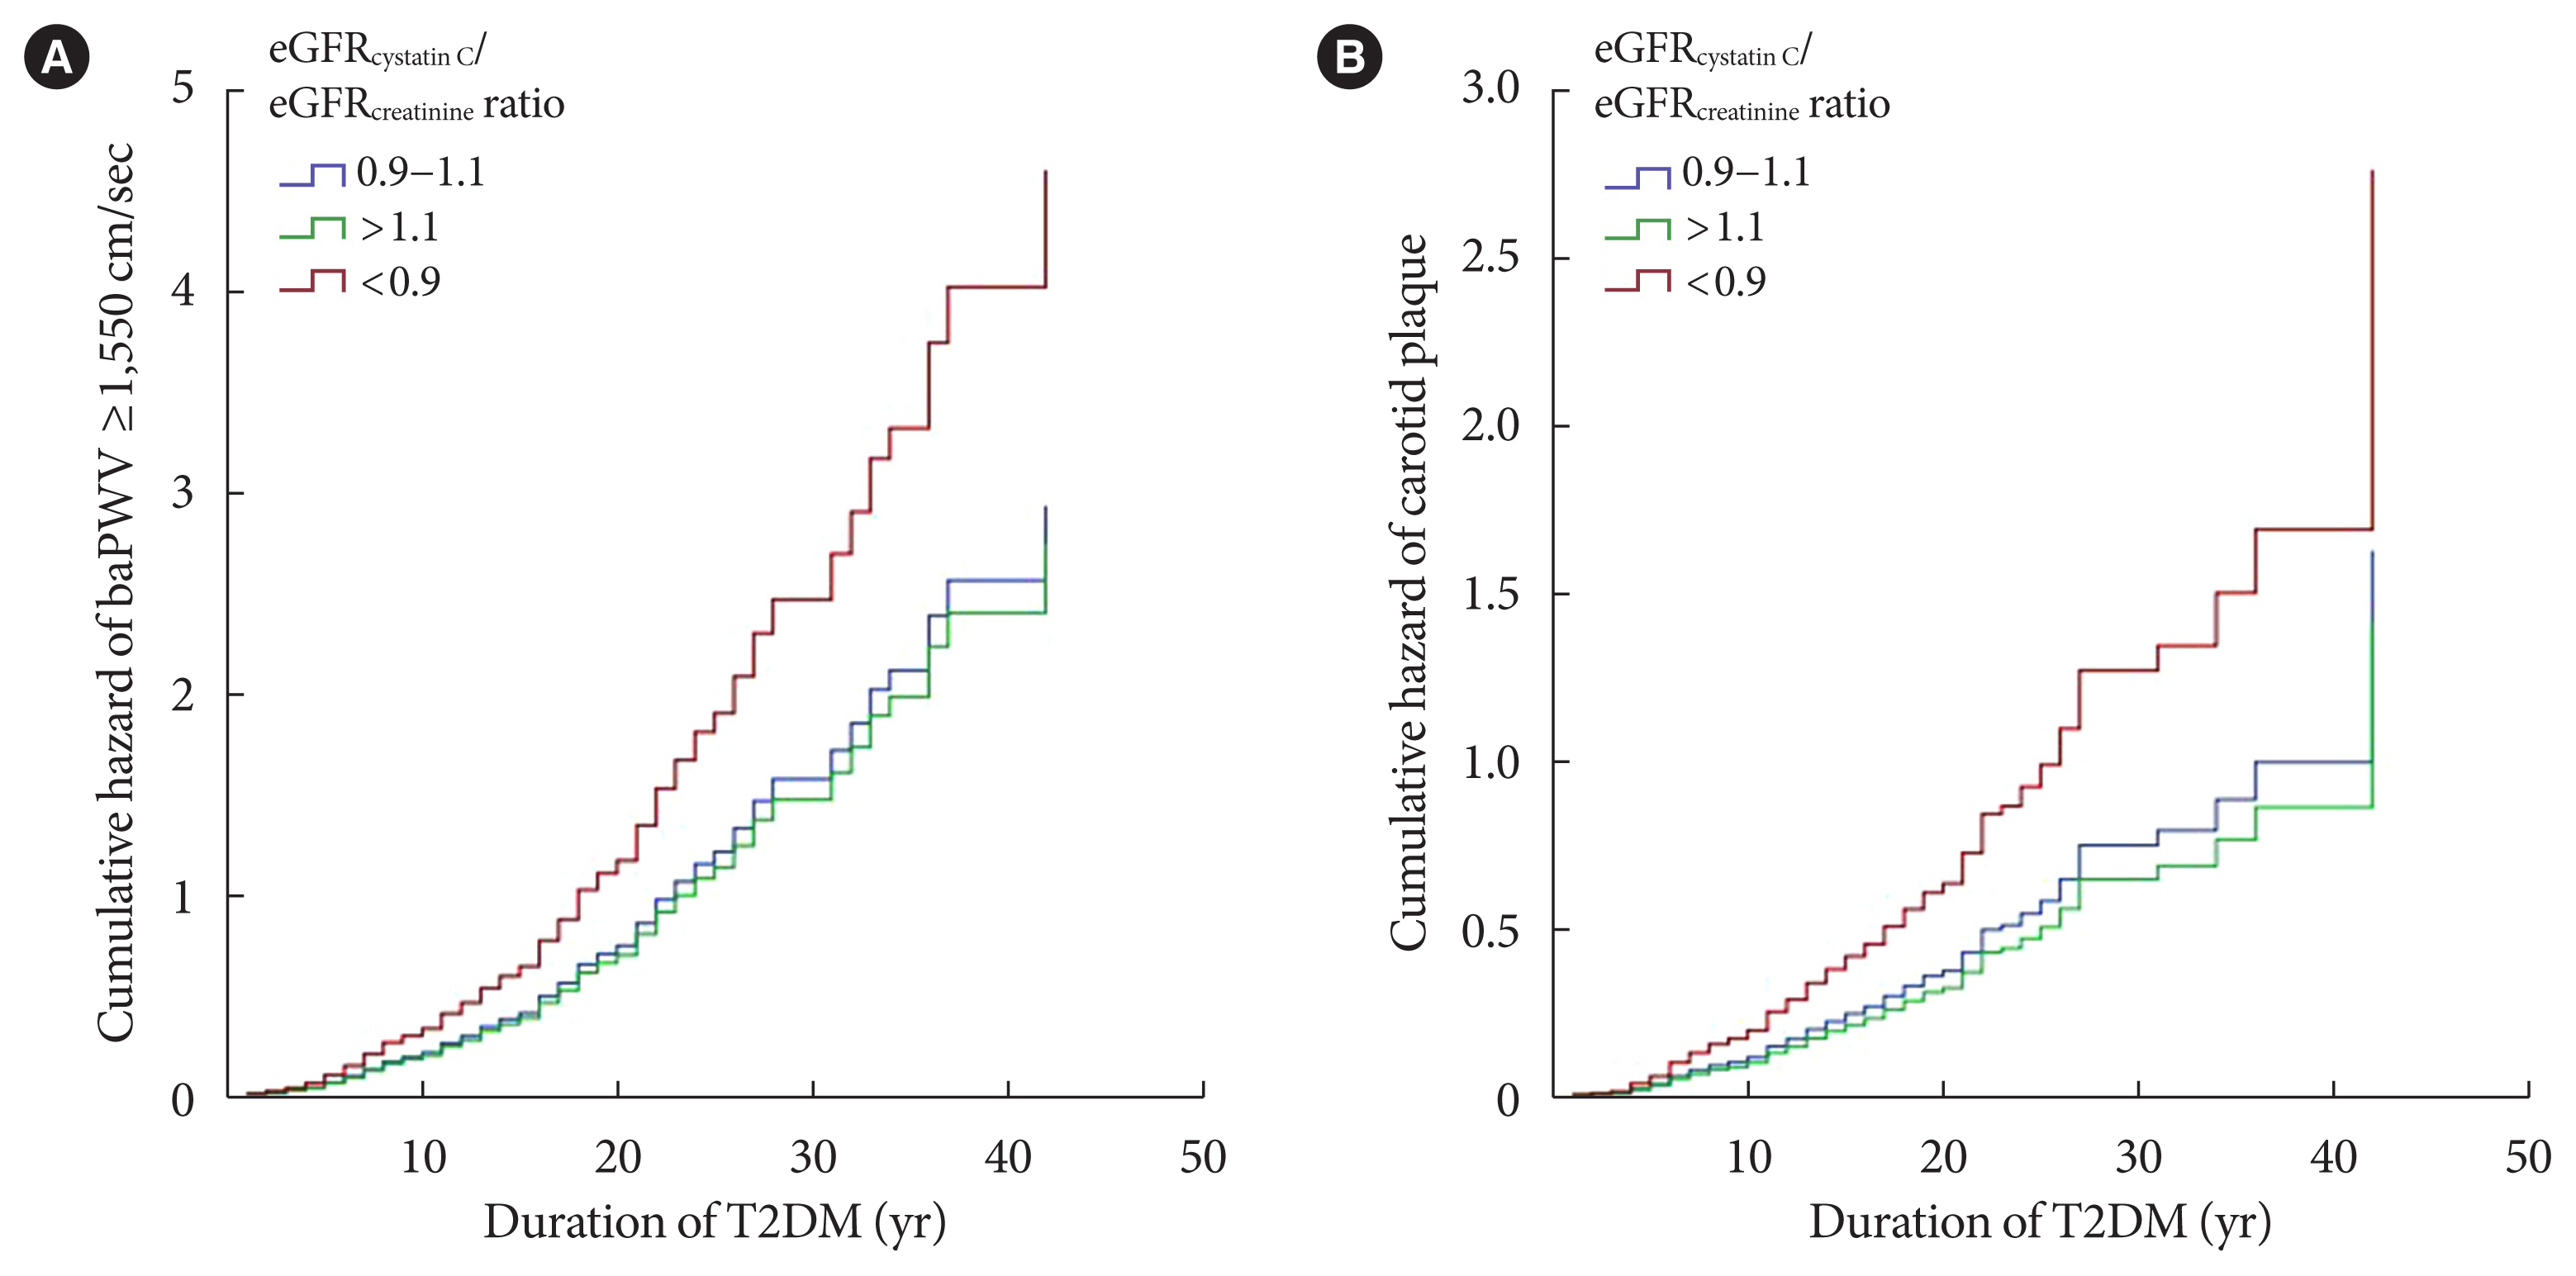
Graphs of Cox proportional hazards regression models showing the cumulative hazard function for (A) brachial-ankle pulse wave velocity ≥1,550 cm/sec and (B) carotid plaque according to estimated glomerular filtration rate (eGFR)cystatin C/eGFRcreatinine ratio. T2DM, type 2 diabetes mellitus.
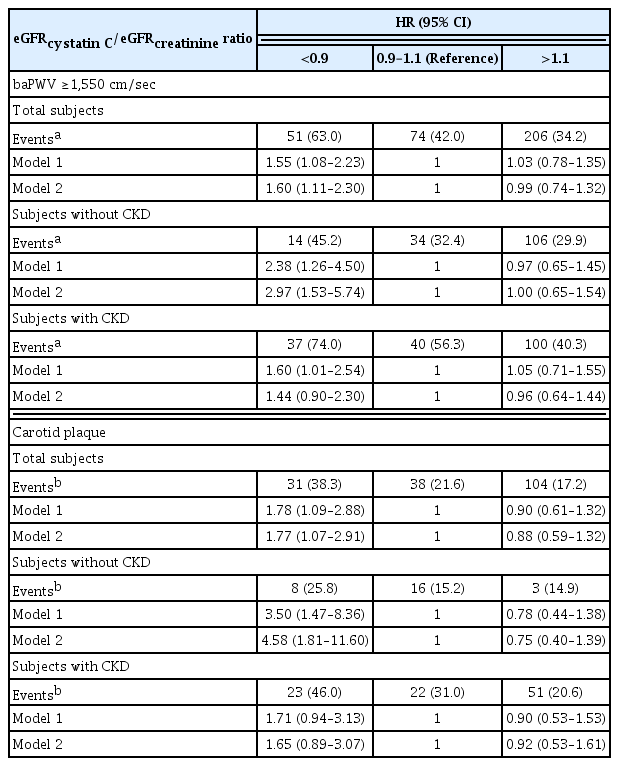
Cox proportional hazards multivariable models for the association between eGFRcystatin C/eGFRcreatinine ratio and prevalence of baPWV ≥1,550 cm/sec and carotid plaque
DISCUSSION
This study investigated the association of eGFRcystatin C/eGFRcreatinine ratio with arterial stiffness, and sub-clinical atherosclerosis in patients with T2DM. In total, 81 (9.4%) patients had an eGFRcystatin C/eGFRcreatinine ratio <0.9. Both an eGFRcystatin C/eGFRcreatinine ratio <0.9 and the 3rd tertile of cystatin C remained significant predictors of arterial stiffness after risk factors adjustment. For carotid plaque, only eGFRcystatin C/eGFRcreatinine ratio <0.9 remained as a valid predictor after multivariable adjustment. In the final Cox regression analysis, an eGFRcystatin C/eGFRcreatinine ratio <0.9 was a significant risk factor for arterial stiffness and carotid plaque and this was prominent in T2DM patients without CKD. These findings suggest that a lower eGFRcystatin C/eGFRcreatinine ratio represents a new potential surrogate marker for arterial stiffness and sub-clinical atherosclerosis in patients with T2DM, especially those without CKD.
The careful monitoring of cardiovascular risk is important in patients with T2DM. CKD is strongly associated with an increased risk for cardiovascular mortality, both among individuals with T2DM and in the general population [26–30]. Many studies have shown an increased cardiovascular risk beginning at stage 3 CKD, but some studies have reported the ASCVD risk to elevate in patients with milder renal impairment [10]. Mild-to-moderately low eGFR shows association with cardiovascular mortality, which is above the threshold of 60 mL/min/1.73 m2 for the detection of CKD [31]. Our study demonstrated that the eGFRcystatin C/eGFRcreatinine ratio showed a good association with a high baPWV and an increased frequency of carotid artery plaque, especially in diabetic patients with preserved eGFR. In addition to albuminuria, a good predictor of cardiovascular risk in diabetic patients [28,32], these findings suggest that the eGFRcystatin C/eGFRcreatinine ratio can be used to determine the risk for adverse cardiovascular outcomes above and beyond what is possible using that eGFR alone in patients with diabetes, particularly those without CKD.
There are some pathophysiological mechanisms that can explain the relationship between the eGFRcystatin C/eGFRcreatinine ratio and ASCVD risk. Recently, a Swedish research group reported that patients with eGFRcystatin C ≤60% of eGFRcreatinine had higher serum levels of β2-microglobulin and beta-trace protein than those with similar eGFRcystatin C and eGFRcreatinine levels [12]. The molecular weights of these proteins were similar to those of cystatin C, but significantly higher than those of creatinine. Thus, Grubb et al. [12] suggested a reduction in the pore diameter of the glomerular basement membrane (GBM) as SPS. This condition assessed by the eGFRcystatin C/eGFRcreatinine ratio was reported to be associated with increased mortality in a healthy elderly population and in patients who underwent cardiac surgery [15,33]. Serum levels of atherosclerosis-promoting proteins are significantly higher in patients with SPS compared to unaffected controls [34]. Since proteins with molecular weight less than approximately 20 kDa in molecular mass are primarily excreted via glomerular filtration, a reduction in their GFR would result in a simultaneous increase in their plasma levels [35]. It is not clear what causes the difference in the glomerular filtration of medium-sized proteins such as cystatin C and β2-microglobulin, among others, and the mechanism underlying their relationship to cardiovascular mortality. However, in DKD, thickening of the GBM is a pathophysiological hallmark, and a thicker GBM can interfere with the diffusion of medium-sized proteins. Oberg et al. [14] reported that the average GBM thickness was strongly inversely correlated with the eGFRcystatin C/eGFRcreatinine ratio, providing clinical and theoretical support for the association between thickening of the glomerular filter and lower eGFRcystatin C/eGFRcreatinine ratio in DKD. All of our study subjects had T2DM, and those with a lower eGFRcystatin C/eGFRcreatinine ratio showed a higher prevalence of arterial stiffness and carotid plaque, particularly in the preserved eGFR group. Therefore, a low eGFRcystatin C/eGFRcreatinine ratio could be a marker of glomerular filter thickening and an increase in the diffusion length of medium-sized molecules during the early stage of DKD. This marker could be helpful in determining the cardiovascular risk in patients with early stage of DKD.
Grubb et al. [12] suggested to define SPS as eGFRcystatin C ≤60% of the eGFRcreatinine. Both eGFRcystatin C and eGFRcreatinine, which are highly correlated with measured GFR, should be similar in healthy populations. Herou et al. [15] demonstrated that mortality following elective cardiac surgery increased with decreasing eGFRcystatin C/eGFRcreatinine ratio, which was increased already when the ratio decreased from 1.0 to 0.9. Thus, we compared patients with eGFRcystatin C/eGFRcreatinine ratio <0.9 to patients with 0.9–1.1 as the reference group. Patients with eGFRcystatin C/eGFRcreatinine ratio >1.1 group had a trend of lower risk of arterial stiffness and carotid plaque prevalence compared to the reference group, but the difference was not statistically significant. The proper cut-off level for SPS is not definite and could be associated with ethnicity or comorbidities, such as T2DM. In patients with T2DM, even eGFRcystatin C/eGFRcreatinine ratio <0.9 was helpful in evaluating sub-clinical atherosclerosis or arterial stiffness, particularly in patients with preserved eGFR. Further studies might provide more insight into the optimal cut-off level of the eGFRcystatin C/eGFRcreatinine ratio.
This study has several limitations. First, we have differently set the cut-off value of the SPS suggested by the Swedish group. The prevalence of an eGFRcystatin C/eGFRcreatinine ratio ≤0.6 was too low across previous studies [33]. In this study, only 12 (1.4%) patients had an eGFRcystatin C/eGFRcreatinine ratio ≤0.6. Therefore, we used a reference group with an eGFRcystatin C/eGFRcreatinine ratio of 0.9–1.1, and compared it to groups with ratios <0.9, and >1.1, respectively. As mentioned above, this cut-off value needs to be validated to reflect SPS or the risk of ASCVD. Second, there was no diuretic usage data in this study. Diuretics have been shown to thicken GBM, possibly resulting in diuretic resistance [36]. However, studies that investigated the association between SPS and mortality in heart failure patients reported that SPS was independently associated with an increased risk of death even after adjustment for diuretic resistance [16]. Finally, although we attempted to adjust for a heterogeneous and clinically relevant panel of cardiovascular risk factors, the possibility that residual confounding factors may have influenced the outcome of the analysis cannot be excluded. Nevertheless, our study has several strengths. There are data available on urinary albumin excretion, which could have been used as an alternative prognostic marker. We also investigated the role of cystatin C, stratified by tertiles, which has been reported as a predictor of ASCVD in specific patient groups [37–41].
In conclusion, our findings suggest that the eGFRcystatin C/eGFRcreatinine ratio can be a predictor for arterial stiffness and sub-clinical atherosclerosis in diabetic patients with preserved eGFR. This study shows, for the first time, a relationship between a low eGFRcystatin C/eGFRcreatinine ratio and cardiovascular risk in patients with T2DM. Further studies are needed to investigate the results in population-based cohorts and experimental settings to reveal the pathophysiological mechanisms as a basis for potential interventions.
SUPPLEMENTARY MATERIALS
Supplementary materials related to this article can be found online at https://doi.org/10.4093/dmj.2022.0177.
Supplementary Table 1.
The baseline demographic and clinical characteristics of enrolled subjects according to tertile of cystatin
Supplementary Table 2.
The associations of tertile of cystatin C with baPWV ≥1,550 cm/sec and carotid plaque
ACKNOWLEDGMENTS
None
Notes
CONFLICTS OF INTEREST
No potential conflict of interest relevant to this article was reported.
AUTHOR CONTRIBUTIONS
Conception and design: A.R.K., M.J.L., D.Y., Y.H.K.
Acquisition of data, or interpretation of data: A.R.K., M.J.L., D.Y., Y.H.K.
Drafting the work or revising: A.R.K., M.J.L., D.Y., Y.H.K.
Final approval of the manuscript: A.R.K., M.J.L., D.Y., Y.H.K.
FUNDING
None