Glycemia according to the Use of Continuous Glucose Monitoring among Adults with Type 1 Diabetes Mellitus in Korea: A Real-World Study
Article information

Abstract
Background
We explored the association between continuous glucose monitoring (CGM) use and glycemia among adults with type 1 diabetes mellitus (T1DM) and determined the status of CGM metrics among adults with T1DM using CGM in the real-world.
Methods
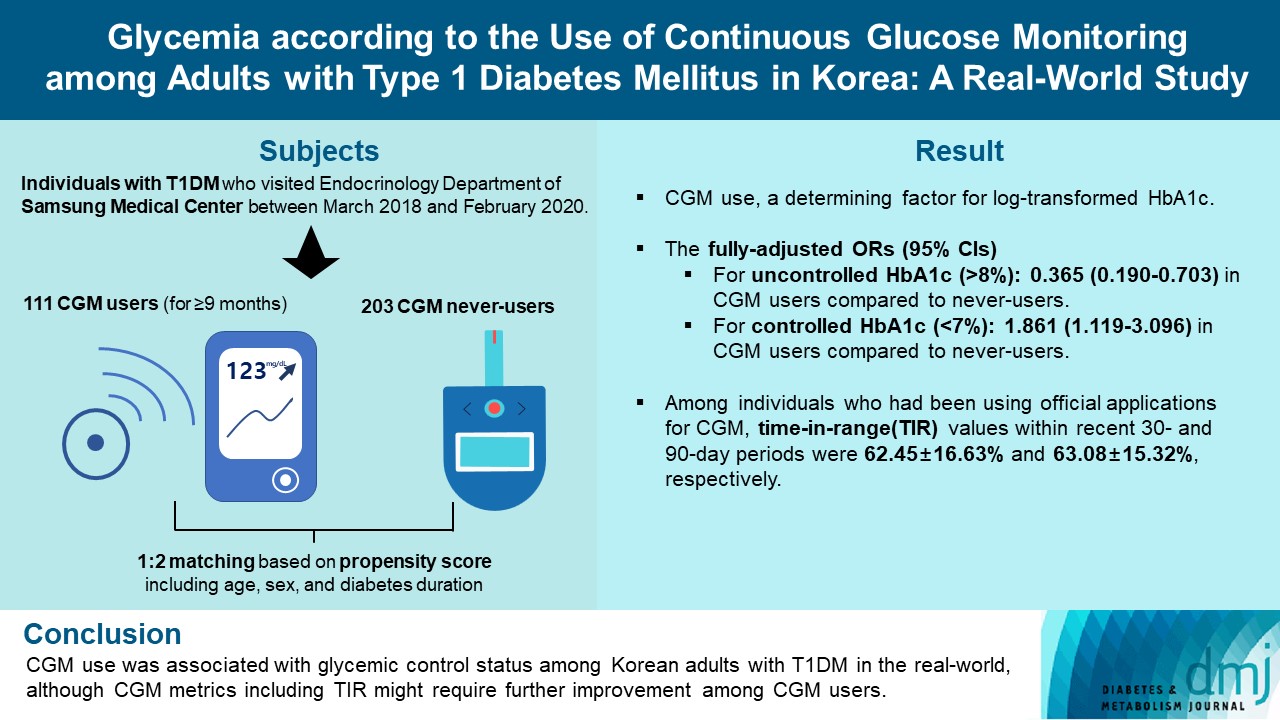
For this propensity-matched cross-sectional study, individuals with T1DM who visited the outpatient clinic of the Endocrinology Department of Samsung Medical Center between March 2018 and February 2020 were screened. Among them, 111 CGM users (for ≥9 months) were matched based on propensity score considering age, sex, and diabetes duration in a 1:2 ratio with 203 CGM never-users. The association between CGM use and glycemic measures was explored. In a subpopulation of CGM users who had been using official applications (not “do-it-yourself” software) such that Ambulatory Glucose Profile data for ≥1 month were available (n=87), standardized CGM metrics were summarized.
Results
Linear regression analyses identified CGM use as a determining factor for log-transformed glycosylated hemoglobin. The fully-adjusted odds ratio (OR) and 95% confidence interval (CI) for uncontrolled glycosylated hemoglobin (>8%) were 0.365 (95% CI, 0.190 to 0.703) in CGM users compared to never-users. The fully-adjusted OR for controlled glycosylated hemoglobin (<7%) was 1.861 (95% CI, 1.119 to 3.096) in CGM users compared to never-users. Among individuals who had been using official applications for CGM, time in range (TIR) values within recent 30- and 90-day periods were 62.45%±16.63% and 63.08%±15.32%, respectively.
Conclusion
CGM use was associated with glycemic control status among Korean adults with T1DM in the real-world, although CGM metrics including TIR might require further improvement among CGM users.
INTRODUCTION
Adoption of continuous glucose monitoring (CGM) in people with type 1 diabetes mellitus (T1DM) has expanded rapidly in the past decade [1,2]. With this rapid growth in CGM use, the Advanced Technologies and Treatments for Diabetes consensus summarized the standardized CGM metrics, including time in range (TIR) and glycemic variability, and specified their target values for clinical care [1]. Furthermore, CGM data presentation and visualization were standardized using a standard template, the Ambulatory Glucose Profile (AGP) report [1]. TIR, the time spent in the target glucose range (70 to 180 mg/dL), has been inversely associated with glycosylated hemoglobin and risk of microvascular complications [3].
Previous clinical trials have demonstrated the benefits of CGM use in terms of reducing glycosylated hemoglobin among adults with T1DM [4–10]. However, for optimal implementation of CGM and subsequent clinical benefits, robust and systematic diabetes education, training, and support should be offered [11–13]. For example, in a small trial conducted in underserved, less educated adults with T1DM, a glycosylated hemoglobin reduction in the CGM group was not achieved [14]. Furthermore, adherence to wearing CGM device might also affect the capability of CGM to improve glycemia [6,7]. Therefore, in the real-world, the association between CGM use and glycemia among adults with T1DM can vary. Even though CGM use has substantially increased in recent years, racial disparities remain in use of technology and glycemic control [15].
Nevertheless, to the best of our knowledge, no previous study has evaluated the glycemic control state of Korean adults with T1DM according to CGM use in the real-world. In this study, we explored an association between CGM use and glycemia among adults with T1DM in Korea. In addition, we summarized the standardized CGM metrics among adults with T1DM using CGM continuously in the real-world for the first time in Korea.
METHODS
Study population and design
This propensity-matched, cross-sectional study was conducted at Samsung Medical Center, a hospital-based tertiary referral center in Republic of Korea. Using medical records, 588 individuals with T1DM who visited the outpatient clinic of the Endocrinology Department of Samsung Medical Center between March 2018 and February 2020 were screened. The timepoint of the last outpatient visit between March 2018 and February 2020 was considered as the index date (baseline). We excluded individuals who visited the outpatient clinic only once (n=17); those with missing glycosylated hemoglobin variables (n=11); those with uncertain information about the initiation date or duration of CGM use (n=9); and irregular users/short-term users (those with consecutive duration of CGM use <9 months), or past users (those who had ever used CGM but not using it at baseline) of CGM (n=17). Through these processes, 111 continuous users of personal CGM (for ≥9 months) and 423 never-users of CGM were selected. We only included individuals who had been using CGM for at least 9 months as CGM users to select people adherent to continuous CGM use and expected to have been educated three times or more in interpreting CGM data, considering that the intervals between outpatient visits are generally 3 months at our center. The Endocrinology Department of our center operates specialized clinics for the systematic care of people with T1DM. At these specialized clinics, patient education on interpretation of their CGM data are provided for CGM users. CGM devices in use included Dexcom G5 and G6 (real-time CGM [RT-CGM]) (Dexcom, San Diego, CA, USA), the Guardian Connect Mobile system (RT-CGM) (Medtronic, Northridge, CA, USA), and the FreeStyle Libre Flash system (intermittently-scanned CGM [isCGM]) (Abbott Diabetes Care, Witney, UK). Propensity score (PS) matching (1:2) of CGM users and never-users was performed. The PS model was obtained from a multiple logistic regression analysis that included age, sex, and diabetes duration. We applied a greedy nearest neighbor matching on the logit of PS using calipers of width 0.2 of the standard deviation (SD) of the logit of the PS. Finally, 111 CGM users (for ≥9 months) and 203 matched CGM never-users were enrolled (Fig. 1). The distributions of PSs are shown in Supplementary Fig. 1 and indicate that the two groups were well-matched.
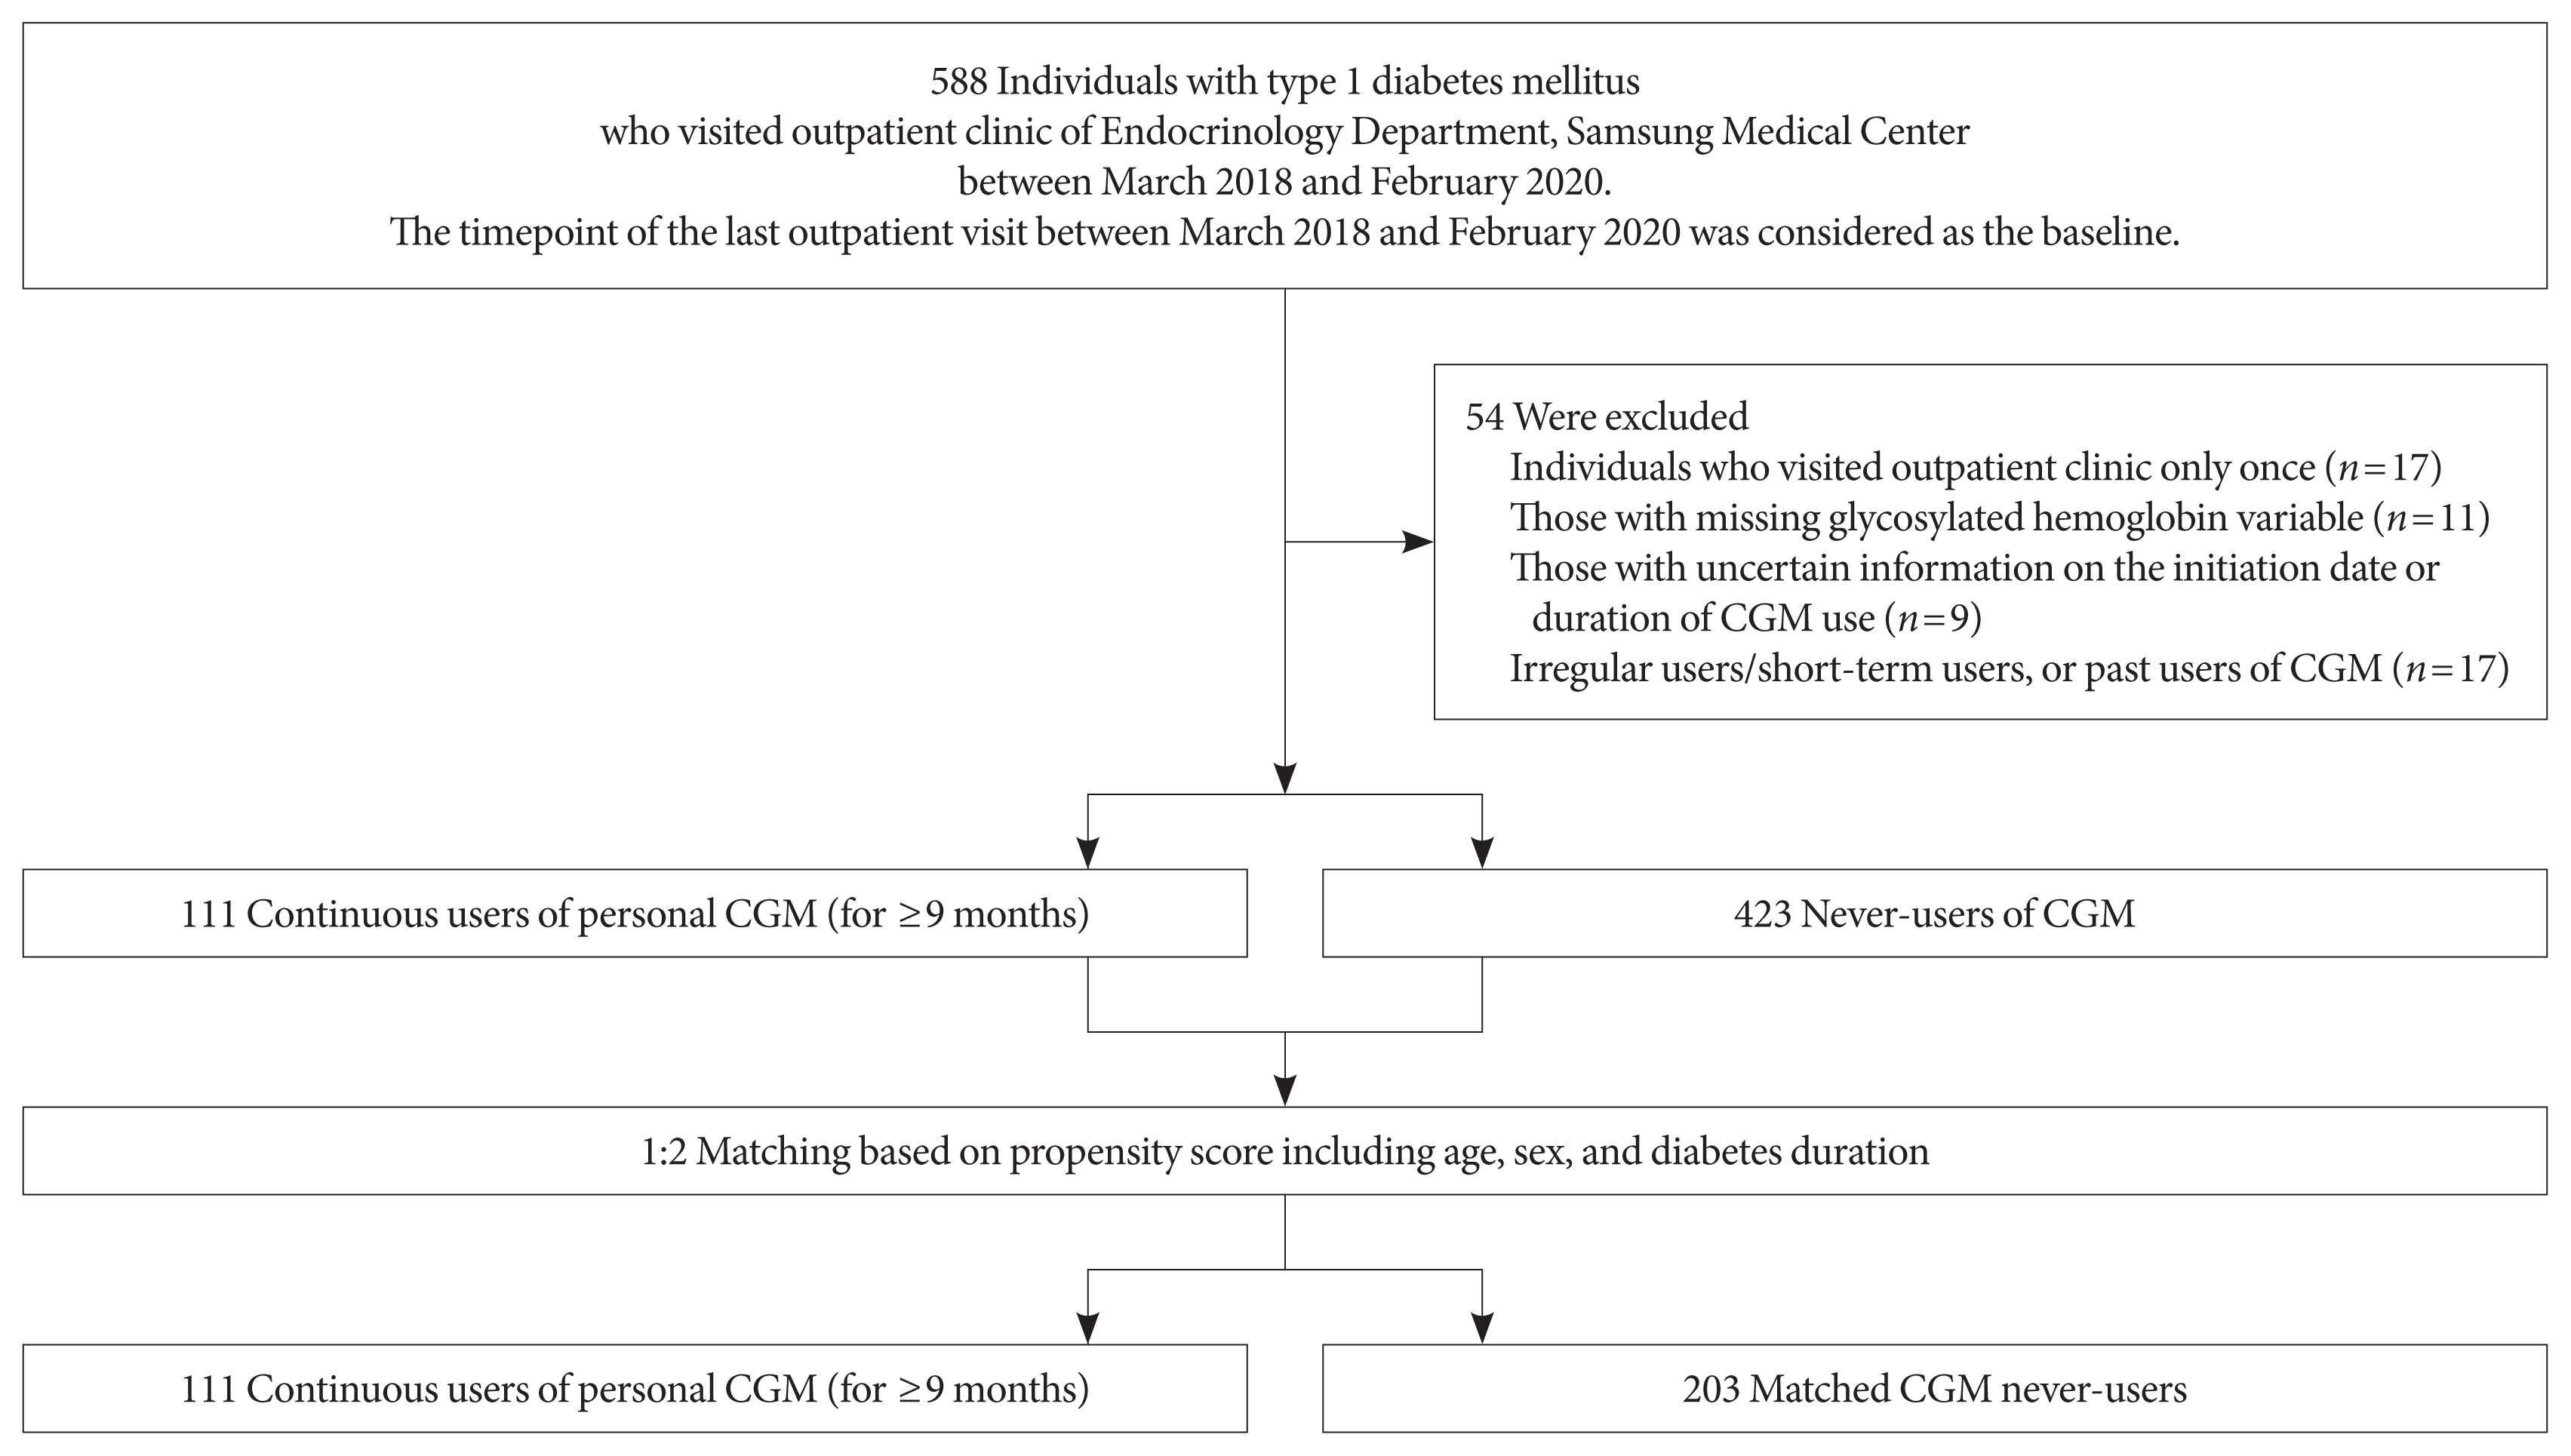
Flow diagram of participant selection. CGM, continuous glucose monitoring.
This study was approved by the Institutional Review Board (IRB) of Samsung Medical Center (IRB file no. SMC 2020-11-008-001) and was conducted in accordance with the Declaration of Helsinki. An exemption from informed consent was granted by the IRB because all data were analyzed anonymously.
Data collection
Demographic and clinical data of baseline, including age, sex, diabetes duration, total daily dose of insulin, use of an insulin pump, history of cerebral infarction and/or acute myocardial infarction (AMI) during the previous 5 years from baseline, presence of diabetic retinopathy or end-stage renal disease (ESRD), height, weight, blood pressure (BP), and laboratory results were retrospectively extracted from electronic medical records. Collected laboratory data, which were gathered after an 8-hour overnight fast, included glycosylated hemoglobin; glycated albumin (GA); fasting plasma glucose; aspartate aminotransferase; alanine aminotransferase; blood urea nitrogen; creatinine; and lipid profiles including total cholesterol, triglycerides, high-density lipoprotein cholesterol, and low-density lipoprotein cholesterol. The fasting plasma glucose level was determined using the glucose oxidase method, and lipid profiles were measured using a Hitachi 7600 autoanalyzer (Hitachi Instruments Service, Tokyo, Japan). High-performance liquid chromatography on a VARIANT II TURBO analyzer (Bio-Rad Laboratories, Hercules, CA, USA) was used to measure glycosylated hemoglobin. Serum GA level was determined by an enzymatic method using a Lucica GA-L kit (Asahi Kasei Pharma Corporation, Tokyo, Japan). Body mass index (BMI) was calculated as body weight in kilograms divided by height in meters squared (kg/m2). Estimated glomerular filtration rate (eGFR) was calculated using Chronic Kidney Disease Epidemiology Collaboration equations [16]. We defined uncontrolled glycosylated hemoglobin as >8% and controlled glycosylated hemoglobin as <7% of the baseline level.
Statistical analysis
All statistical analyses were conducted using SAS version 9.4 (SAS Institute Inc, Cary, NC, USA) and MedCalc statistical software version 20.100 (MedCalc Software, Ostend, Belgium). Two-tailed P values <0.05 were considered statistically significant. The characteristics of the study population are presented as mean with SD, median with interquartile range, or number with percentage. To compare characteristics between two PS-matched groups, Student’s t-test or the Mann–Whitney U test was used for continuous variables, while the chi-square test or Fisher’s exact test was applied for categorical variables. After the Shapiro–Wilk test that demonstrated non-normal distribution (P<0.0001), glycosylated hemoglobin was log-transformed to achieve a normal distribution of skewed data. Linear regression analyses using log-transformed glycosylated hemoglobin level as a dependent variable were conducted to determine the relative contribution of specific variables, including CGM use. In addition to the CGM use, age, sex, BMI, and systolic and diastolic BPs were used as potential independent variables. Additional multivariable analysis including age, sex, BMI, systolic BP, use of insulin pump, eGFR, and diabetes duration in addition to the CGM use was also conducted. Logistic regression analyses with uncontrolled (>8%) and controlled glycosylated hemoglobin (<7%) as dependent variables were performed to identify whether CGM use could influence these outcome variables. These analyses were performed in the crude (unadjusted) model and three multivariable-adjusted models (models 1, 2, and 3). Model 1 was adjusted for age, sex, diabetes duration, and BMI; model 2 was additionally adjusted for history of cerebral infarction and AMI during the previous 5 years from baseline, and presence of diabetic retinopathy and ESRD at baseline; and model 3 was adjusted for the use of insulin pump, and eGFR in addition to the potential confounders included in model 1. In subpopulations of CGM users who had been using official applications (i.e., not “do-it-yourself” [DIY] software) with at least 1 (n=87) or 3 (n=86) months of AGP data, standardized CGM metrics (including mean glucose, glycemic variability expressed as % coefficient of variation [CV], TIR, time above range, time below range, and percentage of time CGM is active) were summarized.
Subgroup and sensitivity analyses
We compared the glycosylated hemoglobin according to CGM use in subgroups categorized by age (<40 years vs. ≥40 years) and use of insulin pump, and after excluding isCGM users, RT-CGM users, users of CGM with official applications, users of CGM with DIY software, and those who initiated CGM at <40 or ≥40 years. Logistic regression analyses with uncontrolled (>8%) or controlled (<7%) glycosylated hemoglobin as dependent variables were also conducted in these subpopulations except for in insulin pump users because of too small number of subjects (n=16 including only four CGM users).
RESULTS
Baseline characteristics
The study population consisted of 314 subjects, including CGM users (n=111) and 1:2 PS-matched (based on age, sex, and diabetes duration) CGM never-users (n=203). After PS matching, age, sex, and diabetes duration were well-balanced (Table 1, Supplementary Fig. 1). The baseline characteristics of the study population are presented according to CGM use (Table 1). Glycosylated hemoglobin and GA were significantly lower in CGM users than never-users. The mean±SD glycosylated hemoglobin level in CGM users was 7.13%±0.94%, while that in CGM never-users was 7.66%±1.37%. Other baseline characteristics were not significantly different between the two groups. Glycosylated hemoglobin level was also significantly lower in CGM users than never-users when analyzed by analysis of covariance (ANCOVA) with age, sex, diabetes duration, BMI, use of insulin pump, and eGFR values as covariate (Supplementary Table 1).

Baseline characteristics of participants
CGM use was independently associated with log-transformed glycosylated hemoglobin level
Linear regression analyses were conducted to identify independent predictors of log-transformed glycosylated hemoglobin level (Table 2). In univariable analysis, CGM use was independently associated with log-transformed glycosylated hemoglobin (P=0.0004). In multivariable analyses, among the potential covariates, log-transformed glycosylated hemoglobin concentration was independently associated with CGM use (P<0.0001 and P=0.0002).

Linear regression analyses to identify factors associated with log-transformed glycosylated hemoglobin level
Association of uncontrolled (>8%) or controlled (<7%) glycosylated hemoglobin with CGM use
Table 3 summarizes the results of logistic regression analysis with odds ratios predicting uncontrolled (>8%) or controlled (<7%) glycosylated hemoglobin according to CGM use. CGM users had 0.365 times odds (95% confidence interval, 0.190 to 0.703) of uncontrolled glycosylated hemoglobin (>8%) compared to never-users in the fully-adjusted model 3. CGM users had 1.861 times the odds (95% confidence interval, 1.119 to 3.096) of controlled glycosylated hemoglobin (<7%) compared to never-users in the fully-adjusted model 3.
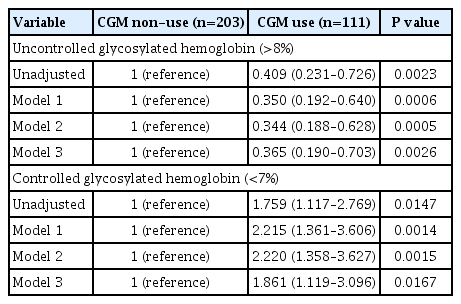
Odds ratios and 95% confidence intervals of uncontrolled (>8%) or controlled (<7%) glycosylated hemoglobin according to CGM use
CGM metrics in CGM users with official applications
Among CGM users with AGP data for at least 1 month (n=87) or 3 months (n=86), standardized CGM metrics were summarized (Table 4). In this analysis, individuals using non-official applications (DIY software), from which official AGP data were unavailable, were excluded. CGM metrics within recent 90-day periods were comparable to those within recent 30-day periods. The mean±SD TIRs within recent 30- and 90-day periods, respectively, were 62.45%±16.63% and 63.08%± 15.32%. Proportions of individuals with TIR >70% during recent 30- and 90-day periods were 32.2% (28 of 87) and 31.4% (27 of 86), respectively. The mean±SD glycemic variability, expressed as %CV, was 36.63%±5.46% during the recent 30-day period and 37.30%±7.94% during the recent 90-day period. The mean action time (percentage of time CGM is active) within the recent 30- and 90-day periods was maintained as >85%.
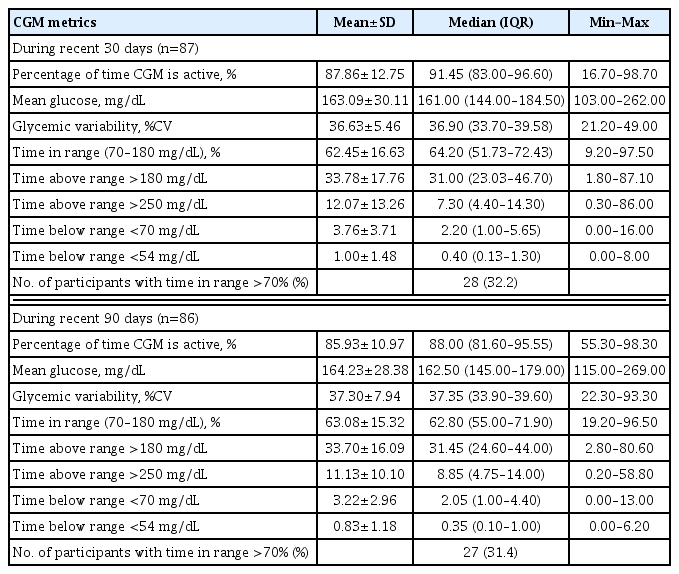
Standardized CGM metrics among CGM users (who had been using official applications) with available Ambulatory Glucose Profile data
Subgroup and sensitivity analyses
Glycosylated hemoglobin levels were compared according to CGM use in various subpopulations (Supplementary Table 2). CGM users tended to have lower levels of glycosylated hemoglobin compared to never-users although statistical significance was not secured in three subpopulations (insulin pump users, subpopulation without RT-CGM users, and subpopulation including only CGM never-users and those who initiated CGM at ≥40 years) probably due to lack of number of subjects in a group. Logistic regression analyses with uncontrolled (>8%) or controlled (<7%) glycosylated hemoglobin as dependent variables conducted in various subpopulations (Supplementary Tables 3–7) also demonstrated trends of results consistent to the main analyses.
DISCUSSION
This propensity-matched, cross-sectional, real-world study demonstrated that personal CGM use (for ≥9 months) was associated with glycemic control status of Korean adults with T1DM, and it presented the current CGM metrics among Korean adults with T1DM in a real-world clinical setting. In our study population with T1DM, glycosylated hemoglobin and GA levels were significantly lower in CGM users compared to PS-matched never-users, and CGM use was a determining factor of log-transformed glycosylated hemoglobin. CGM use, compared with non-use, was associated with 1.9 times greater odds of controlled glycosylated hemoglobin (<7%) and approximately one-third of the odds for uncontrolled glycosylated hemoglobin (>8%) among adults with T1DM in the real-world. These associations were consistently observed in subgroup and sensitivity analyses.
Our findings are consistent with those of previous trials that demonstrated the benefits of CGM in improving glycemia in adults with T1DM [4–10]. In several randomized trials of adults with T1DM, CGM use with educational support was shown to reduce glycosylated hemoglobin [4–10] and frequency of hypoglycemia [17–20]. However, to obtain these clinical benefits of CGM, systematic educational support and training are mandatory [11,12]. A small, randomized trial in underserved, less educated adults with T1DM failed to show a significant reduction in glycosylated hemoglobin with CGM use [14]. In the United States, according to an analysis of the type 1 diabetes (T1D) Exchange registry [15], the mean glycosylated hemoglobin changed little between 2010–2012 and 2016–2018 and seemed to have worsened especially in adolescents, although CGM use, which was associated with lower glycosylated hemoglobin level, has expanded substantially in recent years. Nevertheless, our study provided evidence of an association between CGM use and glycemia among Korean adults with T1DM in the real-world. To the best of our knowledge, this is the first study to assess the relationship between CGM use and glycemic control state of Korean adults with T1DM in the real-world. Our findings suggest that clinical benefits of CGM can be obtained also in the real-world. Similarly, a recent analysis of 752 Korean children and adolescents with T1DM during 2010 to 2019 reported that CGM use was associated with lower mean glycosylated hemoglobin level and a reduced incidence of diabetic ketoacidosis [2].
Among CGM users with available AGP data included in our study, the mean TIR was 62.45% for the recent 30-day period and 63.08% for the recent 90-day period. Less than one-third of those with available AGP data exhibited TIR of >70% during recent 30- and 90-day periods. The mean glycemic variability (%CV) was 36.63% during the recent 30-day period and 37.30% during the recent 90-day period. Even though glycemic targets should be individualized based on patient characteristics, standard targets for general populations with T1DM are >70% for TIR and ≤36% for glycemic variability presented as %CV [1]. Several studies have demonstrated correlations of TIR with diabetes complications, including diabetic retinopathy and albuminuria [21–23], as well as an inverse relationship between TIR and glycosylated hemoglobin [24,25]. Among adults with T1DM, a TIR of 70% strongly corresponded with a glycosylated hemoglobin concentration of approximately 7%, and a 10% increase in TIR corresponded with an approximately 0.5% decrease in glycosylated hemoglobin [24]. A higher %CV has been associated with a minimum glucose level <70 mg/dL during three-day CGM, regardless of diabetes type [26]. Furthermore, in individuals with diabetes, particularly insulin-treated people, the frequency of hypoglycemia has been reported to vary significantly with a %CV threshold of 36%, supporting a %CV of 36% as a reasonable criterion to discriminate between stable and unstable glycemia in diabetes [27]. Considering these standard targets based on an increasing body of evidence, CGM metrics among Korean adults with T1DM in this real-world study might need further improvement.
Nevertheless, TIR values of CGM users with available AGP data in our study were relatively favorable compared to those reported in previous studies of people with T1DM. TIR within recent 90 days was stable enough to be comparable to that within recent 30-day periods and showed similar values to that observed in clinical trials that provided structured education combined with CGM use. Previously, CGM metrics of 545 adults with T1DM from four randomized trials were analyzed [24]. Participants included in their analyses were in an intervention arm of trials that assessed CGM as an intervention over a 6-month period. In their analyses [24], mean TIR at baseline was 58%, and ranged from 46% to 64% according to trials. In month 6, mean TIR changed to 61% (51% to 70% according to trials), which is comparable to that of our study (62.45% during recent 30 days and 63.08% during recent 90 days). Furthermore, in a single-center, 3-month, randomized controlled trial conducted at our center among people with T1DM, TIR was significantly higher in participants provided with structured individualized education combined with CGM use than in controls with CGM alone [13]. In this clinical trial [13], mean TIR at week 12 was only 44.5% in the control group whereas that in the education group was 63.4%, comparable to that in our study population with available AGP data. These favorable TIR values and better glycemia among CGM users than never-users in our study may have originated from the inclusion of continuous CGM users for at least 9 months (considered to be adherent to continuous CGM use) and education programs at our center. At our Endocrinology Department, specialized clinics are operated for the systematic education and training of people with T1DM. The education program provided at these clinics include interpretation of CGM metrics and adjustment of insulin regimen based on these interpretations for CGM users.
Several limitations of this study should be acknowledged. First, the cross-sectional design of this study can limit the clarification of causal relationships. Second, despite PS matching based on age, sex, and diabetes duration, and an adjustment for potential confounders during logistic regression analyses, the possibility of residual confounding effects cannot be excluded. For example, CGM users might include people more motivated to manage their diabetes. Third, as a single-center study conducted at a hospital-based tertiary referral center, our study population might not represent general Korean adults with T1DM. Also, the diabetes education and support systems at our center may differ from those of other centers. Fourth, standardized CGM metrics were analyzed only among CGM users who had been using official applications so that AGP data were available. Individuals who had been using non-official applications (DIY software) were excluded, which raises the possibility of selection bias. Considering that the median glycosylated hemoglobin level in DIY software users (6.70%) was significantly lower than that in official application users (7.10%) (P=0.0181) and DIY software users are likely to be active patient groups, these patients might have had more favorable CGM metrics and have contributed to the improved glycemia among CGM users. Last, we could not address the effect of CGM on glycemia according to educational status, support system, and adherence of patients. CGM users (for ≥9 months) included in our study are presumed to be adherent to CGM use and repeatedly educated for better implementation of CGM considering the routine education programs provided at our center.
In conclusion, CGM use, compared to never-use, was associated with better glycemia among Korean adults with T1DM in the real-world. Our findings indicate that potential clinical benefits of CGM can be expected even in a real-world setting where appropriate user trainings are provided for individuals adherent to continuous CGM use. Regarding the standard targets for general populations with T1DM, standardized CGM metrics, including TIR and %CV of Korean adults with T1DM, in this real-world study might need further improvement. Further research encompassing participants with diverse educational status, support system and compliance in the real-world may be needed to further clarify the individual role of these factors.
SUPPLEMENTARY MATERIALS
Supplementary materials related to this article can be found online at https://doi.org/10.4093/dmj.2022.0032.
Supplementary Fig. 1.
Density of propensity scores (A) before and (B) after matching. CGM, continuous glucose monitoring.
Supplementary Table 1. Comparison of glycosylated hemoglobin according to CGM use
Supplementary Table 2. Comparison of glycosylated hemoglobin according to CGM use in subgroups
Supplementary Table 3. Odds ratios and 95% confidence intervals of uncontrolled (>8%) or controlled (<7%) glycosylated hemoglobin according to CGM use among individuals aged <40 or ≥40 years
Supplementary Table 4. Odds ratios and 95% confidence intervals of uncontrolled (>8%) or controlled (<7%) glycosylated hemoglobin according to CGM use, sensitivity analyses after excluding intermittently-scanned CGM users or real-time CGM users
Supplementary Table 5. Odds ratios and 95% confidence intervals of uncontrolled (>8%) or controlled (<7%) glycosylated hemoglobin according to CGM use, sensitivity analyses after excluding CGM users with official applications or CGM users with DIY software
Supplementary Table 6. Odds ratios and 95% confidence intervals of uncontrolled (>8%) or controlled (<7%) glycosylated hemoglobin according to CGM use, sensitivity analyses after excluding insulin pump users
Supplementary Table 7. Odds ratios and 95% confidence intervals of uncontrolled (>8%) or controlled (<7%) glycosylated hemoglobin according to CGM use, sensitivity analyses after excluding CGM users who initiated CGM at <40 or ≥40 years
dmj-2022-0032-Supplementary-Table.pdfACKNOWLEDGMENTS
The authors thank the Biostatistics Department of Samsung Biomedical Research Institute for its statistical assistance.
Notes
CONFLICTS OF INTEREST
No potential conflict of interest relevant to this article was reported.
AUTHOR CONTRIBUTIONS
Conception or design: Y.B.L., J.H.K.
Acquisition, analysis, or interpretation of data: Y.B.L., M.K.
Drafting the work or revising: Y.B.L., M.K., J.H.K.
Final approval of the manuscript: Y.B.L., M.K., J.H.K.
FUNDING
None