
- Current
- Browse
- Collections
-
For contributors
- For Authors
- Instructions to authors
- Article processing charge
- e-submission
- For Reviewers
- Instructions for reviewers
- How to become a reviewer
- Best reviewers
- For Readers
- Readership
- Subscription
- Permission guidelines
- About
- Editorial policy
Articles
- Page Path
- HOME > Diabetes Metab J > Volume 47(2); 2023 > Article
-
Original ArticleComplications Association of Body Mass Index and Fracture Risk Varied by Affected Bones in Patients with Diabetes: A Nationwide Cohort Study
-
Se-Won Lee1,2
 , Kyungdo Han3, Hyuk-Sang Kwon4,5
 -
Diabetes & Metabolism Journal 2023;47(2):242-254.
DOI: https://doi.org/10.4093/dmj.2022.0001
Published online: January 19, 2023
1Department of Orthopaedic Surgery, College of Medicine, The Catholic University of Korea, Seoul, Korea
2Department of Orthopaedic Surgery, Yeouido St. Mary’s Hospital, College of Medicine, The Catholic University of Korea, Seoul, Korea
3Department of Statistics and Actuarial Science, Soongsil University, Seoul, Korea
4Department of Internal Medicine, College of Medicine, The Catholic University of Korea, Seoul, Korea
5Department of Internal Medicine, Yeouido St. Mary’s Hospital, College of Medicine, The Catholic University of Korea, Seoul, Korea
-
Corresponding authors: Kyungdo Han Department of Statistics and Actuarial Science, Soongsil University, 369 Sangdo-ro, Dongjak-gu, Seoul 06978, Korea E-mail: hkd917@naver.com
-
Hyuk-Sang Kwon Department of Internal Medicine, Yeouido St. Mary’s Hospital, The Catholic University of Korea, 10 63-ro, Yeongdeungpo-gu, Seoul 07345, Korea E-mail: drkwon@catholic.ac.kr
Copyright © 2023 Korean Diabetes Association
This is an Open Access article distributed under the terms of the Creative Commons Attribution Non-Commercial License (http://creativecommons.org/licenses/by-nc/4.0/) which permits unrestricted non-commercial use, distribution, and reproduction in any medium, provided the original work is properly cited.
ABSTRACT
-
Background
- Body mass index (BMI) is a risk factor for the type 2 diabetes (T2DM), and T2DM accompanies various complications, such as fractures. We investigated the effects of BMI and T2DM on fracture risk and analyzed whether the association varied with fracture locations.
-
Methods
- This study is a nationwide population-based cohort study that included all people with T2DM (n=2,746,078) who received the National Screening Program during 2009–2012. According to the anatomical location of the fracture, the incidence rate and hazard ratio (HR) were analyzed by dividing it into four categories: vertebra, hip, limbs, and total fracture.
-
Results
- The total fracture had higher HR in the underweight group (HR, 1.268; 95% CI, 1.228 to 1.309) and lower HR in the obese group (HR, 0.891; 95% CI, 0.882 to 0.901) and the morbidly obese group (HR, 0.873; 95% CI, 0.857 to 0.89), compared to reference (normal BMI group). Similar trends were observed for HR of vertebra fracture. The risk of hip fracture was most prominent, the risk of hip fracture increased in the underweight group (HR, 1.896; 95% CI, 1.178 to 2.021) and decreased in the obesity (HR, 0.643; 95% CI, 0.624 to 0.663) and morbidly obesity group (HR, 0.627; 95% CI, 0.591 to 0.665). Lastly, fracture risk was least affected by BMI for limbs.
-
Conclusion
- In T2DM patients, underweight tends to increase fracture risk, and overweight tends to lower fracture risk, but association between BMI and fracture risk varied depending on the affected bone lesions.
- Prevalence of diabetes has increased steadily during the last decades, leading to worldwide health concerns [1]. According to a World Health Organization (WHO) report [2], an estimated 422 million adults with diabetes were living in 2014, compared to 108 million in 1980. The age-standardized global prevalence of diabetes in 2014 has approximately doubled since 1980, rising from 4.7% to 8.5% in adults aged 18 years and older. The International Diabetes Federation (IDF) predicts the global number of diabetic patients and the prevalence to be 642 million and 10.4%, respectively in 2040 [3]. Diabetes being a substantial cause of mortality and morbidity worldwide has become a major public health problem. In 2010, there were approximately 1.3 million diabetes-related deaths worldwide, doubling compared to 1990 [4]. Diabetes is a metabolic disorder that greatly alters the body system affecting nearly all organs and resulting in various health complications.
- Previous studies have shown that individuals with type 1 diabetes mellitus (T1DM) have lower bone mineral density and higher risk of hip fractures [5]. Although type 2 diabetes mellitus (T2DM) also has been reported to show increased risk of hip fractures, the results are controversial [6-9]. Recently, even prediabetic conditions have been reported to be associated with the occurrence of hip fractures [10]. Some studies suggested that various factors, including abnormal bone turnover, poor glycemic control and bone loss, may explain the increased risk of fractures in T2DM [11-14]. It is recommended by the WHO to use body mass index (BMI) as an important indicator for obesity [15]. A higher BMI level is associated with a higher prevalence of T2DM, which is known as an important risk for hip fractures [16,17].
- Most studies have focused on hip fractures, and the fracture risk according to location of the skeletal lesion is not clear. Few studies have investigated the impact of BMI and T2DM in limited number of bones, and others have investigated whether the fracture risk differed depending on skeletal sites. In addition, the association between BMI and fracture risk in Asian populations have been reported, in whom obesity is not as extensive among diabetic patients as in Western countries [18, 19]. To fill in this gap, we first aimed to investigate the association between BMI and risk of fractures using a large nationwide study from health insurance claims data. We further analyzed whether the association varied by fracture location.
INTRODUCTION
- Data source and study population
- In this retrospective longitudinal nationwide population-based cohort study, we used the Korean National Health Insurance System (NHIS) database, a mandatory social medical insurance system run by the Korean government. Those enrolled in the health insurance service are recommended to receive health check-ups at least biennially. Among the patients who underwent health screenings from January 2009 to December 2012 we focused on patients with T2DM. At that time, enrolled diabetes mellitus (DM) patients were linked claim data and confirmed by medical details. In other words, definition of T2DM included the following criteria: (1) at least one claim per year under International Classification of Diseases, 10th Edition (ICD-10) codes E11–14 and at least one claim per year for the prescription of antidiabetic medication (sulfonylureas, metformin, meglitinides, thiazolidinediones, dipeptidyl peptidase-4 inhibitors, α-glucosidase inhibitors, or insulin) or (2) fasting glucose level ≥126 mg/dL. Patients who were admitted to the hospital more than once or visited the outpatient clinic more than twice were also included as T2DM subjects [20].
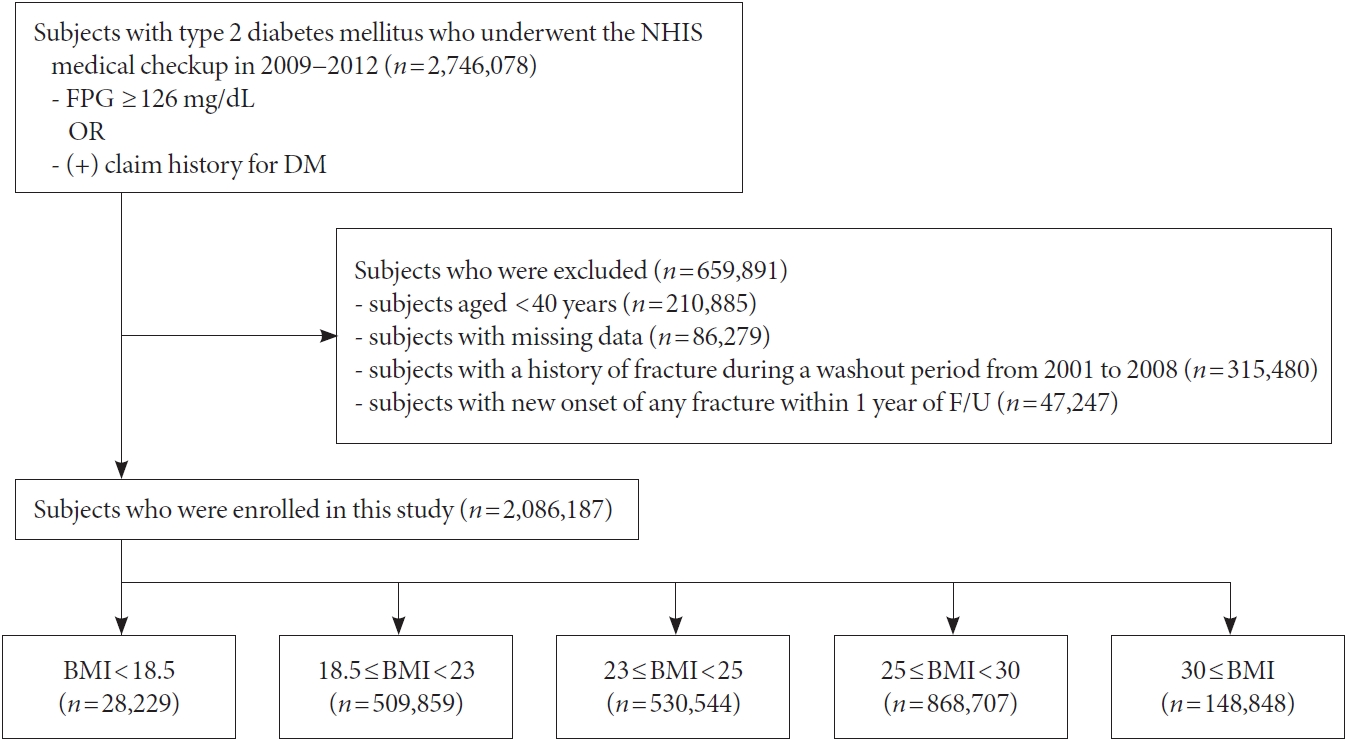
- All subjects who underwent health screenings from January 2009 to December 2012 (n=2,746,078) and conformed to our criteria were defined as T2DM. The date of the NHIS medical checkup during that window was considered as baseline. Subjects younger than 40 years old and subjects with missing data were excluded. Because health information data existed from 2002, subjects with a history of fracture during a washout period from January 2002 to December 2008 were excluded. In addition, those who developed fracture or died within 1 year from the health screening day were excluded. The reason for excluding the 1-year lag is follows. First, if the period from the index date to the occurrence of hip fracture is too short, it is difficult to determine whether it is caused by weight change. Second, problem of reverse causation may also be raised. After all, a total of 2,086,187 participants were included in our study. The cohorts were followed from the day a patient received health screening, to the occurrence of any fracture, or the last follow-up day (December 31, 2018), whichever came first. The mean duration of follow-up was 6.56±1.92 years. Flow chart depicting the design of study cohorts are shown in Fig. 1. This study protocol was reviewed and approved by the Institutional Review Board of Soongsil University (SSU-202003-HR-201- 01), and was conducted in accordance with the tenets of the Helsinki Declaration. Because all data provided by the NHIDSS to researchers were anonymized, he need for informed consent was exempted.
- Data collection
- Information regarding health-related lifestyle (including income level, smoking, drinking, and physical activity), medical history, and clinical tests results are included in the questionnaire obtained during the mandatory health screening. In addition, anthropometric measurements including height, body weight, waist circumference and blood pressure are checked manually by medical staff on duty during the mandatory health screening. Comorbidities were largely defined using a combination of past history (ICD-10 code and self-reported) and use of medication history for the corresponding disease. Hypertension was defined when at least one claim per year under ICD10 codes I10 or I11 and at least one claim per year for the prescription of an antihypertensive agent or systolic/diastolic blood pressure ≥140/90 mm Hg was present. Blood samples for the measurement of serum glucose, total cholesterol, high-density lipoprotein cholesterol, low-density lipoprotein cholesterol levels and triglycerides were collected after fasting overnight. BMI was calculated by dividing the weight (in kg) by the square of the height (in m2). We defined obesity as BMI ≥25 kg/m2. The participants were then classified into the following categories according to The Korean Society for the Study of Obesity recommendations: Underweight (BMI <18.5 kg/m2), normal (≥18.5 to <23 kg/m2), overweight (≥23 to <25 kg/m2), obese (≥25 to 30 kg/m2), and morbidly obese (≥30 kg/m2) [21,22].
- Fracture identification depending on the skeletal lesions
- According to the anatomical location of the fracture, the incidence rate (IR) and hazard ratio (HR) were analyzed by dividing it into four categories: vertebra fracture, hip fracture, limbs fracture, and total fracture. Participants having ICD-10 codes for vertebral fracture (S22.0, S22.1, S32.0, M48.4, and M48.5) and who have visited the hospital more than twice due to same codes were defined as having vertebral fracture. Likewise, those having ICD-10 codes and who have visited the hospital more than twice with fracture of upper arm (S42.0, S42.2, and S42.3), forearm (S52.5 and S52.6), or lower leg (S82.3, S82.5, and S82.6) were classified as having a limb fracture. Because almost all elderly with hip fracture requires either surgical treatment or supportive care via hospital admission, hip fracture was defined as having ICD-10 codes of hip fracture (S72.0 and S72.1) and history of hospitalization due to hip fracture. Finally, total fractures included fractures of vertebra, limbs, hip, and others not listed above (i.e., S02.X for skull fracture, S12. X for neck fracture, S62.X for hand, S92.X for foot) [23].
- Statistical analysis
- Baseline characteristics are presented as mean±standard deviation, median value (interquartile range) or number (%). Difference between groups in baseline demographic and clinical characteristics were compared using analysis of variance (ANOVA) for continuous variables and chi-square test for categorical variables. The incidence of fracture occurrence was calculated by dividing the number of incident cases by the total follow-up duration (person-years). We performed Cox proportional hazard regression, with normal BMI (≥18.5 to <23 kg/m2) as reference category, to evaluate the risk of fractures. In addition, Cox proportional- hazard regression for fracture of vertebral, hip, and limbs were conducted to assess whether the association between BMI and fracture risk differed depending on the affected or fracture lesions. The cox proportional-hazard model was adjusted for potential confounding variables known to predict risk of fracture, which included age, sex, smoke, drink, regular exercise, hypertension, dyslipidemia, chronic kidney disease (CKD), insulin use, diagnosis of T2DM for more than 5 years, use of three or more oral hypoglycemic agents, fasting glucose level, and height. The proportional hazard assumption was checked by visual inspection of stratified –log(–log) survival curves using tertile classification of continuous variables and by the test of Harrel and Lee on Schoenfeld residuals in univariate models [24]. The disease-free probability of primary outcomes related to the BMI was calculated using Kaplan– Meier curves, and log-rank test was performed to analyze the differences between the groups. HRs and 95% confidence intervals (CIs) for fractures were calculated using a Cox proportional hazards model for each category. In addition, the mortality rate as a competing risk was analyzed (Supplementary Table 1). For all statistical analysis, we used SAS version 9.3 (SAS Institute, Cary, NC, USA) with P<0.05 considered as significant.
METHODS
- Characteristics of each group related to the prevalence of obesity and T2DM
- Table 1 shows the characteristics of the study population classified into the five BMI categories. The mean baseline age was 58.6 years, and 60.2% of the sample were men. The proportion of patients with underweight (BMI <18.5 kg/m2) was 1.4% (n=28,229) among a total of 2,086,187 subjects, while the proportion of subjects with obesity (BMI >25 kg/m2) was 48.8%. The percentages of subjects with obesity among ‘obese’ (≥25 to 30 kg/m2) and ‘morbidly obese’ (≥30 kg/m2) patients were 41.6% and 7.1%, respectively. In our data analysis, the lipid profile measurements (total cholesterol, triglyceride, low-density lipoprotein and high-density lipoprotein) worsened and the waist circumference, the prevalence of hypertension, dyslipidemia, and cardiovascular disease increased as BMI level increased. On the other hand, the proportion of current smoker, subjects with cancer, insulin use, use of three or more oral hypoglycemic agents, diabetic duration more than 5 years, and fasting glucose level increased as BMI level decreased. The proportion of male subjects was low only in the ‘morbidly obese’ category, and similar results were seen in the rest of the categories. The proportion of low income level and subjects with CKD increased among diabetic patients with low and high BMI. The proportion of subjects with regular exercise habits decreased among diabetic patients with low and high BMI. Baseline characteristics of subjects are shown in Table 1.
- Associations of BMI with fracture risk
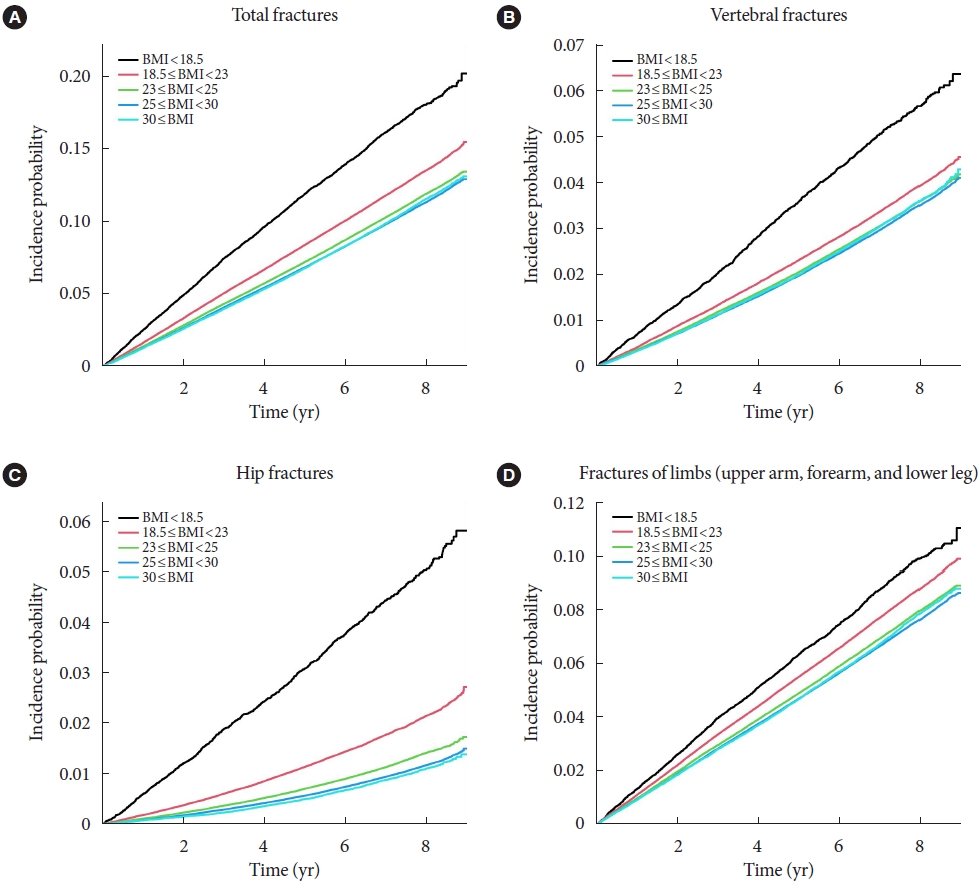
- To analyze the impact of BMI on the incidence of fracture, we divided the population into five groups according to their BMI results. The HR was calculated using subjects with normal BMI range (18.5 to 23 kg/m2) as the reference group (Table 2). We also used the Cox proportional hazard model to analyze the effects of BMI and T2DM on fracture risk. Results of the three models are shown in Table 2. The first model is unadjusted, the second is adjusted for age, sex, smoke, drink, and regular exercise, and the third is adjusted for hypertension, dyslipidemia, CKD, insulin use, duration of DM for more than 5 years, use of three or more oral hypoglycemic agents, fasting glucose level, and height in addition to model 2. As for cox regression, total fractures were significantly higher in the underweight group (adjusted hazard ratio [aHR], 1.268; 95% CI, 1.228 to 1.309) and lower in the obese group (aHR, 0.891; 95% CI, 0.882 to 0.901) and the morbidly obese group (aHR, 0.873; 95% CI, 0.857 to 0.89). In terms of specific fractures, similar trends were observed for vertebra fractures. However, the risk of hip fracture was significantly increased in the ‘underweight’ group (aHR, 1.896; 95% CI, 1.78 to 2.021) and decreased in the ‘obese’ (aHR, 0.643; 95% CI, 0.624 to 0.663) and ‘morbidly obese’ group (aHR, 0.627; 95% CI, 0.591 to 0.665), compared to vertebra fractures or total fractures. Lastly, risk of limb fractures showed a linear relationship with BMI increase (Table 2). The Kaplan–Meier estimations for the incidence probability of the risk of fractures according to BMI category are shown in Fig. 2.
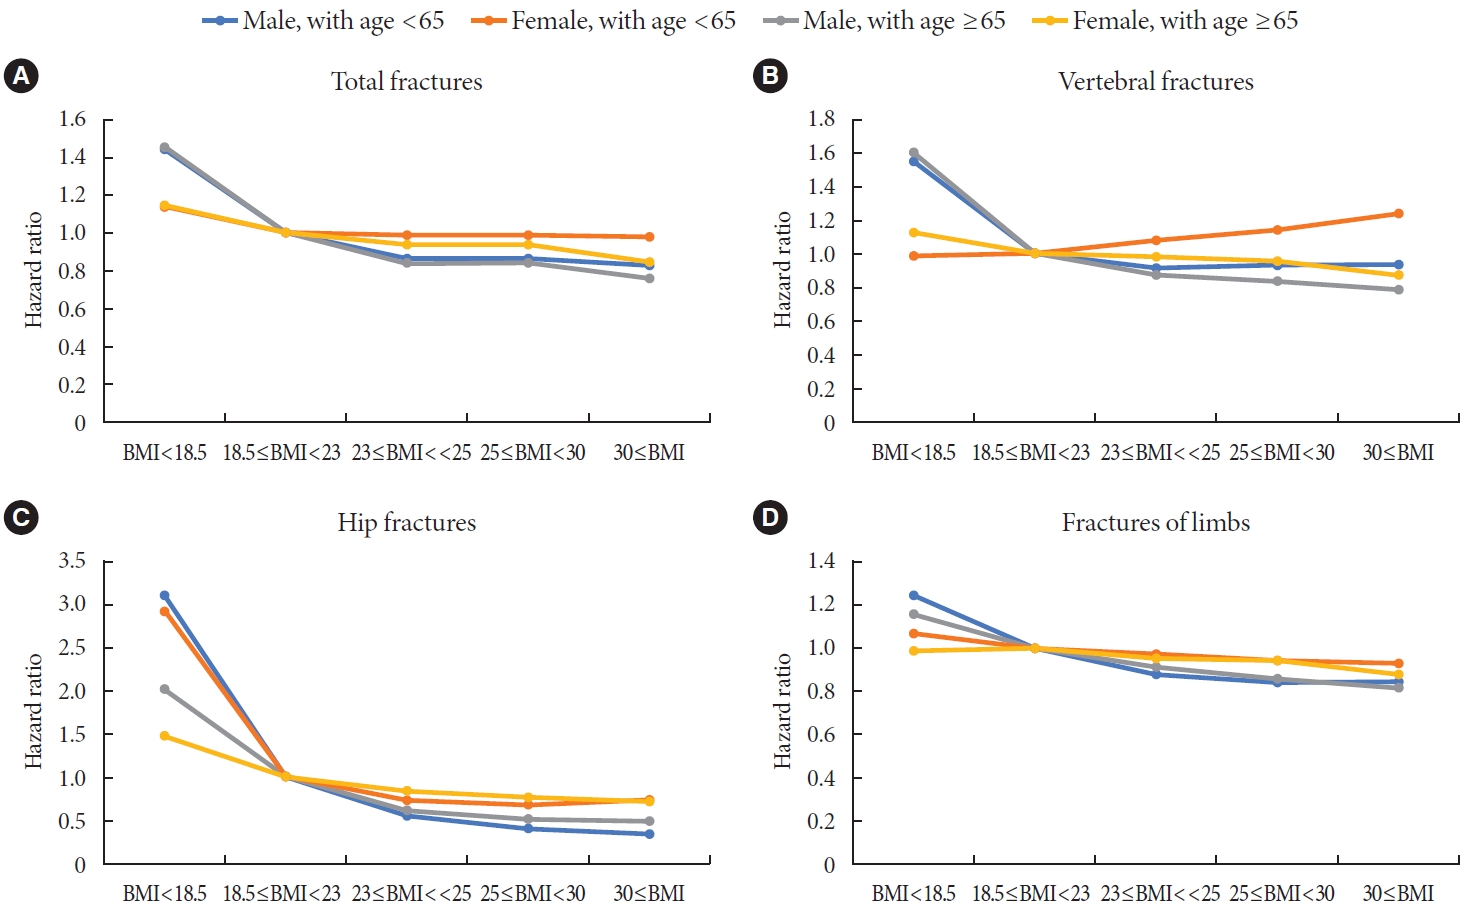
- Subgroup analyses and the fracture risk according to BMI by age and sex
- For subgroup analyses, the subjects were divided into groups by age (40–64 and ≥65 years) and sex. The IRs and HRs of fractures according to affected bone were investigated for each group, and is demonstrated in Table 3. Additional data on P value for interaction with CKD, ischemic heart disease (IHD), duration of DM ≥5 years, use of three or more oral hypoglycemic agents excluding age and sex are shown in the Supplementary Table 2.
- Age and sex affected total fractures, vertebral fractures, hip fractures, and limb fractures; its P value for interaction was 0.0006, <0.0001, <0.0001, 0.0012 for age group (40–64, more than 65), and <0.0001, <0.0001, <0.0001, <0.0001 for sex group, respectively. The presence of IHD and use of three or more oral hypoglycemic agents had no effect on total fractures, vertebral fractures, hip fractures, or fracture limbs; its P value for interaction was 0.4555, 0.9369, 0.4574, 0.1224 for IHD group, and 0.109, 0.8252, 0.9454, 0.2813 for ‘use of three or more oral hypoglycemic agents’ group, respectively. The presence of CKD had an effect on vertebra fracture (P for interaction=0.0053) and hip fracture (P for interaction <0.0001) compared with the cases without CKD, but did not affect total fractures (P for interaction=0.1779) and limb fracture (P for interaction=0.5165). Duration of DM ≥5 years had effect on the incidence of total fractures (P for interaction=0.015), but had little effect on vertebra fracture (P for interaction=0.0708), hip fracture (P for interaction=0.1407), and limb fractures (P for interaction=0.0586).
- Among the for subgroups, male aged <65, female aged <65, male aged ≥65, and female aged ≥65 (Fig. 3), fracture risk according to the affected bone, showed the highest in the underweight group (BMI <18.5 kg/m2), and the higher the BMI was, the lower the fracture risk was. Exceptionally, the risk of fractures tended to increase as BMI increased for vertebra fractures in the female aged <65 group. In subjects of female aged <65, the fully aHRs of total fractures (Model 3) were 1 in the normal group (≥18.5 to <23 kg/m2), 0.984 (95% CI, 0.824 to 1.174) in the underweight group (BMI <18.5 kg/m2), 1.079 (95% CI, 1.028 to 1.132) in the overweight group (≥23 to <25 kg/m2), 1.133 (95% CI, 1.084 to 1.183) in the obese group (≥25 to 30 kg/m2), and 1.232 (95% CI, 1.16 to 1.31) in the morbidly obese group (≥30 kg/m2). In terms of hip fractures, BMI lower than 18.5 kg/m2 significantly increased the risk of hip fracture, regardless of the affected bone. Among them, the HR (3.12; 95% CI, 2.673 to 3.642) was especially increased in the male aged <65 group.
RESULTS
- To the best of our knowledge, this study is the most large-scale nationwide population study to show the association between BMI and fracture risk varied by affected site in T2DM cohort. Low BMI is a both well-established and important risk factor for osteoporosis and osteoporotic fractures in both men and women, whereas high BMI appears to act as a protective factor [25]. In this population-based cohort study of a total of 2,086,187 subjects >40 years of age with diagnosis of T2DM, we described that there is a reverse J-shaped association between BMI and fracture risk. In the reverse J shape curve, in terms of amplitude, hip fracture was the largest, followed by vertebra, all, and limb fractures. In this T2DM cohort, the HR for hip fractures was highest in the underweight group (HR, 1.896; 95% CI, 1.178 to 2.021).
- De Laet et al. [25] conducted a meta-analysis study comprising nearly 60,000 men and women from 12 cohorts of both Asian and Western participants. The study showed that low BMI was a significant risk factor for all types of fractures in both Asian and Western populations. Also, the authors reported that there were only 83 diabetes patients with hip fractures in their study, of which only six individuals had low BMI (BMI <18.5) [25]. Thus, the authors concluded that the result was not significant. Nonetheless, because a sufficiently large number of subjects were included in our diabetic cohort study, the event number of hip fractures, vertebra fractures, and limbs fractures at low BMI (BMI <18.5) were large enough for statistical analysis.
- In addition to considering low BMI as a risk factor for fractures, the effect of high BMI scores on fracture risk has also been discussed recently. Some reports in the previous literature have shown that obesity or morbid obesity has a protective effect on the risk of hip fracture [26,27]. Sogaard et al. [28] stated that the risk of hip fracture decreased with increasing BMI. Johansson et al. [26] also analyzed over 300,000 women from more than 25 countries and found that 87% of hip fractures occurred in those without obesity (defined as BMI ≥30 kg/m2). The same results were seen in this study; higher BMI was protective against fracture risk regardless of affected site. However, in terms of amplitude, hip fracture was the largest, followed by vertebra, all, and limb fracture. Some articles stated that obesity acts as a protective effect on fractures due to consequent higher BMD and reduced impact of falls as a result of increased soft-tissue padding [27-29].
- Some interesting results were seen in the subgroup analyses. According to the subgroup analysis by age, in the group younger than 65 years old, there was a higher HR for fracture risk among subjects who were underweight (BMI <18.5), compared with the group older than 65 years old (Supplementary Table 2). This tendency was evident in hip fracture, followed by vertebra fracture, then total fracture. This tendency was least evident in limbs fracture. Limited to hip fractures, it is known that the risk of hip fractures in the younger age group is higher than in the older age group [10,19,30]. Our study showed that although the amplitude was relatively smaller, total fractures and vertebral fractures showed similar trends to hip fractures. Some authors stated that the difference of the risk of hip fractures between young and old age groups comes from age- or menopause-related changes which overshadow the effect of diabetes itself on fracture risk [31]. We presume that the reason may be similar not only for hip fractures, but also for vertebra fractures and total fractures.
- A subgroup analysis by sex showed that the risk of fractures in underweight (BMI <18.5) subjects was higher in men than in women (Supplementary Table 2). This trend appeared in the order of hip fractures, vertebra fractures, and total fractures, and the least in limb fractures. However, in the case of vertebral and total fractures as well as hip fractures, the effect on fracture risk due to low BMI was significantly higher in men than in women, which is a contrary result to the previous literature [10]. One possible reason for the disparity in fracture risk by sex is that men have larger bones and less adipose tissue than women [32]. Since the weight of bone remains relatively constant compared to muscle or fat tissue, the effect of low BMI on fracture risk may be more significant in males. Additionally, previous reports have shown that underweight men lose more muscle mass than women, which increases mechanical stress on the bones [33]. For instance, male subjects with low BMI would be more prone to have sarcopenia, which is related to physical disability and consequent incident falls [34]. Conversely, the increase in fracture risk was greater in females than in males when overweight, obese or morbidly obese. Similarly, since bone occupies a low proportion of body weight in females, the proportion of adipose tissue and muscle is relatively high, so higher proportion of adipose tissue in female can be estimated that the increase in fracture risk in overweight, obese or morbidly obese is greater in females than in males. One meta-analysis study demonstrated that abdominal obesity itself was associated with an increased risk of hip fracture [35].
- In addition, among the four age-sex categories (male ≥65 years old, female ≥65 years old, male <65 years old, and female <65 years old), the HR for fracture risk was highest in the category of male <65 years old, followed by female <65 years old (Fig. 3). Judging from these results, among age and sex, the effect of BMI on fracture risk has greater interaction with age than with sex.
- Our study has several notable strengths. It has a large sample size of >2,000,000 subjects and a long follow-up period of >6 years. Various subgroup analyses were possible using this large group of data, which provided interesting conclusions. The analyses were performed after adjusting for substantial confounding variables, including age, sex, smoke, drink, regular exercise, hypertension, dyslipidemia, CKD, insulin use, duration of DM for more than 5 years, use of three or more oral hypoglycemic agents, fasting glucose level, and height, which may cause BMI changes. Because the Korean population is a single ethnic society, it was possible to involve a homogeneous group in a nationwide study.
- Despite these advantages, our study also has limitations. First, because data was extracted solely from the NHIS for analysis, not all health behaviors and other factors were included in the analysis, such as eating habits, body composition/muscle mass, muscle function/sarcopenia, and history of falls. In addition, osteopenia, osteoporosis, and bone mineral density are all important risk factors of fracture, but were not included in the analysis. Second, there may be reverse causation in our results because of the retrospective cohort design. However, washout period was considered to address this issue when study outcomes were assessed. Thus, subjects with a history of fracture during the washout period from January 2002 to December 2008 were excluded. Third, because the analytic sample was limited to Korean individuals, additional studies in other ethnic groups are required to generalize our results. Fourth, by using only the NHIS claim database to search for fractures, without reviewing medical and radiologic records, traumatic fractures may have been included in our analyses. The concept of major osteoporotic fracture was not used and that fractures were divided according to anatomical location. Major osteoporotic fracture refers to hip fracture, vertebra fracture, and forearm and humerus fracture, and represents osteoporotic fracture. Although limbs fractures include fractures of the humerus and forearm, limbs fracture is not often analyzed as a clinical outcome. The fact that limbs fractures in this article show less prominent results compared to other sites can also be presumed to have such an effect. Fifth, there may be a misclassification bias. In concern of exclusion of insulindependent T1DM, we did not use the ICD-10 code E10 representing T1DM as an exclusion criterion. However, there is a possibility that subjects with T1DM still may have been enrolled in our study. Fortunately, East Asian countries, including the Republic of Korea, have the lowest incidence of T1DM in the world [36]. The prevalence of T1DM in the entire population of the Republic of Korea was reported to be from 0.017% to 0.021% [37]. The majority of diabetes is T2DM, and the proportion increases with age. We excluded subjects younger than 40 years in this study. Consequently, the possibility of inclusion of T1DM is minimal and was regarded insignificant.
- In conclusion, we further demonstrated that fracture risk differed depending on the skeletal sites. For the hip, the risk of fracture was most pronounced in the underweight group, with a slight increase in the risk in obese patients as well. The fracture risk of vertebra also showed a similar trend to that of the hip, but the amplitude was relatively smaller. For vertebra fractures, the increase in fracture risk in the underweight group was the second highest following hip fractures, and the decrease in fracture risk in obese or morbidly obese subjects was also the second highest following hip. For limbs, fracture risk was least affected by BMI, showing a linear relationship.
DISCUSSION
SUPPLEMENTARY MATERIALS
Supplementary Table 1.
Supplementary Table 2.
-
CONFLICTS OF INTEREST
No potential conflict of interest relevant to this article was reported.
-
AUTHOR CONTRIBUTIONS
Conception or design: S.W.L., K.H., H.S.K.
Acquisition, analysis, or interpretation of data: S.W.L., K.H., H.S.K.
Drafting the work or revising: S.W.L., H.S.K.
Final approval of the manuscript: S.W.L., K.H., H.S.K.
-
FUNDING
This work was supported by the National Research Foundation of Korea (NRF) grant funded by the Korea government (MSIT) (No. 2021R1A2C2013890).
NOTES
-
Acknowledgements
- None


| Characteristic | BMI <18.5 kg/m2 | 18.5≤ BMI <23 kg/m2 | 23≤ BMI <25 kg/m2 | 25≤ BMI <30 kg/m2 | 30 kg/m2 ≤BMI | P value |
|---|---|---|---|---|---|---|
| Number | 28,229 | 509,859 | 530,544 | 868,707 | 148,848 | |
| Age, yr | 62.09±12.3 | 59.67±10.78 | 59.01±10.23 | 58.03±10.2 | 55.96±10.37 | <0.0001 |
| 40–64 | 16,058 (56.88) | 338,673 (66.42) | 368,290 (69.42) | 629,148 (72.42) | 115,704 (77.73) | <0.0001 |
| ≥65 | 12,171 (43.12) | 171,186 (33.58) | 162,254 (30.58) | 239,559 (27.58) | 33,144 (22.27) | |
| Male sex | 17,210 (60.97) | 304,295 (59.68) | 334,282 (63.01) | 531,476 (61.18) | 67,657 (45.45) | <0.0001 |
| BMI, kg/m² | 17.45±0.93 | 21.43±1.13 | 23.97±0.57 | 26.89±1.33 | 32.17±6.09 | <0.0001 |
| Height, cm | 161.23±8.99 | 161.9±8.68 | 162.55±8.78 | 162.51±9.05 | 160.73±9.67 | <0.0001 |
| Body weight, kg | 45.51±5.67 | 56.34±6.79 | 63.54±7.01 | 71.21±8.55 | 83.28±11.07 | <0.0001 |
| Waist circumference, cm | 70.19±7.61 | 78.15±6.27 | 83.54±5.98 | 89.2±6.24 | 98.45±7.83 | <0.0001 |
| Low income | 7,639 (27.06) | 122,502 (24.03) | 121,345 (22.87) | 197,752 (22.76) | 36,280 (24.37) | <0.0001 |
| Current smoker | 9,820 (34.79) | 139,604 (27.38) | 130,901 (24.67) | 197,042 (22.68) | 28,173 (18.93) | <0.0001 |
| Heavy drinker | 2,600 (9.21) | 45,316 (8.89) | 49,937 (9.41) | 89,985 (10.36) | 13,616 (9.15) | <0.0001 |
| Physical activity | 4,639 (16.43) | 112,193 (22) | 121,503 (22.9) | 186,105 (21.42) | 25,595 (17.2) | <0.0001 |
| Hypertension | 11,423 (40.47) | 244,545 (47.96) | 295,440 (55.69) | 556,031 (64.01) | 111,842 (75.14) | <0.0001 |
| Dyslipidemia | 6,688 (23.69) | 182,595 (35.81) | 224,006 (42.22) | 405,561 (46.69) | 77,205 (51.87) | <0.0001 |
| Cancer | 1,194 (4.23) | 14,623 (2.87) | 12,135 (2.29) | 17,799 (2.05) | 2,871 (1.93) | <0.0001 |
| Chronic kidney disease | 3,445 (12.2) | 57,084 (11.2) | 60,285 (11.36) | 101,953 (11.74) | 18,230 (12.25) | <0.0001 |
| Cardiovascular disease | 2,728 (9.66) | 53,985 (10.59) | 62,772 (11.83) | 111,034 (12.78) | 20,882 (14.03) | <0.0001 |
| Insulin use | 4,421 (15.66) | 56,338 (11.05) | 47,772 (9) | 70,239 (8.09) | 12,141 (8.16) | <0.0001 |
| Use of three or more oral hypoglycemic agents | 4,700 (16.65) | 84,861 (16.64) | 80,695 (15.21) | 123,495 (14.22) | 22,173 (14.9) | <0.0001 |
| Duration of DM ≥5 years | 9,205 (32.61) | 183,415 (35.97) | 176,795 (33.32) | 252,666 (29.09) | 38,126 (25.61) | <0.0001 |
| Systolic BP, mm Hg | 122.99±17.6 | 126.35±16.19 | 128.63±15.59 | 130.7±15.42 | 133.61±15.92 | <0.0001 |
| Diastolic BP, mm Hg | 75.62±10.95 | 77.08±10.19 | 78.58±10.01 | 80.19±10.1 | 82.36±10.54 | <0.0001 |
| Fasting glucose, mg/dL | 153.75±67.6 | 146.7±51.7 | 144.2±45.82 | 142.98±42.78 | 143.4±42.73 | <0.0001 |
| Total cholesterol | 184.72±45.72 | 192.44±44.79 | 196.34±46.67 | 198.8±46.32 | 201.05±45.57 | <0.0001 |
| HDL-cholesterol, mg/dL | 59.06±30.67 | 54.6±30.55 | 51.9±26.64 | 50.8±29.38 | 50.8±27.76 | <0.0001 |
| LDL-cholesterol, mg/dL | 103.47±76.46 | 110.79±76.82 | 112.93±75.88 | 113.55±79.32 | 114.96±78.4 | <0.0001 |
| Triglyceride, mg/dLa | 103.04 (102.38–103.71) | 124.31 (124.11–124.5) | 144.28 (144.07–144.5) | 158.7 (158.52–158.89) | 164.75 (164.31–165.19) | <0.0001 |
Model 1: unadjusted; Model 2: adjusted for age, sex, smoke, drink, regular exercise; Model 3, adjusted for model 2 plus hypertension, dyslipidemia, chronic kidney disease, insulin use, duration of diabetes mellitus ≥5 years, use of three or more oral hypoglycemic agents, fasting glucose level, and height.
BMI, body mass index; IR, incidence rate; HR, hazard ratio; CI, confidence interval.
Adjusted for age, sex, smoke, drink, regular exercise, hypertension, dyslipidemia, chronic kidney disease, insulin use, duration of diabetes mellitus ≥5 years, combinations ≥3 classes of oral antidiabetic agent, fasting glucose level, and height.
BMI, body mass index; IR, incidence rate; HR, hazard ratio.
- 1. NCD Risk Factor Collaboration (NCD-RisC). Worldwide trends in diabetes since 1980: a pooled analysis of 751 population-based studies with 4.4 million participants. Lancet 2016;387:1513-30.PubMedPMC
- 2. World Health Organization: Global report on diabetes: executive summary. Available from: https://apps.who.int/iris/handle/10665/204874 (cited 2020 Jul 7).
- 3. Ogurtsova K, da Rocha Fernandes JD, Huang Y, Linnenkamp U, Guariguata L, Cho NH, et al. IDF diabetes atlas: global estimates for the prevalence of diabetes for 2015 and 2040. Diabetes Res Clin Pract 2017;128:40-50.ArticlePubMed
- 4. Lee JW, Kang HT, Lim HJ, Park B. Trends in diabetes prevalence among Korean adults based on Korean National Health and Nutrition Examination Surveys III-VI. Diabetes Res Clin Pract 2018;138:57-65.ArticlePubMed
- 5. Chen C, Chen Q, Nie B, Zhang H, Zhai H, Zhao L, et al. Trends in bone mineral density, osteoporosis, and osteopenia among U.S. adults with prediabetes, 2005-2014. Diabetes Care 2020;43:1008-15.ArticlePubMedPDF
- 6. de Liefde II, van der Klift M, de Laet CE, van Daele PL, Hofman A, Pols HA. Bone mineral density and fracture risk in type-2 diabetes mellitus: the Rotterdam Study. Osteoporos Int 2005;16:1713-20.ArticlePubMedPDF
- 7. Fan Y, Wei F, Lang Y, Liu Y. Diabetes mellitus and risk of hip fractures: a meta-analysis. Osteoporos Int 2016;27:219-28.ArticlePubMedPDF
- 8. Ivers RQ, Cumming RG, Mitchell P, Peduto AJ; Blue Mountains Eye Study. Diabetes and risk of fracture: the Blue Mountains Eye Study. Diabetes Care 2001;24:1198-203.PubMed
- 9. Ottenbacher KJ, Ostir GV, Peek MK, Goodwin JS, Markides KS. Diabetes mellitus as a risk factor for hip fracture in Mexican American older adults. J Gerontol A Biol Sci Med Sci 2002;57:M648-53.ArticlePubMed
- 10. Park HY, Han K, Kim Y, Kim YH, Sur YJ. The risk of hip fractures in individuals over 50 years old with prediabetes and type 2 diabetes: a longitudinal nationwide population-based study. Bone 2021;142:115691.ArticlePubMed
- 11. Oei L, Zillikens MC, Dehghan A, Buitendijk GH, Castano-Betancourt MC, Estrada K, et al. High bone mineral density and fracture risk in type 2 diabetes as skeletal complications of inadequate glucose control: the Rotterdam Study. Diabetes Care 2013;36:1619-28.PubMedPMC
- 12. Schwartz AV, Ewing SK, Porzig AM, McCulloch CE, Resnick HE, Hillier TA, et al. Diabetes and change in bone mineral density at the hip, calcaneus, spine, and radius in older women. Front Endocrinol (Lausanne) 2013;4:62.ArticlePubMedPMC
- 13. Khalil N, Sutton-Tyrrell K, Strotmeyer ES, Greendale GA, Vuga M, Selzer F, et al. Menopausal bone changes and incident fractures in diabetic women: a cohort study. Osteoporos Int 2011;22:1367-76.ArticlePubMedPMCPDF
- 14. Shu A, Yin MT, Stein E, Cremers S, Dworakowski E, Ives R, et al. Bone structure and turnover in type 2 diabetes mellitus. Osteoporos Int 2012;23:635-41.ArticlePubMedPMCPDF
- 15. World Health Organization: Health topics: body mass index–BMI. Available from: http://www.euro.who.int/en/health-topics/disease-prevention/nutrition/a-healthy-lifestyle/body-massindex-bmi (cited 2022 Jul 7).
- 16. Field AE, Coakley EH, Must A, Spadano JL, Laird N, Dietz WH, et al. Impact of overweight on the risk of developing common chronic diseases during a 10-year period. Arch Intern Med 2001;161:1581-6.ArticlePubMed
- 17. Mokdad AH, Ford ES, Bowman BA, Dietz WH, Vinicor F, Bales VS, et al. Prevalence of obesity, diabetes, and obesity-related health risk factors, 2001. JAMA 2003;289:76-9.ArticlePubMed
- 18. Koh WP, Wang R, Ang LW, Heng D, Yuan JM, Yu MC. Diabetes and risk of hip fracture in the Singapore Chinese Health Study. Diabetes Care 2010;33:1766-70.ArticlePubMedPMCPDF
- 19. Chen HF, Ho CA, Li CY. Increased risks of hip fracture in diabetic patients of Taiwan: a population-based study. Diabetes Care 2008;31:75-80.PubMed
- 20. Lee JH, Han JH, Han KD, Park YM, Lee JY, Park YG, et al. Psoriasis risk in patients with diabetic retinopathy: a nationwide population-based study. Sci Rep 2018;8:9086.ArticlePubMedPMCPDF
- 21. WHO Expert Consultation. Appropriate body-mass index for Asian populations and its implications for policy and intervention strategies. Lancet 2004;363:157-63.ArticlePubMed
- 22. Obesity: preventing and managing the global epidemic. Report of a WHO consultation. World Health Organ Tech Rep Ser 2000;894:i-xii. 1-253.PubMed
- 23. Wang SM, Han KD, Kim NY, Um YH, Kang DW, Na HR, et al. Association of alcohol intake and fracture risk in elderly varied by affected bones: a nationwide longitudinal study. Psychiatry Investig 2020;17:1013-20.ArticlePubMedPMCPDF
- 24. Kleinbaum DG, Klein M. Survival analysis. 2nd ed. New York: Springer Publishers; 2005.
- 25. De Laet C, Kanis JA, Oden A, Johanson H, Johnell O, Delmas P, et al. Body mass index as a predictor of fracture risk: a metaanalysis. Osteoporos Int 2005;16:1330-8.ArticlePubMedPDF
- 26. Johansson H, Kanis JA, Oden A, McCloskey E, Chapurlat RD, Christiansen C, et al. A meta-analysis of the association of fracture risk and body mass index in women. J Bone Miner Res 2014;29:223-33.ArticlePubMed
- 27. Huang HL, Pan CC, Hsiao YF, Chen MC, Kung CY, Kung PT, et al. Associations of body mass index and diabetes with hip fracture risk: a nationwide cohort study. BMC Public Health 2018;18:1325.ArticlePubMedPMCPDF
- 28. Sogaard AJ, Holvik K, Omsland TK, Tell GS, Dahl C, Schei B, et al. Abdominal obesity increases the risk of hip fracture. A population-based study of 43,000 women and men aged 60-79 years followed for 8 years. Cohort of Norway. J Intern Med 2015;277:306-17.ArticlePubMedPDF
- 29. Lee SW, Han K, Kwon HS. Weight change and the risk of hip fractures in patients with type 2 diabetes: a nationwide cohort study. Osteoporos Int 2022;33:1755-67.Article
- 30. Vilaca T, Schini M, Harnan S, Sutton A, Poku E, Allen IE, et al. The risk of hip and non-vertebral fractures in type 1 and type 2 diabetes: a systematic review and meta-analysis update. Bone 2020;137:115457.ArticlePubMed
- 31. Valderrabano RJ, Linares MI. Diabetes mellitus and bone health: epidemiology, etiology and implications for fracture risk stratification. Clin Diabetes Endocrinol 2018;4:9.ArticlePubMedPMCPDF
- 32. Nieves JW, Formica C, Ruffing J, Zion M, Garrett P, Lindsay R, et al. Males have larger skeletal size and bone mass than females, despite comparable body size. J Bone Miner Res 2005;20:529-35.ArticlePubMed
- 33. Pocock N, Eisman J, Gwinn T, Sambrook P, Kelly P, Freund J, et al. Muscle strength, physical fitness, and weight but not age predict femoral neck bone mass. J Bone Miner Res 1989;4:441-8.ArticlePubMed
- 34. Schwartz AV, Hillier TA, Sellmeyer DE, Resnick HE, Gregg E, Ensrud KE, et al. Older women with diabetes have a higher risk of falls: a prospective study. Diabetes Care 2002;25:1749-54.PubMed
- 35. Li X, Gong X, Jiang W. Abdominal obesity and risk of hip fracture: a meta-analysis of prospective studies. Osteoporos Int 2017;28:2747-57.ArticlePubMedPDF
- 36. Lee YB, Han K, Kim B, Lee SE, Jun JE, Ahn J, et al. Risk of early mortality and cardiovascular disease in type 1 diabetes: a comparison with type 2 diabetes, a nationwide study. Cardiovasc Diabetol 2019;18:157.ArticlePubMedPMCPDF
- 37. Song SO, Song YD, Nam JY, Park KH, Yoon JH, Son KM, et al. Epidemiology of type 1 diabetes mellitus in Korea through an investigation of the National Registration Project of Type 1 Diabetes for the Reimbursement of Glucometer Strips with Additional Analyses Using Claims Data. Diabetes Metab J 2016;40:35-45.ArticlePubMedPMCPDF
REFERENCES
Figure & Data
References
Citations
- Dysuricemia—A New Concept Encompassing Hyperuricemia and Hypouricemia
Naoyuki Otani, Motoshi Ouchi, Einosuke Mizuta, Asuka Morita, Tomoe Fujita, Naohiko Anzai, Ichiro Hisatome
Biomedicines.2023; 11(5): 1255. CrossRef - Association of Body Mass Index and Fracture Risk Varied by Affected Bones in Patients with Diabetes: A Nationwide Cohort Study (Diabetes Metab J 2023;47:242-54)
Se-Won Lee, Kyungdo Han, Hyuk-Sang Kwon
Diabetes & Metabolism Journal.2023; 47(3): 439. CrossRef - Association of Body Mass Index and Fracture Risk Varied by Affected Bones in Patients with Diabetes: A Nationwide Cohort Study (Diabetes Metab J 2023;47:242-54)
So Young Park
Diabetes & Metabolism Journal.2023; 47(3): 437. CrossRef - Effect of SGLT2 inhibitors on fractures, BMD, and bone metabolism markers in patients with type 2 diabetes mellitus: a systematic review and meta-analysis
Xin Wang, Fengyi Zhang, Yufeng Zhang, Jiayi Zhang, Yingli Sheng, Wenbo Wang, Yujie Li
Osteoporosis International.2023; 34(12): 2013. CrossRef
 PubReader
 ePub Link
 Cite
Cite- Figure
-

- Related articles
-
- Association of Body Mass Index and Fracture Risk Varied by Affected Bones in Patients with Diabetes: A Nationwide Cohort Study (Diabetes Metab J 2023;47:242-54)
- Association of Body Mass Index and Fracture Risk Varied by Affected Bones in Patients with Diabetes: A Nationwide Cohort Study (Diabetes Metab J 2023;47:242-54)
- Association between Low-Density Lipoprotein Cholesterol Level and Cardiovascular Outcomes in Korean Adults: A Nationwide Cohort Study
- Fasting Glucose Variability and the Risk of Dementia in Individuals with Diabetes: A Nationwide Cohort Study
- Association between Metabolic Syndrome and Microvascular Complications in Chinese Adults with Type 1 Diabetes Mellitus


