- Current
- Browse
- Collections
-
For contributors
- For Authors
- Instructions to authors
- Article processing charge
- e-submission
- For Reviewers
- Instructions for reviewers
- How to become a reviewer
- Best reviewers
- For Readers
- Readership
- Subscription
- Permission guidelines
- About
- Editorial policy
Articles
- Page Path
- HOME > Diabetes Metab J > Volume 46(3); 2022 > Article
-
ReviewGuideline/Fact Sheet Comprehensive Understanding for Application in Korean Patients with Type 2 Diabetes Mellitus of the Consensus Statement on Carbohydrate-Restricted Diets by Korean Diabetes Association, Korean Society for the Study of Obesity, and Korean Society of Hypertension
-
Jong Han Choi1
 , Jee-Hyun Kang2, Suk Chon3
 -
Diabetes & Metabolism Journal 2022;46(3):377-390.
DOI: https://doi.org/10.4093/dmj.2022.0051
Published online: May 25, 2022
1Division of Endocrinology and Metabolism, Department of Internal Medicine, Konkuk University Medical Center, Konkuk University School of Medicine, Seoul, Korea
2Department of Family Medicine, Konyang University College of Medicine, Daejeon, Korea
3Department of Endocrinology and Metabolism, College of Medicine, Kyung Hee University, Seoul, Korea
-
Corresponding authors: Jee-Hyun Kang Department of Family Medicine, Konyang University College of Medicine, 158 Gwanjeodong-ro, Seo-gu, Daejeon 35365, Korea E-mail: jeehyunkang@yahoo.co.kr
-
Suk Chon Department of Endocrinology and Metabolism, Kyung Hee University College of Medicine, 26 Kyungheedae-ro, Dongdaemun-gu, Seoul 02447, Korea E-mail: imdrjs@khu.ac.kr
Copyright © 2022 Korean Diabetes Association
This is an Open Access article distributed under the terms of the Creative Commons Attribution Non-Commercial License (http://creativecommons.org/licenses/by-nc/4.0/) which permits unrestricted non-commercial use, distribution, and reproduction in any medium, provided the original work is properly cited.
ABSTRACT
- The Joint Committee of the Korean Diabetes Association, the Korean Society for the Study of Obesity, and the Korean Society of Hypertension announced a consensus statement on carbohydrate-restricted diets and intermittent fasting, representing an emerging and popular dietary pattern. In this statement, we recommend moderately-low-carbohydrate or low-carbohydrate diets, not a very-low-carbohydrate diet, for patients with type 2 diabetes mellitus. These diets can be considered a dietary regimen to improve glycemic control and reduce body weight in adults with type 2 diabetes mellitus. This review provides the detailed results of a meta-analysis and systematic literature review on the potential harms and benefits of carbohydrate-restricted diets in patients with diabetes. We expect that this review will help experts and patients by fostering an in-depth understanding and appropriate application of carbohydrate-restricted diets in the comprehensive management of diabetes.
- • Moderately-low or low carbohydrate diet can be used for improving glycemic control in patients with type 2 diabetes
- • Glucose-lowering effects of carbohydrate-restricted diets may be applied to Koreans
- • Very-low carbohydrate diet has risks of hypoglycemia and increasing low-density lipoprotein cholesterol
- • Very-low carbohydrate diet is recommended to be avoided in patients with type 2 diabetes
Highlights
- Most guidelines for the management of diabetes mellitus recommend reducing body weight by 5% or more by decreasing total energy intake to achieve glycemic control [1,2]. Carbohydrates are a pivotal component of macronutrients, accounting for more than 50% of total energy intake. Many patients with diabetes have a greater interest in feasible carbohydrate-restricted diets than in reducing total energy intake. Accordingly, the American Diabetes Association (ADA) states that carbohydrate- restricted diets can help improve glycemic control and weight loss [2]. However, the Korean Diabetes Association (KDA) recommends individualizing the composition of macronutrients without specific recommendations on carbohydrate restriction [1].
- The Joint Committee of the KDA, the Korean Society for the Study of Obesity (KSSO), and the Korean Society of Hypertension (KSH) has published a consensus statement on carbohydrate-restricted diets and intermittent fasting in adults with obesity, type 2 diabetes mellitus (T2DM), and hypertension [3]. In this statement, we recommend a moderately-low-carbohydrate diet (MCD) or a low-carbohydrate diet (LCD) to improve glycemic control and reduce weight in patients with T2DM [3]. Despite the glucose-lowering and weight loss benefits of a very-low-carbohydrate diet (VLCD), it is strongly recommended to avoid VLCDs due to the risk of hypoglycemia and elevated low-density lipoprotein cholesterol (LDL-C) levels [3].
- Several professionals and patients are concerned about the harms associated with the new recommendations on carbohydrate-restricted diets for patients with T2DM. This review will describe additional information on the meta-analysis and systematic review in detail. It will assist diabetes patients and associated healthcare providers, such as physicians, nurses, dietitians, and nutritionists, in using carbohydrate-restricted diets to manage diabetes.
INTRODUCTION
- For detailed research methods, see “Effect of carbohydrate-restricted diets and intermittent fasting on obesity, type 2 diabetes mellitus, and hypertension management: consensus statement of the Korean Society for the Study of Obesity, Korean Diabetes Association, and Korean Society of Hypertension” published in the same issue of Diabetes and Metabolism Journal [3]. We performed a meta-analysis and systematic review on the key question: “Are carbohydrate-restricted diets helpful in improving glycemic control in patients with diabetes?” Carbohydrate-restricted diets, which are intervention diets, were classified according to the proportion of carbohydrates to total calorie intake: (1) an MCD of 26%–45%; (2) an LCD of 10%–25%; and (3) a VLCD of <10% [2]. However, we evaluated MCD and LCD as one category, abbreviated as moderately-low-carbohydrate or low-carbohydrate diet (mLCD), considering the higher carbohydrate intake among Koreans than those in other countries [4]. The control diet was an isocaloric diet equivalent to the intervention (carbohydrate-restricted) diet. The primary outcome was glycosylated hemoglobin (HbA1c). The secondary outcomes were fasting blood glucose, body weight, body mass index (BMI), systolic blood pressure (SBP), diastolic blood pressure (DBP), triglyceride (TG), high-density lipoprotein cholesterol (HDL-C), LDL-C, homeostatic model assessment for insulin resistance (HOMA-IR), and adverse events.
SUMMARY OF THE META-ANALYSIS METHODS
- Baseline characteristics of the studies included in the analysis
- The baseline characteristics of the included studies and their participants are summarized in Table 1. Eighteen randomized controlled trials were included in the final analysis [5-28]. Four MCD, nine LCD, and five VLCD studies were included in the analysis. Most studies (n=15) included only patients with diabetes (100%) [5-16,19-23,25-27], and two studies had a proportion of patients with diabetes of 65% and 50% among all participants, respectively [24,28]. One study was included because the outcomes could be analyzed only for patients with diabetes [17,18]. Therefore, 1,244 of 1,282 participants (98.0%) were patients with diabetes. The average drop-out rate in mLCD studies was 12.9%, whereas that of VLCD studies was much higher at 34.8%, with no difference between the control and intervention groups. There was no significant difference in sex; men comprised 54.9% of the study population.
- Ten studies were conducted in Western countries (United States, United Kingdom, Australia, and Europe); three, in the Middle East (Bahrain and Israel); and five, in East Asia (China, Japan, and Taiwan); no study included Koreans. The East Asian population comprised only 28.8% of the entire population in this analysis. Therefore, we additionally performed a subgroup analysis of East Asians. The average age was 58.1 years, and several studies had an upper age limit of approximately 70 years as the inclusion criteria [6,7,16-23,25,26]. Therefore, there is a limitation in applying the results of this analysis to patients aged over 70 years. The average body weight was 89.9 kg, and the average BMI was 31.6 kg/m2. Therefore, there may be little or no benefit in analyzing overweight (25≤ BMI <30 kg/m2) or normal body weight (BMI <25 kg/m2) patients.
- The average HbA1c level of participants was 7.6%. Seven of 18 studies excluded patients with a high risk of hypoglycemia [7,11,19-25,27,28]. Conversely, eight of 18 studies had an upper limit of HbA1c in the inclusion criteria to exclude patients with severe hyperglycemia [5-7,10,11,15,25,27]. Therefore, caution is needed to apply carbohydrate-restricted diets to patients with a high risk of hypoglycemia or very high blood glucose. The mean duration of diabetes was 8.1 years. Patients with a long duration of diabetes for over 10 years or severe microvascular complications were excluded in several studies [16,25]. Therefore, it may not be appropriate to apply the results of this analysis to patients with a longer duration of diabetes and severe complications.
- Most of the studies excluded patients with the following medical conditions: malignancies; serious medical conditions, such as cardiovascular, pulmonary, hepatic, renal, gastrointestinal, or pancreatic diseases; psychiatric illness, including eating disorders or substance abuse; and pregnant or lactating women. Hence, the results of our analysis do not apply to these patients.
- Adherence to carbohydrate-restricted diets
- Adherence was assessed mainly through electronic or telephone questionnaires with a 24-hour recall. Our analysis regarding adults who were overweight or obese [3] showed that the adherence rate was 91.7% for MCD (11 out of 12 studies), 37.5% for LCD (six out of 16 studies), and 35.7% for VLCD (five out of 14 studies). Accordingly, adherence is more difficult with greater carbohydrate restriction. Among the studies included in the analysis of patients with diabetes, 75% (3/4) for MCD [6-8] and 25% (2/8) for LCD [9,19-23] achieved the initially planned target range of carbohydrate restriction. None of the VLCD studies reached the targeted carbohydrate reduction. These findings suggest that carbohydrate restriction in patients with diabetes may be more complicated than that in adults without diabetes who are overweight or obese. In a study by Iqbal et al. [27], the carbohydrate intake in the VLCD group decreased up to 6 months but gradually increased after that, and there was no difference compared to the control group by 1 year.
- The beneficial effects of carbohydrate-restricted diets on glycemic control in patients with diabetes
- A summary of the findings for the primary and secondary outcomes of carbohydrate-restricted diets (mLCDs and VLCDs) in patients with diabetes is presented in Tables 2 and 3.
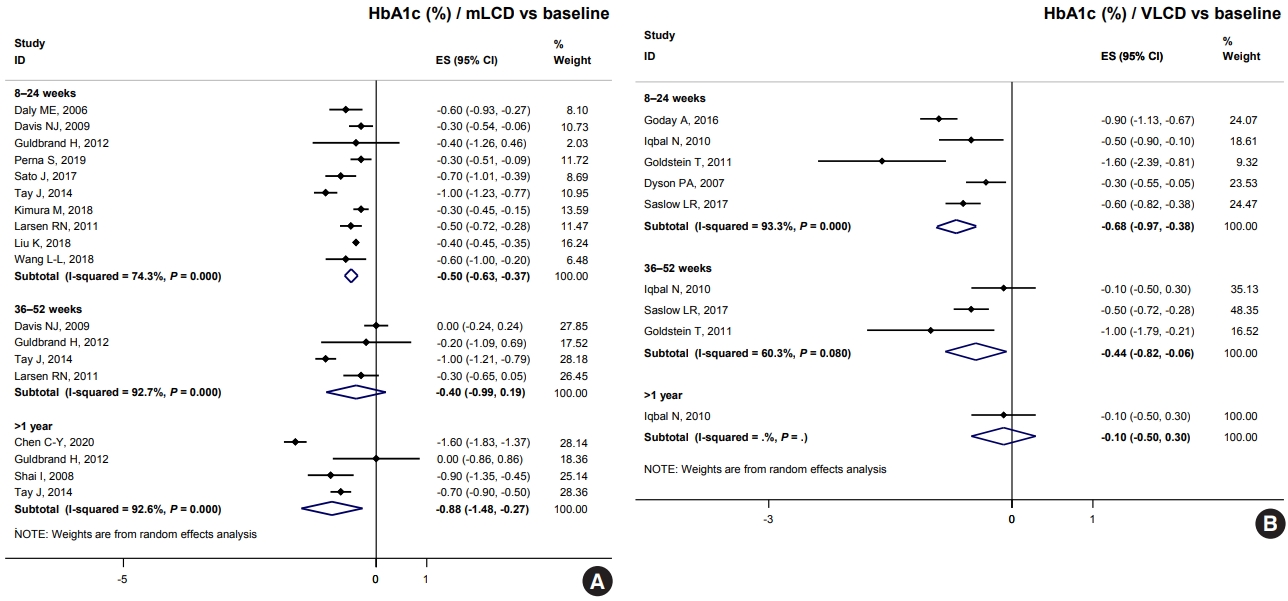
- Both mLCD and VLCD showed an additional HbA1c reduction of 0.21% and 0.36% within 6 months compared to that in the isocaloric control diets, respectively. The control diets in both mLCD and VLCD studies also decreased HbA1c levels by 0.20% within 6 months compared to that before the intervention. As a result, mLCDs and VLCDs showed more significant reductions in HbA1c of 0.50% and 0.68% within 6 months compared to that before the intervention, respectively. These beneficial effects were maintained for over 1 year (Fig. 1). In conclusion, the carbohydrate-restricted diets showed a 0.5% to 0.7% reduction in HbA1c within 6 months; the effects overweigh the 0.2% reduction of the isocaloric diets.
- Table 4 shows the results of total calorie intake and the proportion of macronutrients at each time point in individual studies. Among the studies on mLCD, Chen et al. [9] showed a significant reduction in HbA1c levels (–0.6% in >1 year) compared to other studies. There was no significant difference in the total caloric intake between both groups, but the mLCD group consumed fewer carbohydrates (63.1 g/day) by 18 months than the control group. Sato et al. [16] showed the greatest reduction in HbA1c levels (–0.7% within 6 months) compared to the control group within 6 months. There were additional reductions in both carbohydrate intake (49.0 g/day) and total caloric intake (234.0 kcal/day) in the LCD group compared to those in the control group [16]. However, Kimura et al. [5], Larsen et al. [6], Struik et al. [19], Wycherley et al. [20], Tay et al. [21-23] showed more negligible HbA1c reductions than other studies (–0.1%, 0.0%, and 0.0%, respectively). Among the studies, Kimura et al. [5] and Larsen et al. [6] achieved relatively more minor differences in carbohydrate restriction between the control and intervention groups (–17.9 and –20.7 g/day, respectively). In contrast, in the study by Struik et al. [19], Wycherley et al. [20], Tay et al. [21-23], the mLCD group achieved the greatest carbohydrate restriction of approximately 140 g/day up to 24 months. However, the mLCD group was shown to take at least one tablet fewer of the anti-diabetic drugs than the control group daily. Therefore, it can be interpreted that the mLCD also showed a significant improvement in glycemic control compared to the control diet even in this study.
- Among VLCD studies, investigations by Saslow et al. [28] and Goldstein et al. [26] showed an additional 0.4% and 0.6% reduction in HbA1c within 6 months in the VLCD group due to additional reductions of 116.6 and 103.8 g/day of carbohydrates, respectively. A study by Iqbal et al. [27] did not show a significant reduction in HbA1c at 12 and 24 months (0.2% and 0.1%, respectively) because there was no significant difference in total calorie and carbohydrate intake between both groups. In conclusion, the individual research analysis also suggests that the greater the reduction in total energy and carbohydrates, the greater the benefit of improving glycemic control.
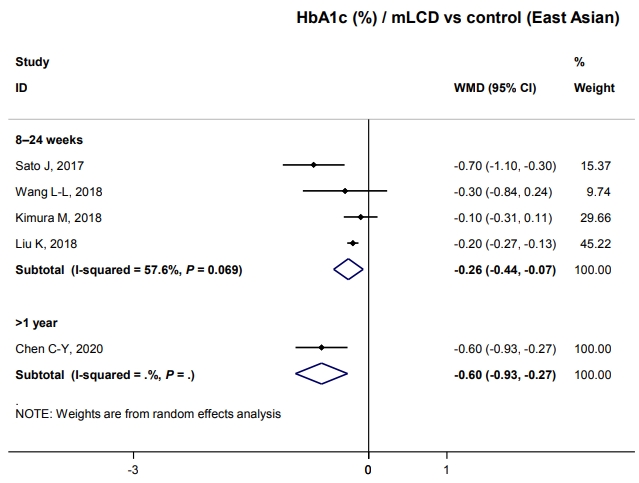
- We investigated whether these results could be applied to Korean patients with diabetes. Unfortunately, no study has been conducted in Korea; therefore, we analyzed five studies conducted in China, Japan, and Taiwan that were of similar demographics as Korea. All studies were included in mLCD: three MCD and two LCD (Table 1). Participants of East Asian countries comprised 28.8% of the total population, with an average body weight of 64.8 kg, BMI of 24.5 kg/m2, duration of diabetes of 7.9 years, and HbA1c of 7.6%. The body weight and BMI were significantly lower than those of all participants, but HbA1c and duration of diabetes were similar (Table 1).
- HbA1c decreased by 0.26% within six months compared to control diets (Fig. 2). Although only one study has shown this, glucose-lowering effects were maintained for over 1 year; there was a –0.6% change in HbA1c (Fig. 2). Therefore, carbohydrate-restricted diets showed an additional benefit on glycemic control compared to control diets, even in patients with diabetes in East Asian countries. This benefit of improving glycemic control can be maintained for a more extended period and is independent of weight loss in East Asian patients with diabetes who are not obese. In conclusion, carbohydrate-restricted diets are expected to have a glucose-lowering effect even in Korean patients with diabetes.
- At baseline, the mean carbohydrate intake proportion of East Asians (China, Japan, and Taiwan) was 52.6%, which was significantly higher than that of the other populations, 42.1% (Table 4). Indeed, the average carbohydrate intake proportions of the Chinese, Japanese, and Taiwanese general populations were approximately 57%, 60%, and 50%, respectively [29-31]. These proportions are significantly lower than the average of 65% for Koreans [4]. It may be much more challenging for Koreans to achieve their carbohydrate-restriction goals in the range of MCD or LCD than for people in other countries. Therefore, studies are needed in the future to confirm the effects in Koreans when reducing the carbohydrate proportion like 45% to 55%, higher than the MCD level.
- Other benefits on body weight, blood pressure, lipid profiles, and insulin resistance
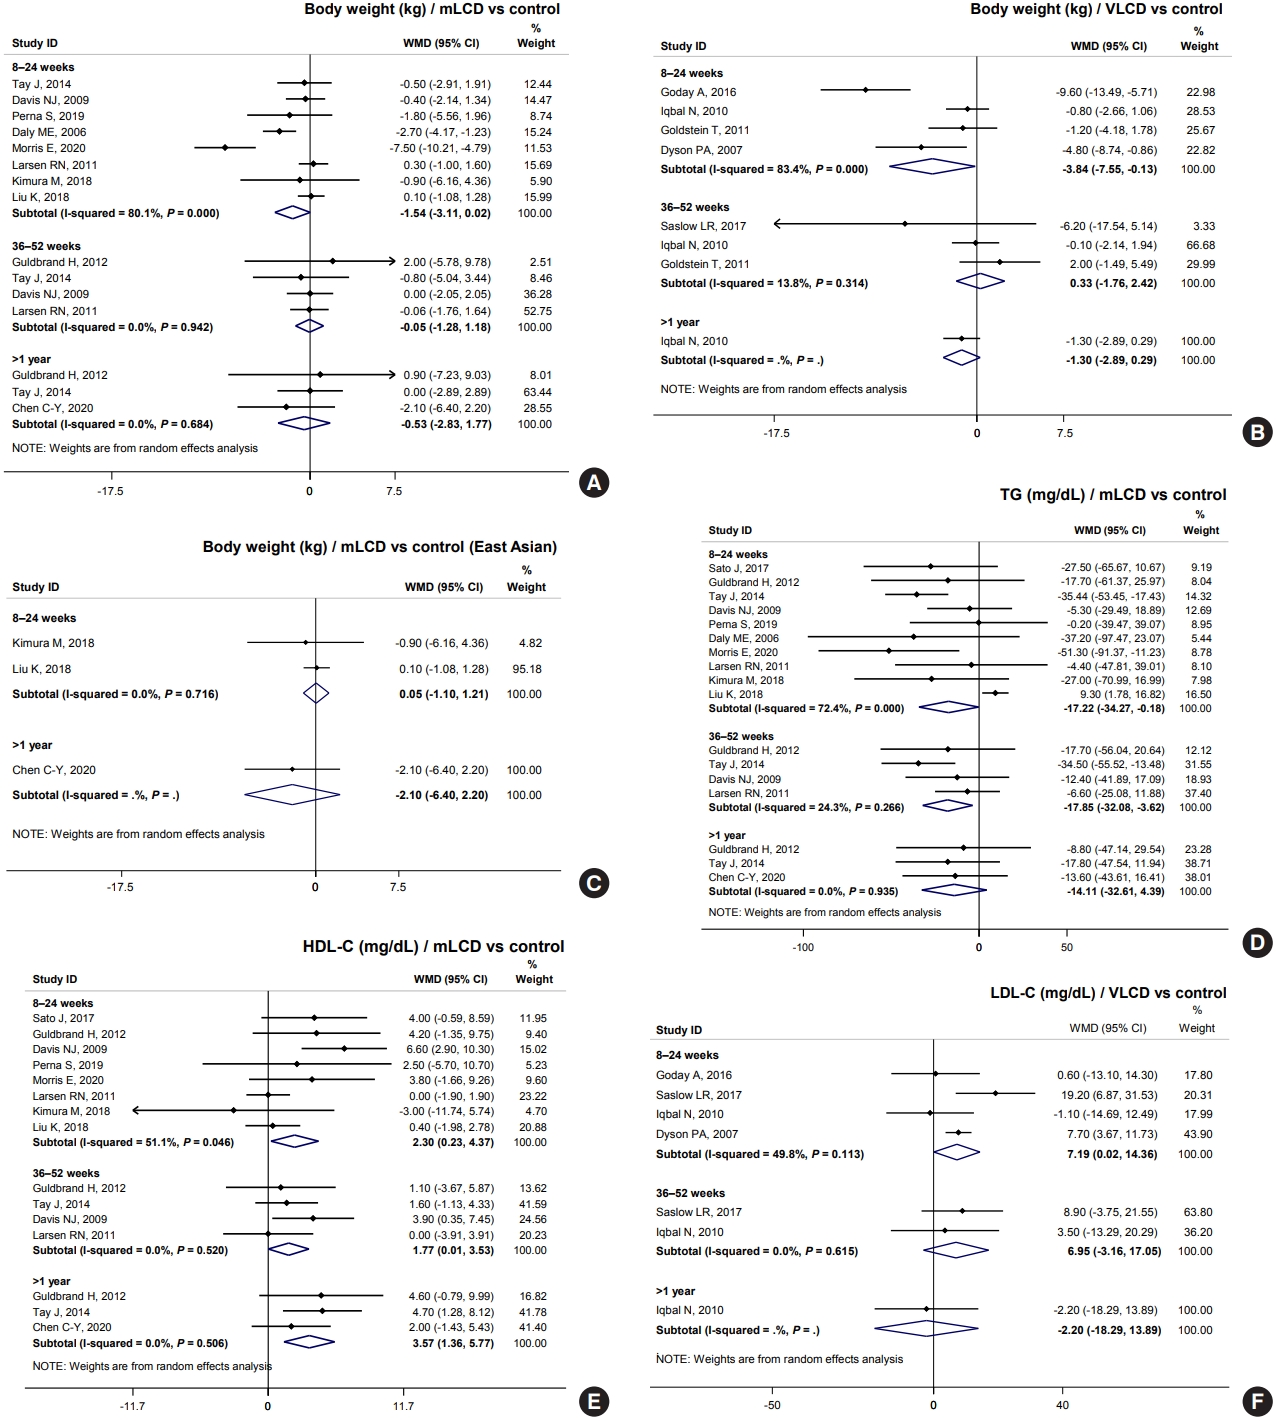
- Results from mLCD in 11 studies demonstrated an additional weight loss of 1.54 kg within 6 months compared to the control diet, although the difference was not statistically significant (Fig. 3A). VLCD (five studies) led to an additional weight loss of 3.84 kg within 6 months (Fig. 3B). However, in the meta-analysis of body weight in East Asian participants who had an average baseline BMI of 24.5 kg/m2, carbohydrate-restricted diets did not show a benefit for weight loss (Fig. 3C). Additionally, three individual studies on patients with diabetes free of obesity showed no effect on weight loss [5,7,8]. In conclusion, mLCDs and VLCDs help patients lose weight within 6 months compared to the control diet in patients with diabetes and obesity.
- Regarding SBP, mLCDs (seven studies) led to an additional reduction of blood pressure by 2.99 mm Hg (95% confidence interval [CI], –5.48 to –0.49) within 6 months, but no benefit was observed with VLCDs (three studies). For DBP, neither diet showed a blood pressure-lowering effect. In conclusion, carbohydrate-restricted diets have no beneficial effects on blood pressure compared with the control diet in patients with diabetes (Tables 2 and 3).
- For TG, mLCDs (11 studies) led to an additional decrease of 17.22 and 17.85 mg/dL within 6 and 12 months, respectively, compared to the control diets (Fig. 3D). Also observed was an increase of 2.30 and 1.77 mg/dL in HDL-C within 6 and 12 months, respectively (Fig. 3E). VLCDs showed a similar trend, yet there was no statistically significant difference; the effect size was smaller than that of mLCDs. In contrast, mLCDs did not lead to an additional LDL-C reduction. Interestingly, VLCDs significantly increased LDL-C to 7.19 mg/dL within 6 months (Fig. 3F). This issue is discussed in detail in the following section. In conclusion, mLCDs have the additional benefits of improving TG and HDL-C within 1 year compared to the control diet. Conversely, the effects of VLCDs on TG and HDL-C are smaller and attended by potential risk of LDL-C elevation.
- HOMA-IR was also analyzed as an outcome variable to evaluate the effect of carbohydrate-restricted diets on insulin resistance. Three studies showed mLCDs leading to a reduction of 0.53 compared to the control diet within 6 months. With VLCDs, the reduction was 1.07, although this difference did not reach statistical significance (Tables 2 and 3). In conclusion, a carbohydrate-restricted diet may improve insulin resistance compared to controls. All results of body weight, blood pressure, lipid profiles, and HOMA-IR were generally consistent with the results of our analysis in adults with obesity [3].
- Potential harms of carbohydrate-restricted diets
- Of the 18 studies, eight mentioned adverse events, with five simply stating that there were “no serious adverse events related to study design.” Two studies reported hypoglycemia, constipation, cancer, and arrhythmias; however, there was no significant difference between both groups [8,19-23]. In a study of VLCDs, headache (control 1/44 vs. VLCDs 9/45) and gastrointestinal problems, such as nausea (control 0/44 vs. VLCDs 9/45), vomiting (control 0/44 vs. VLCD 7/45), and constipation (control 0/44 vs. VLCDs 9/45), were significantly more frequent in the VLCD group within 1 month than in the control group [25]. Fortunately, the side effects were not serious, and most of these side effects improved when reevaluated after four months.
- VLCDs significantly elevated LDL-C (mean difference 7.19 mg/dL) compared to the control diet. These results were consistent with the results of the meta-analysis, as well as studies on adults with obesity (mean difference 7.52 mg/dL; 95% CI, 3.34 to 11.70) [3]. LDL-C is a major risk factor for the development of cardiovascular disease (CVD) and is a therapeutic target for primary and secondary prevention [32]. The result of LDL-C elevation with VLCDs is particularly noteworthy in patients with diabetes who are at high risk of CVD. Therefore, it may be reasonable for such patients to avoid VLCDs. How carbohydrate-restricted diets can increase LDL-C remains unclear. VLCDs had a larger and statistically significant elevation of LDL-C compared to mLCDs. Therefore, an increase in total fat intake depending on the degree of carbohydrate restriction may be associated with an increase in LDL-C.
- Hypoglycemia is a major concern in carbohydrate-restricted diets. The risk of hypoglycemia can increase as carbohydrate restriction increases [33]. Among the studies included in this analysis, three of 13 mLCD studies (23.1%) [7,19-23] and four of five VLCD studies (80%) [24,25,27,28] excluded type 1 diabetes mellitus (T1DM), a history of severe hypoglycemia, and use of drugs with a risk of hypoglycemia, such as insulin and sulfonylureas. Compared to the VLCD adherence achieved in adults with obesity (35.7%), all five studies on VLCDs in diabetic patients fell short of carbohydrate restriction goals. This result may also reflect a potentially higher risk of adverse effects like hypoglycemia in diabetic patients. Therefore, VLCDs should be avoided in patients with diabetes who are at high risk of hypoglycemia. For mLCDs, it may also be necessary to evaluate the risk of hypoglycemia with the attending physician and change medications if needed. Fortunately, recently used antidiabetic drugs, including thiazolidinediones, glucagon-like peptide-1 receptor agonists, dipeptidyl peptidase-4 inhibitors, and sodium-glucose cotransporter-2 inhibitors (SGLT-2i), provide a significantly lower risk of hypoglycemia. Given such a medical environment, carbohydrate-restricted diets can be attempted more safely, yet additional research is required.
- The risk of ketoacidosis must also be considered when there is high carbohydrate restriction in patients with greatly elevated blood glucose levels. Eight of 18 studies had an upper limit of HbA1c in the inclusion criteria [5-7,10,11,15,25,27], and two studies had extremely high blood glucose levels as exclusion criteria [25,27]. This risk may be exacerbated when SGLT-2i is used [34]. Therefore, attending physicians should be consulted regarding the appropriateness of carbohydrate-restricted diets.
- Another concern is the lack of dietary fiber and micronutrients, such as vitamins, that are relatively abundant in carbohydrate-containing foods [35]. Moreover, a decrease in the proportion of carbohydrates inevitably leads to an increase in fat intake, potentially increasing the intake of saturated fatty acids or trans-fatty acids, which are risk factors for CVD [35]. Therefore, the dietary interventions in most studies were designed to minimize these concerns by, for example, recommending fiber-rich diets and limiting saturated fatty acids to less than 10% or 20%. Accordingly, when implementing the carbohydrate-restricted diets of these recommendations, (1) soft drinks or snacks containing simple sugars should be avoided and replaced with fiber-rich whole grains, and (2) saturated fatty acids or trans-fatty acids should be minimized and replaced with unsaturated fatty acid-rich foods.
- In summary, we should consider the following concerns for carbohydrate-restricted diets especially in VLCDs: (1) short-term gastrointestinal disturbances, such as nausea, vomiting, and constipation; (2) the potential risk of increasing LDL-C levels; (3) the risk of hypoglycemia; (4) the risk of ketoacidosis in patients with very high blood glucose; and (5) the possible lack of dietary fiber and micronutrients along with increased intake of saturated fatty acids. It should be noted that these adverse effects warrant greater caution as the degree of carbohydrate restriction increases.
- Other considerations
- The recently popular “low-carbohydrate high-fat (LCHF) diet” dramatically reduces only the proportion of carbohydrates without calorie restriction and significantly increases total fat and saturated fatty acids [36]. Most studies included in this analysis involved carbohydrate-restricted diets that were implemented simultaneously with calorie restrictions. Therefore, calorie restriction is necessary for maintaining the health benefits of carbohydrate-restricted diets. Furthermore, reductions in carbohydrate intake should not be balanced with larger amounts of saturated fatty acids from activities such as grilling red meat with butter. Instead, a large proportion of the increased total fat intake should be from foods rich in unsaturated fatty acids, such as olive oil or fish. Thus, extreme and unproven dietary regimens like the trendy LCHF diets should be avoided.
- We released recommendations for carbohydrate-restricted diets only for patients with T2DM, not those with T1DM. Five of the 18 studies identified T1DM as an exclusion criterion [7,19-25,28]. Although T1DM was not specified as an exclusion criterion, it can be considered that most participants included in the analysis had T2DM, considering their mean age and duration of diabetes. Moreover, since our analysis aimed to evaluate the benefits and harms of carbohydrate-restricted diets for adults with metabolic syndrome (T2DM, hypertension, overweight, or obesity), T1DM may not be relevant.
- Preparing specific guidelines with experts is essential for the practical and safe implementation of carbohydrate-restricted diets. The ADA suggests a method to control carbohydrate intake that uses plate size and proportions [2,37]. A study conducted among Koreans demonstrated that since most carbohydrate intake in the standard diet of Koreans came from rice, education using a rice bowl that allowed quantification could effectively reduce the intake of carbohydrates, leading to weight loss [38]. Additionally, differences according to the type of carbohydrate intake should be considered. A recent study showed that reducing other foods with carbohydrates, such as soda, sweets, bread, and noodles, was more effective in improving HbA1c levels than reducing rice [39]. Furthermore, in recent years the number of children and adolescents with diabetes has increased sharply [40]. Carbohydrate-restricted diets may be a precious strategy for those in whom the use of drugs must be limited.
RESULTS AND DISCUSSION
How effective are the carbohydrate-restricted diets in improving glycemic control in patients with T2DM?
Do carbohydrate-restricted diets also improve glycemic control in Korean patients with T2DM?
- The meta-analysis and systematic review by our committee confirmed that carbohydrate-restricted diets improve glycemic control and weight loss in adults with T2DM. At the same time, there is a potential risk of harm from elevated LDL-C levels and hypoglycemia in patients with diabetes according to the degree of carbohydrate restriction. Based on these results, we recommend the following: In adults with T2DM, mLCDs, which restrict the proportion of carbohydrates in total energy intake to 10% to 45%, can be considered for improving glycemic control and reducing body weight as they have similar or greater effects on decreasing blood glucose and weight loss when compared to generally recommended diets. However, VLCDs, with less than 10% carbohydrates, are to be avoided for patients with diabetes because the risk of hypoglycemia and elevated LDL-C levels outweighs the benefits of improved glycemic control and weight loss.
CONCLUSIONS
-
CONFLICTS OF INTEREST
No potential conflict of interest relevant to this article was reported.
-
FUNDING
This study was funded by the National Academy of Medicine of Korea (NAMOK) as a research program of the Policy Development Committee.
NOTES
-
Acknowledgements
- None

| Study | Intervention diet | Control diet | No. of subject | %DM patient | Dropout rate, C/Ia | Nation | Age, yr | BW, kg | BMI, kg/m2 | DM duration, yr | HbA1c, % | TG, mg/dL | LDL-C, mg/dL | HDL-C, mg/dL |
|---|---|---|---|---|---|---|---|---|---|---|---|---|---|---|
| Kimura et al. (2018) [5] | MCD | CRD | 48 | 100% | 4.3%/4% | Japan | 64.8 | 62.8 | 24.8 | 12.2 | 7.0 | 140.3 | 114.4 | 60.5 |
| Larsen et al. (2011) [6] | MCD | HCD | 99 | 100% | 2.2%/9.4% | Australia | 57.2 | 95.0 | NA | 8.7 | 7.8 | 210.8 | 95.1 | 46.2 |
| Liu et al. (2018) [7] | MCD | SD | 122 | 100% | 16.3%/16.3% | China | 50.4 | 58.5 | 21.4 | 0.0 (new) | 7.1 | 116.9 | 79.9 | 56.7 |
| Wang et al. (2018) [8] | MCD | LFD | 48 | 100% | 4.3%/4% | China | 64.8 | 62.8 | 24.8 | 12.2 | 7.0 | 140.3 | 114.4 | 60.5 |
| Chen et al. (2020) [9] | LCD | SD | 85 | 100% | 6.7%/8.5% | Taiwan | 63.5 | 69 | 26.9 | 9.9 | 8.6 | 170.7 | 103.4 | 45.4 |
| Daly et al. (2006) [10] | LCD | LFD | 102 | 100% | 27.5%/27.5% | UK | 58.7 | 102 | 36.1 | NA | 9.1 | 224.1 | NA | 46.8 |
| Davis et al. (2009) [11] | LCD | LFD | 105 | 100% | 12%/14.6% | USA | 53.5 | 97.1 | 36.0 | NA | 7.5 | 124 | 94.8 | 48.4 |
| Guldbrand et al. (2012) [12], Jonasson et al. (2014) [13] | LCD | LFD | 61 | 100% | 10%/13% | Sweden | 62.0 | 95.2 | 32.7 | 9.3 | 7.3 | 155.3 | 97.7 | 42.6 |
| Morris et al. (2020) [14] | LCD | SD | 33 | 100% | 8.3%/0% | UK | 67.0 | 101 | 35.4 | 9.2 | 7.7 | 172.7 | NA | 45.2 |
| Perna et al. (2019) [15] | LCD | CRD | 17 | 100% | 0% | Bahrain | 63.9 | 85.3 | 31.4 | NA | 6.0 | 156.5 | 100.2 | 47.4 |
| Sato et al. (2017) [16] | LCD | CRD | 66 | 100% | 3%/9% | Japan | 59.5 | 73.8 | 26.6 | 13.5 | 8.2 | 145.5 | 99.3 | 45.3 |
| Shai et al. (2008) [17], Yokose et al. (2020) [18] | LCD | LFD | 213 (36a) | 16.9% | 9.6%/22.0% | Israel | NA | 91.4 | 30.9 | NA | NA | 170.8 | 119 | 38.5 |
| Struik et al. (2020) [19], Wycherley et al. (2016) [20], Tay et al. (2015) [21], Tay et al. (2018) [22], Tay et al. (2014) [23] | LCD | LFD | 115 | 100% | 18%/21% | Australia | 58.0 | 101.6 | 34.6 | 8.0 | 7.3 | 132.9 | 92.8 | 51 |
| Dyson et al. (2007) [24] | VLCD | CRD | 26 | 65% | 28.6%/0% | UK | 52.0 | 96.3 | 35.1 | NA | 6.6 | 131.1 | 119.9 | 51 |
| Goday et al. (2016) [25] | VLCD | CRD | 89 | 100% | 18.2%/11.1% | Spain | 54.5 | 90.5 | 33.1 | NA | 6.9 | 155.2 | 106.3 | 53 |
| Goldstein et al. (2011) [26] | VLCD | CRD | 52 | 100% | 38.5%/46.2% | Israel | 56.0 | 92 | 33.2 | 8.0 | 8.9 | 200.5 | NA | 44 |
| Iqbal et al. (2010) [27] | VLCD | LFD | 144 | 100% | 43%/60% | USA | 60.0 | 116.9 | 37.5 | NA | 7.7 | 161.1 | 107.7 | 40.7 |
| Saslow et al. (2017) [28] | VLCD | LFD | 34 | 50% | 16.7%/12.5% | USA | 59.7 | 98.6 | 36.4 | 7.0 | 6.8 | 132.4 | 93.7 | 47 |
DM, diabetes mellitus; C/I, control/intervention group; BW, body weight; BMI, body mass index; HbA1c, glycosylated hemoglobin; TG, triglyceride; LDL-C, low-density lipoprotein cholesterol; HDL-C, high-density lipoprotein cholesterol; MCD, moderately-low-diet; CRD, calorie-restricted diet; HCD, high-carbohydrate diet; SD, standard diet; LFD, low fat diet; LCD, low-carbohydrate diet; NA, not available; VLCD, very-low-carbohydrate diet.
a Number of patients with diabetes among total subjects.
| Outcomes |
Illustrative comparative effectsa (95% CI) |
No. of participants | Quality of the evidence (GRADE) | ||
|---|---|---|---|---|---|
|
Assumed effect |
Corresponding effects |
||||
| Control | mLCD | Mean difference | |||
| HbA1c, % (follow-up: 8–24 weeks) | –0.20 | –0.41 | –0.21 (–0.32 to –0.10) | 758 (10 studies) | Moderate |
| HOMA-IR (follow-up: 8–24 weeks) | –0.40 | –0.93 | –0.53 (–0.96 to –0.11) | 248 (3 studies) | Low |
| Fasting glucose, mg/dL (follow-up: 8–24 weeks) | 4.65 | –5.23 | –9.88 (–18.04 to –1.71) | 337 (6 studies) | Low |
| Body weight, kg (follow-up: 8–24 weeks) | –1.45 | –2.99 | –1.54 (–3.11 to 0.02) | 619 (8 studies) | Low |
| Systolic blood pressure, mm Hg (follow-up: 8–24 weeks) | –0.25 | –3.24 | –2.99 (–5.48 to –0.49) | 510 (6 studies) | Moderate |
| Diastolic blood pressure, mm Hg (follow-up: 8–24 weeks) | 0.55 | –0.52 | –1.07 (–2.43 to 0.29) | 513 (6 studies) | Low |
| Triglycerides, mg/dL (follow-up: 8–24 weeks) | –4.00 | –21.22 | –17.22 (–34.27 to –0.18) | 742 (10 studies) | Low |
| LDL-C, mg/dL (follow-up: 8–24 weeks) | –3.60 | –3.25 | 0.35 (–3.03 to 3.72) | 607 (8 studies) | Low |
| HDL-C, mg/dL (follow-up: 8–24 weeks) | 0.20 | 2.50 | 2.30 (0.23 to 4.37) | 547 (8 studies) | Moderate |
| Hypoglycemia | There is no study directly evaluated the risk of hypoglycemia. Patients at high risk of hypoglycemia were excluded in 2 out of 13 studies. | ||||
mLCD for type 2 diabetes mellitus; Patient or population: patients with type 2 diabetes mellitus; Intervention: mLCD.
GRADE Working Group grades of evidence: High quality (Further research is very unlikely to change our confidence in the estimate of effect); Moderate quality (Further research is likely to have an important impact on our confidence in the estimate of effect and may change the estimate); Low quality (Further research is very likely to have an important impact on our confidence in the estimate of effect and is likely to change the estimate); Very low quality (We are very uncertain about the estimate).
mLCD, moderately-low-carbohydrate or low-carbohydrate diet; CI, confidence interval; GRADE, Grading of Recommendations Assessment, Development and Evaluation; HbA1c, glycosylated hemoglobin; HOMA-IR, homeostatic model assessment for insulin resistance; LDL-C, low-density lipoprotein cholesterol; HDL-C, high-density lipoprotein cholesterol.
a The assumed effect is the mean change of outcomes compared to baseline in the control group. The corresponding effects are the mean change of outcomes compared to baseline in the intervention group and the mean difference (and its 95% CI) between control and intervention group.
| Outcomes |
Illustrative comparative effectsa (95% CI) |
No. of participants | Quality of the evidence (GRADE) | ||
|---|---|---|---|---|---|
|
Assumed effect |
Corresponding effects |
||||
| Control | VLCD | Mean difference | |||
| HbA1c, % (follow-up: 8–24 weeks) | –0.20 | –0.56 | –0.36 (–0.54 to –0.19) | 321 (5 studies) | Moderate |
| HOMA-IR (follow-up: 8–24 weeks) | –0.45 | –1.52 | –1.07 (–3.13 to 0.98) | 119 (2 studies) | Low |
| Fasting glucose, mg/dL (follow-up: 8–24 weeks) | –17.20 | –26.84 | –9.64 (–19.54 to 0.26) | 267 (3 studies) | Low |
| Body weight, kg (follow-up: 8–24 weeks) | –3.40 | –7.24 | –3.84 (–7.55 to –0.13) | 291 (4 studies) | Moderate |
| Systolic blood pressure, mm Hg (follow-up: 8–24 weeks) | –1.70 | –1.36 | 0.34 (–3.61 to 4.28) | 218 (3 studies) | Low |
| Diastolic blood pressure, mm Hg (follow-up: 8–24 weeks) | –2.50 | –1.12 | 1.38 (–0.90 to 3.67) | 218 (3 studies) | Low |
| Triglycerides, mg/dL (follow-up: 8–24 weeks) | –15.70 | –27.10 | –11.40 (–27.01 to 4.22) | 313 (5 studies) | Low |
| LDL-C, mg/dL (follow-up: 8–24 weeks) | –1.35 | 5.84 | 7.19 (0.02 to 14.36) | 277 (4 studies) | Moderate |
| HDL-C, mg/dL (follow-up: 8–24 weeks) | 2.30 | 2.73 | 0.43 (–1.98 to 2.84) | 312 (5 studies) | Low |
| Hypoglycemia | Although no study directly evaluated the risk of hypoglycemia, patients at high risk of hypoglycemia were excluded in 4 out of 5 studies. | ||||
VLCD for type 2 diabetes mellitus; Patient or population: patients with type 2 diabetes mellitus; Intervention: VLCD.
GRADE Working Group grades of evidence: High quality (Further research is very unlikely to change our confidence in the estimate of effect); Moderate quality (Further research is likely to have an important impact on our confidence in the estimate of effect and may change the estimate); Low quality (Further research is very likely to have an important impact on our confidence in the estimate of effect and is likely to change the estimate); Very low quality (We are very uncertain about the estimate).
VLCD, very-low-carbohydrate diet; CI, confidence interval; GRADE, Grading of Recommendations Assessment, Development and Evaluation; HbA1c, glycosylated hemoglobin; HOMA-IR, homeostatic model assessment for insulin resistance; LDL-C, low-density lipoprotein cholesterol; HDL-C, high-density lipoprotein cholesterol.
a The assumed effect is the mean change of outcomes compared to baseline in the control group. The corresponding effects are the mean change of outcomes compared to baseline in the intervention group and the mean difference (and its 95% CI) between control and intervention group.
|
Energy, kcal/day |
Carbohydrate, g/day |
Fat, g/day |
Protein, g/day |
|||||||||||||||
|---|---|---|---|---|---|---|---|---|---|---|---|---|---|---|---|---|---|---|
| Baseline | <6 mo | 6 mo–1 yr | >1 yr | Baseline | <6 mo | 6 mo–1 yr | >1 yr | Baseline | <6 mo | 6 mo–1 yr | >1 yr | Baseline | <6 mo | 6 mo–1 yr | >1 yr | |||
| mLCD | Chen et al. (2020) [9] | Control | 1,776.1 | 1,463.2 | 238.2 | 151.1 | 64.3 | 67.2 | 73.2 | 72.0 | ||||||||
| Intervention | 1,735.5 | 1,424.8 | 244.1 | 88.0 | 56.7 | 73.1 | 70.9 | 82.4 | ||||||||||
| Differencea | –38.5 | –63.1 | 5.9 | 10.4 | ||||||||||||||
| Daly et al. (2006) [10] | Control | 168.6 | 52.4 | 59.9 | ||||||||||||||
| Intervention | 1,290.0 | 109.5 | 57.5 | 68.1 | ||||||||||||||
| Differencea | –144.0 | –59.1 | 5.1 | 8.2 | ||||||||||||||
| Davis et al. (2009) [11] | Control | 1,863.0 | 1,653.0 | 1,810.0 | 191.9 | 198.8 | 226.7 | 80.3 | 56.6 | 61.9 | 72.3 | 67.8 | 68.4 | |||||
| Intervention | 1,983.0 | 1,652.0 | 1,642.0 | 217.6 | 138.4 | 137.1 | 79.5 | 78.9 | 80.1 | 77.3 | 74.3 | 74.5 | ||||||
| Differencea | –1.0 | –168.0 | –60.4 | –89.6 | 22.4 | 18.2 | 6.6 | 6.1 | ||||||||||
| Guldbrand et al. (2012) [12] | Control | 1,802.1 | 1,547.1 | 1,576.0 | 1,453.3 | 216.3 | 189.5 | 185.2 | 170.8 | 64.1 | 49.9 | 54.3 | 50.1 | 68.5 | 65.0 | 63.0 | 58.1 | |
| Intervention | 1,683.6 | 1,378.8 | 1,432.6 | 1,246.2 | 172.6 | 86.2 | 96.7 | 96.6 | 73.0 | 75.1 | 74.8 | 60.9 | 64.0 | 68.8 | 65.9 | 59.8 | ||
| Differencea | –168.3 | –143.3 | –207.1 | –103.3 | –88.5 | –74.2 | 25.2 | 20.5 | 10.9 | 3.8 | 2.9 | 1.7 | ||||||
| Kimura et al. (2018) [5] | Control | 1,661.3 | 1,725.6 | 232.8 | 212.8 | 47.6 | 47.0 | 68.3 | 63.1 | |||||||||
| Intervention | 1,548.4 | 1,513.8 | 200.2 | 194.9 | 47.4 | 52.3 | 68.4 | 66.2 | ||||||||||
| Differencea | –211.8 | –17.9 | 5.3 | 3.1 | ||||||||||||||
| Larsen et al. (2011) [6] | Control | 2,184.5 | 1,435.5 | 1,578.1 | 248.5 | 175.8 | 190.2 | 79.6 | 46.7 | 56.1 | 88.7 | 59.7 | 59.7 | |||||
| Intervention | 2,118.3 | 1,535.5 | 1,586.7 | 234.9 | 155.1 | 165.8 | 75.8 | 51.4 | 54.1 | 89.1 | 86.6 | 84.2 | ||||||
| Differencea | 100.0 | 8.6 | –20.7 | –24.4 | 4.6 | –2.0 | 26.9 | 24.5 | ||||||||||
| Liu et al. (2018) [7] | Control | 1,805.3 | 1,739.4 | 229.7 | 226.7 | 58.6 | 54.6 | 73.6 | 74.9 | |||||||||
| Intervention | 1,803.0 | 1,789.6 | 233.8 | 172.8 | 56.1 | 56.4 | 68.2 | 134.1 | ||||||||||
| Differencea | 50.2 | –53.8 | 1.7 | 59.1 | ||||||||||||||
| Morris et al. (2020) [14] | Not available | |||||||||||||||||
| Perna et al. (2019) [15] | Control | 1,566.0 | 241.0 | 42.3 | 74.3 | |||||||||||||
| Intervention | 1,570.0 | 125.0 | 81.4 | 87.1 | ||||||||||||||
| Differencea | 4.0 | –116.0 | 39.1 | 12.8 | ||||||||||||||
| Sato et al. (2017) [16] | Control | 1,686.0 | 1,605.0 | 211.0 | 198.0 | 54.0 | 52.0 | 61.0 | 63.0 | |||||||||
| Intervention | 1,729.0 | 1,371.0 | 223.0 | 149.0 | 54.0 | 52.0 | 64.0 | 64.0 | ||||||||||
| Differencea | –234.0 | –49.0 | 0.0 | 1.0 | ||||||||||||||
| Shai et al. (2008) [17]b | Control | –458.3 | –559.1 | –572.6 | –69.1 | –83.4 | –82.8 | –14.7 | –18.0 | –18.9 | –12.8 | –16.7 | –19.8 | |||||
| Intervention | –560.8 | –591.1 | –550.0 | –123.6 | –127.7 | –129.8 | –3.6 | –4.8 | –1.7 | –10.2 | –11.8 | –6.9 | ||||||
| Differencea | –102.5 | –32.0 | 22.6 | –54.5 | –44.3 | –47.0 | 11.1 | 13.2 | 17.2 | 2.6 | 4.9 | 12.9 | ||||||
| Tay et al. (2014) [23] | Control | 1,628.0 | 1,708.0 | 1,757.0 | 209.0 | 216.0 | 216.0 | 45.0 | 50.0 | 55.0 | 75.0 | 77.0 | 79.0 | |||||
| Intervention | 1,596.0 | 1,683.0 | 1,707.0 | 60.0 | 74.0 | 83.0 | 98.0 | 100.0 | 98.0 | 103.0 | 106.0 | 105.0 | ||||||
| Differencea | –32.0 | –25.0 | –50.0 | –149.0 | –142.0 | –133.0 | 53.0 | 50.0 | 43.0 | 28.0 | 29.0 | 26.0 | ||||||
| Wang et al. (2018) [8] | Control | 1,768.8 | 1,731.5 | 230.6 | 242.6 | 60.2 | 49.2 | 60.7 | 63.5 | |||||||||
| Intervention | 1,796.0 | 1,808.0 | 237.2 | 173.8 | 59.9 | 84.8 | 61.3 | 70.1 | ||||||||||
| Differencea | 76.5 | –68.8 | 35.6 | 6.6 | ||||||||||||||
| VLCD | Dyson et al. (2007) [24] | Control | 2,130.00 | 1,593.00 | 223.2 | 167.3 | 92.5 | 62.7 | 95.2 | 79.5 | ||||||||
| Intervention | 1,313.0 | 56.8 | 69.3 | 97.2 | ||||||||||||||
| Differencea | –280.0 | –110.5 | 6.6 | 17.7 | ||||||||||||||
| Goday et al. (2016) [25] | Not available | |||||||||||||||||
| Goldstein et al. (2011) [26] | Control | 2,599.0 | 1,909.0 | 1,937.0 | 248.0 | 190.0 | 208.0 | 128.0 | 87.0 | 85.0 | 119.0 | 91.0 | 90.0 | |||||
| Intervention | 2,261.0 | 1,721.0 | 1,725.0 | 213.0 | 93.0 | 85.0 | 112.0 | 109.0 | 111.0 | 105.0 | 96.0 | 102.0 | ||||||
| Differencea | –188.0 | –212.0 | –97.0 | –123.0 | 22.0 | 26.0 | 5.0 | 12.0 | ||||||||||
| Iqbal et al. (2010) [27] | Control | 2,144.1 | 1,733.8 | 1,628.2 | 1,573.5 | 231.6 | 181.6 | 175.0 | 183.7 | 93.1 | 70.5 | 65.9 | 58.6 | 75.9 | 73.2 | 66.1 | 55.4 | |
| Intervention | 2,007.0 | 1,806.2 | 1,659.5 | 1,609.9 | 201.2 | 159.8 | 167.2 | 192.8 | 88.8 | 85.7 | 65.6 | 61.2 | 77.1 | 70.4 | 66.7 | 54.4 | ||
| Differencea | 72.4 | 31.3 | 36.4 | –21.8 | –7.8 | 9.1 | 15.2 | –0.2 | 2.6 | –2.7 | 0.6 | –1.0 | ||||||
| Saslow et al. (2017) [28] | Control | 2,063.1 | 1,483.5 | 1,681.1 | 184.4 | 160.7 | 149.8 | 86.3 | 55.8 | 75.4 | 91.4 | 82.4 | 68.8 | |||||
| Intervention | 1,954.1 | 1,589.4 | 1,534.8 | 176.2 | 44.1 | 73.7 | 79.2 | 101.4 | 105.4 | 82.7 | 92.2 | 97.6 | ||||||
| Differencea | 105.9 | –146.3 | –116.6 | –76.1 | 45.6 | 30.0 | 9.8 | 28.8 | ||||||||||
- 1. Hur KY, Moon MK, Park JS, Kim SK, Lee SH, Yun JS, et al. 2021 Clinical practice guidelines for diabetes mellitus of the Korean Diabetes Association. Diabetes Metab J 2021;45:461-81.ArticlePubMedPMCPDF
- 2. Evert AB, Dennison M, Gardner CD, Garvey WT, Lau KH, MacLeod J, et al. Nutrition therapy for adults with diabetes or prediabetes: a consensus report. Diabetes Care 2019;42:731-54.ArticlePubMedPMCPDF
- 3. Choi JH, Cho YJ, Kim HJ, Ko SH, Chon S, Kang JH, et al. Effect of carbohydrate-restricted diets and intermittent fasting on obesity, type 2 diabetes mellitus, and hypertension management: consensus statement of the Korean Society for the Study of Obesity, Korean Diabetes Association, and Korean Society of Hypertension. Diabetes Metab J 2022;46:355-76.ArticlePubMedPMCPDF
- 4. Soh SM, Chung SJ, Yoon J. Dietary and health characteristics of Korean Adults according to the level of energy intake from carbohydrate: analysis of the 7th (2016-2017) Korea National Health and Nutrition Examination Survey data. Nutrients 2020;12:429.ArticlePubMedPMC
- 5. Kimura M, Kondo Y, Aoki K, Shirakawa J, Kamiyama H, Kamiko K, et al. A randomized controlled trial of a mini low-carbohydrate diet and an energy-controlled diet among Japanese patients with type 2 diabetes. J Clin Med Res 2018;10:182-8.ArticlePubMedPMC
- 6. Larsen RN, Mann NJ, Maclean E, Shaw JE. The effect of high-protein, low-carbohydrate diets in the treatment of type 2 diabetes: a 12 month randomized controlled trial. Diabetologia 2011;54:731-40.ArticlePubMedPDF
- 7. Liu K, Wang B, Zhou R, Lang HD, Ran L, Wang J, et al. Effect of combined use of a low-carbohydrate, high-protein diet with omega-3 polyunsaturated fatty acid supplementation on glycemic control in newly diagnosed type 2 diabetes: a randomized, double-blind, parallel-controlled trial. Am J Clin Nutr 2018;108:256-65.ArticlePubMed
- 8. Wang LL, Wang Q, Hong Y, Ojo O, Jiang Q, Hou YY, et al. The effect of low-carbohydrate diet on glycemic control in patients with type 2 diabetes mellitus. Nutrients 2018;10:661.ArticlePubMedPMC
- 9. Chen CY, Huang WS, Chen HC, Chang CH, Lee LT, Chen HS, et al. Effect of a 90 g/day low-carbohydrate diet on glycaemic control, small, dense low-density lipoprotein and carotid intima-media thickness in type 2 diabetic patients: an 18-month randomised controlled trial. PLoS One 2020;15:e0240158.ArticlePubMedPMC
- 10. Daly ME, Paisey R, Paisey R, Millward BA, Eccles C, Williams K, et al. Short-term effects of severe dietary carbohydrate-restriction advice in type 2 diabetes: a randomized controlled trial. Diabet Med 2006;23:15-20.ArticlePubMed
- 11. Davis NJ, Tomuta N, Schechter C, Isasi CR, Segal-Isaacson CJ, Stein D, et al. Comparative study of the effects of a 1-year dietary intervention of a low-carbohydrate diet versus a low-fat diet on weight and glycemic control in type 2 diabetes. Diabetes Care 2009;32:1147-52.ArticlePubMedPMCPDF
- 12. Guldbrand H, Dizdar B, Bunjaku B, Lindstrom T, Bachrach-Lindstrom M, Fredrikson M, et al. In type 2 diabetes, randomisation to advice to follow a low-carbohydrate diet transiently improves glycaemic control compared with advice to follow a low-fat diet producing a similar weight loss. Diabetologia 2012;55:2118-27.ArticlePubMedPMC
- 13. Jonasson L, Guldbrand H, Lundberg AK, Nystrom FH. Advice to follow a low-carbohydrate diet has a favourable impact on low-grade inflammation in type 2 diabetes compared with advice to follow a low-fat diet. Ann Med 2014;46:182-7.ArticlePubMedPMC
- 14. Morris E, Aveyard P, Dyson P, Noreik M, Bailey C, Fox R, et al. A food-based, low-energy, low-carbohydrate diet for people with type 2 diabetes in primary care: a randomized controlled feasibility trial. Diabetes Obes Metab 2020;22:512-20.ArticlePubMedPMCPDF
- 15. Perna S, Alalwan TA, Gozzer C, Infantino V, Peroni G, Gasparri C, et al. Effectiveness of a hypocaloric and low-carbohydrate diet on visceral adipose tissue and glycemic control in overweight and obese patients with type 2 diabetes. Bahrain Med Bull 2019;41:159-64.
- 16. Sato J, Kanazawa A, Makita S, Hatae C, Komiya K, Shimizu T, et al. A randomized controlled trial of 130 g/day low-carbohydrate diet in type 2 diabetes with poor glycemic control. Clin Nutr 2017;36:992-1000.ArticlePubMed
- 17. Shai I, Schwarzfuchs D, Henkin Y, Shahar DR, Witkow S, Greenberg I, et al. Weight loss with a low-carbohydrate, Mediterranean, or low-fat diet. N Engl J Med 2008;359:229-41.ArticlePubMed
- 18. Yokose C, McCormick N, Rai SK, Lu N, Curhan G, Schwarzfuchs D, et al. Effects of low-fat, Mediterranean, or low-carbohydrate weight loss diets on serum urate and cardiometabolic risk factors: a secondary analysis of the Dietary Intervention Randomized Controlled Trial (DIRECT). Diabetes Care 2020;43:2812-20.ArticlePubMedPMCPDF
- 19. Struik NA, Brinkworth GD, Thompson CH, Buckley JD, Wittert G, Luscombe-Marsh ND. Very low and higher carbohydrate diets promote differential appetite responses in adults with type 2 diabetes: a randomized trial. J Nutr 2020;150:800-5.ArticlePubMedPDF
- 20. Wycherley TP, Thompson CH, Buckley JD, Luscombe-Marsh ND, Noakes M, Wittert GA, et al. Long-term effects of weight loss with a very-low carbohydrate, low saturated fat diet on flow mediated dilatation in patients with type 2 diabetes: a randomised controlled trial. Atherosclerosis 2016;252:28-31.ArticlePubMed
- 21. Tay J, Luscombe-Marsh ND, Thompson CH, Noakes M, Buckley JD, Wittert GA, et al. Comparison of low- and high-carbohydrate diets for type 2 diabetes management: a randomized trial. Am J Clin Nutr 2015;102:780-90.ArticlePubMed
- 22. Tay J, Thompson CH, Luscombe-Marsh ND, Wycherley TP, Noakes M, Buckley JD, et al. Effects of an energy-restricted low-carbohydrate, high unsaturated fat/low saturated fat diet versus a high-carbohydrate, low-fat diet in type 2 diabetes: a 2-year randomized clinical trial. Diabetes Obes Metab 2018;20:858-71.ArticlePubMedPDF
- 23. Tay J, Luscombe-Marsh ND, Thompson CH, Noakes M, Buckley JD, Wittert GA, et al. A very low-carbohydrate, low-saturated fat diet for type 2 diabetes management: a randomized trial. Diabetes Care 2014;37:2909-18.ArticlePubMedPDF
- 24. Dyson PA, Beatty S, Matthews DR. A low-carbohydrate diet is more effective in reducing body weight than healthy eating in both diabetic and non-diabetic subjects. Diabet Med 2007;24:1430-5.ArticlePubMed
- 25. Goday A, Bellido D, Sajoux I, Crujeiras AB, Burguera B, Garcia-Luna PP, et al. Short-term safety, tolerability and efficacy of a very low-calorie-ketogenic diet interventional weight loss program versus hypocaloric diet in patients with type 2 diabetes mellitus. Nutr Diabetes 2016;6:e230.ArticlePubMedPMCPDF
- 26. Goldstein T, Kark JD, Berry EM, Adler B, Ziv E, Raz I. The effect of a low carbohydrate energy-unrestricted diet on weight loss in obese type 2 diabetes patients: a randomized controlled trial. E Spen Eur E J Clin Nutr Metab 2011;6:e178-86.Article
- 27. Iqbal N, Vetter ML, Moore RH, Chittams JL, Dalton-Bakes CV, Dowd M, et al. Effects of a low-intensity intervention that prescribed a low-carbohydrate vs. a low-fat diet in obese, diabetic participants. Obesity (Silver Spring) 2010;18:1733-8.ArticlePubMedPDF
- 28. Saslow LR, Daubenmier JJ, Moskowitz JT, Kim S, Murphy EJ, Phinney SD, et al. Twelve-month outcomes of a randomized trial of a moderate-carbohydrate versus very low-carbohydrate diet in overweight adults with type 2 diabetes mellitus or prediabetes. Nutr Diabetes 2017;7:304.ArticlePubMedPMCPDF
- 29. Cui Z, Dibley MJ. Trends in dietary energy, fat, carbohydrate and protein intake in Chinese children and adolescents from 1991 to 2009. Br J Nutr 2012;108:1292-9.ArticlePubMedPMC
- 30. Wu SJ, Pan WH, Yeh NH, Chang HY. Trends in nutrient and dietary intake among adults and the elderly: from NAHSIT 1993-1996 to 2005-2008. Asia Pac J Clin Nutr 2011;20:251-65.PubMed
- 31. Sakurai M, Nakamura K, Miura K, Takamura T, Yoshita K, Nagasawa SY, et al. Dietary carbohydrate intake, presence of obesity and the incident risk of type 2 diabetes in Japanese men. J Diabetes Investig 2016;7:343-51.ArticlePubMedPMCPDF
- 32. Morieri ML, Avogaro A, Fadini GP; the DARWIN-T2D Network of the Italian Diabetes Society. Cholesterol lowering therapies and achievement of targets for primary and secondary cardiovascular prevention in type 2 diabetes: unmet needs in a large population of outpatients at specialist clinics. Cardiovasc Diabetol 2020;19:190.ArticlePubMedPMCPDF
- 33. Hall KD, Guo J, Courville AB, Boring J, Brychta R, Chen KY, et al. Effect of a plant-based, low-fat diet versus an animal-based, ketogenic diet on ad libitum energy intake. Nat Med 2021;27:344-53.ArticlePubMedPDF
- 34. Blau JE, Tella SH, Taylor SI, Rother KI. Ketoacidosis associated with SGLT2 inhibitor treatment: analysis of FAERS data. Diabetes Metab Res Rev 2017;33:e2924.ArticlePubMedPMCPDF
- 35. Ley SH, Hamdy O, Mohan V, Hu FB. Prevention and management of type 2 diabetes: dietary components and nutritional strategies. Lancet 2014;383:1999-2007.ArticlePubMedPMC
- 36. Kaminski M, Skonieczna-Zydecka K, Nowak JK, Stachowska E. Global and local diet popularity rankings, their secular trends, and seasonal variation in Google Trends data. Nutrition 2020;79-80:110759.ArticlePubMed
- 37. Bowen ME, Cavanaugh KL, Wolff K, Davis D, Gregory RP, Shintani A, et al. The diabetes nutrition education study randomized controlled trial: a comparative effectiveness study of approaches to nutrition in diabetes self-management education. Patient Educ Couns 2016;99:1368-76.ArticlePubMedPMC
- 38. Ahn HJ, Han KA, Jang JY, Lee JH, Park KS, Min KW. Small rice bowl-based meal plan for energy and marcronutrient intake in Korean men with type 2 diabetes: a pilot study. Diabetes Metab J 2011;35:273-81.ArticlePubMedPMC
- 39. Haimoto H, Watanabe S, Maeda K, Murase T, Wakai K. Reducing carbohydrate from individual sources has differential effects on glycosylated hemoglobin in type 2 diabetes mellitus patients on moderate low-carbohydrate diets. Diabetes Metab J 2021;45:390-403.ArticlePubMedPMCPDF
- 40. Chae J, Seo MY, Kim SH, Park MJ. Trends and risk factors of metabolic syndrome among Korean adolescents, 2007 to 2018. Diabetes Metab J 2021;45:880-9.ArticlePubMedPMCPDF
REFERENCES
Figure & Data
References
Citations
- Efficacy of convenience meal-type foods designed for diabetes in the management of metabolic syndrome based on a 3-week trial
Do Gyeong Lee, In Gyeong Kang, Tae Seok Kim, Yun Ahn, Sang Yun Lee, Hye Jin Ahn, Yoo Kyoung Park
Nutrition.2024; 118: 112287. CrossRef - Long-Term Results of a Digital Diabetes Self-Management and Education Support Program Among Adults With Type 2 Diabetes: A Retrospective Cohort Study
Ashley Berthoumieux, Sarah Linke, Melinda Merry, Alison Megliola, Jessie Juusola, Jenna Napoleone
The Science of Diabetes Self-Management and Care.2024; 50(1): 19. CrossRef - Medical nutrition therapy for diabetes mellitus
Suk Chon
Journal of the Korean Medical Association.2023; 66(7): 421. CrossRef
 PubReader
 ePub Link
 Cite
Cite