Relative Skeletal Muscle Mass Is Associated with Development of Metabolic Syndrome
Article information
Abstract
Background
Visceral adiposity is related to insulin resistance. Skeletal muscle plays a central role in insulin-mediated glucose disposal; however, little is known about the association between muscle mass and metabolic syndrome (MS). This study is to clarify the clinical role of skeletal muscle mass in development of MS.
Methods
A total of 1,042 subjects were enrolled. Subjects with prior MS and chronic diseases were excluded. After 24 months, development of MS was assessed using NCEP-ATP III criteria. Skeletal muscle mass (SMM; kg), body fat mass (BFM; kg), and visceral fat area (VFA; cm2) were obtained from bioelectrical analysis. Then, the following values were calculated as follows: percent of SMM (SMM%; %): SMM (kg)/weight (kg), skeletal muscle index (SMI; kg/m2): SMM (kg)/height (m2), skeletal muscle to body fat ratio (MFR): SMM (kg)/BFM (kg), and skeletal muscle to visceral fat ratio (SVR; kg/cm2): SMM (kg)/VFA (cm2).
Results
Among 838 subjects, 88 (10.5%) were newly diagnosed with MS. Development of MS increased according to increasing quintiles of BMI, SMM, VFA, and SMI, but was negatively associated with SMM%, MFR, and SVR. VFA was positively associated with high waist circumference (WC), high blood pressure (BP), dysglycemia, and high triglyceride (TG). In contrast, MFR was negatively associated with high WC, high BP, dysglycemia, and high TG. SVR was negatively associated with all components of MS.
Conclusion
Relative SMM ratio to body composition, rather than absolute mass, may play a critical role in development of MS and could be used as a strong predictor.
INTRODUCTION
The incidence of metabolic syndrome (MS) is increasing worldwide. MS refers to a collection of metabolic abnormalities, including visceral obesity, hyperglycemia, dyslipidemia, and hypertension. It is known as a predisease state and leads to increased risk of cardiovascular disease, type 2 diabetes mellitus, and cancer.
The predominant characteristic of MS is insulin resistance [1] and the most prevalent form of MS is associated with abdominal obesity, especially when accompanied by deposition of visceral adipose tissue [2]. Visceral fat is closely linked to insulin resistance and chronic metabolic disease.
Skeletal muscle comprises a large percentage of body mass and is the most abundant insulin-sensitive tissue [3]. It also plays an important role in maintenance of systemic glucose metabolism [4]. Therefore, loss of skeletal muscle mass (SMM) and skeletal muscle resistance to insulin associated with the aging process or obesity may be fundamental to metabolic dysregulation and may contribute to the development of MS [5]. Potential mechanisms contributing to reduced insulin signaling and action in skeletal muscle include adipose tissue expansion and increased levels of inflammatory adipokines, increased renin-angiotensin-aldosterone system activity, decreased muscle mitochondrial oxidative capacity, increased intramuscular lipid accumulation, and increased levels of reactive oxygen species [5].
Methods for estimating body composition, including SMM and body fat mass (BFM), should be valid and reliable. Bioelectrical analysis (BIA) has recently become a widely accepted method for estimation of body composition and is relatively simple, quick, and noninvasive [6]. Eight-polar BIA offers valid and accurate estimates of total and appendicular body composition when validated against DXA [7].
This study was performed to clarify the clinical role of SMM in development of MS using different anthropometric parameters estimated by multifrequency bioelectrical impedance analysis.
METHODS
Study design
This study is a retrospective cohort study of 1,042 subjects ranging in age from 20 to 75 years old who visited the Yeungnam University Health Promotion Center from June 1, 2008 to June 30, 2010. Clinical data, including demographic factors, past medical history, laboratory findings, and anthropometric parameters were collected at baseline. Twenty-four months after baseline, metabolic parameters and development of MS were assessed. Mean total follow-up period was 28.7±5.4 months. Preexisting MS was excluded. Chronic diseases that can affect SMM were also excluded, including severe anemia (hemoglobin <8 mg/dL), chronic kidney disease (serum creatinine >1.5 mg/dL), abnormal liver function test (total bilirubin, direct bilirubin, aspartate aminotransferase, or alanine aminotransferase >2 folds of upper normal limits), and abnormal tumor markers (α-fetoprotein >15 mg/mL, carbohydrate antigen 19-9 >37 U/mL, carcinoembryonic antigen >10 mg/mL, prostate specific antigen >4 mg/mL in male, or cancer antigen 125 >35 U/mL in female). After excluding 204 subjects, 838 subjects (mean age, 46.9±9.9 years; male:female, 477:361) were included in the study. Study protocol was approved by the Institutional Review Board of Yeungnam University Medical Center. Because this was a retrospective study, the board deemed it exempt from informed consent requirements.
Analytical methods
Height, body weight (BW), and waist circumference (WC) were measured and body mass index (BMI) was calculated by dividing the weight (kg) with height square (m2). WC was measured using a soft tape midway between the lowest rib and the iliac crest while participants were standing. Systolic and diastolic BPs were measured using a standard sphygmomanometer after at least 10 minutes of rest. Blood was drawn for evaluation of metabolic, biochemical, and hematological parameters after overnight fasting for 10 to 12 hours. Fasting plasma glucose (FPG), total cholesterol (TC), triglyceride (TG), and high density lipoprotein cholesterol (HDL-C) were measured using the hexokinase method (AU 5400 Autoanalyser; Olympus, Tokyo, Japan). Low density lipoprotein cholesterol (LDL-C) levels were calculated according to the Friedewald formula. Hemoglobin A1c (HbA1c) was measured using high performance liquid chromatography (HLC-723 G7; Tosoh Corp., Tokyo, Japan) according to the standardized Diabetes Control and Complications Trial assay.
Measurement of anthropometric parameters using body impedance analysis
Bioelectrical impedance was estimated using InBody 720 (Biospace Inc., Seoul, Korea), a multifrequency BIA device, after overnight fasting for at least 8 hours. Study subjects were instructed to stand upright and grasp the handles of the analyzer, thereby putting both palms, thumbs, and anterior and posterior aspects of each sole of the foot in contact an 8-polar tactile-electrode. Impedance values for five segments (arms, trunk, and legs) were measured at frequencies of 1, 5, 20, 50, 500, and 1,000 kHz through the 8-polar tactile-electrode. Based on these impedance values, SMM (kg), total BFM (kg), and visceral fat area (VFA) at the umbilicus level (cm2) were calculated. Skeletal muscle parameters based on these variables were defined as follows, in order to estimate not only of the effect of absolute SMM but also the effect of relative ratio to body composition:
Percent of SMM (SMM%, %): SMM (kg)/weight (kg)
Skeletal muscle index (SMI, kg/m2): SMM (kg)/height (m2)
Skeletal muscle to body fat ratio (MFR): SMM (kg)/BFM (kg)
Skeletal muscle to visceral fat ratio (SVR, kg/cm2): SMM (kg)/VFA (cm2)
Definition of metabolic syndrome
MS was defined based on the modified NCEP-ATP III criteria [8] as any combination of three or more of the following components: 1) abdominal obesity (WC ≥90 cm in males and ≥80 cm in females) based on adjusted Asian-Pacific waist circumference criterion; 2) elevated BP (≥130 mm Hg systolic pressure or ≥85 mm Hg diastolic pressure), or treatment of previously diagnosed hypertension; 3) elevated FPG (≥100 mg/dL) or treatment of diabetes; 4) elevated TG (≥150 mg/dL), or specific treatment for this lipid abnormality; and 5) reduced HDL-C (<40 mg/dL in males and <50 mg/dL in females).
Statistical analysis
Subjects were divided into two groups: those who had developed MS and those who had not developed MS during a 2-year follow-up period. Clinical and anthropometric data are expressed as mean±standard deviation. Comparisons of continuous variables between groups with and without MS were performed using Student t-test. All anthropometric parameters were described in quintiles (data are not shown). Multivariate logistic regression analysis was used to estimate the effects of each anthropometric parameter on development of MS. Odds ratios (ORs) of MS in the fifth quintile were estimated using the first quintile for reference. ORs adjusted for age and gender are presented with 95% confidence intervals (CIs). All statistical analyses were performed using the statistical package for SPSS version 20.0 for Windows (IBM Co., Armonk, NY, USA) with a 5% significance level (P<0.05).
RESULTS
Baseline characteristics
Baseline characteristics are shown in Table 1. Among 838 subjects, 88 subjects (10.5%) developed MS during the 2-year follow-up period. Older males were more prevalent in the MS group compared to the group without MS. Subjects in the MS group had poorer metabolic status (higher BMI, WC, BP, FPG, HbA1c, TC, TG, and LDL-C and lower HDL-C) at baseline than subjects without MS. SMM, BFM, VFA, and SMI were significantly higher in subjects with MS; however, SMM%, MFR, and SVR were significantly higher in subjects without MS.
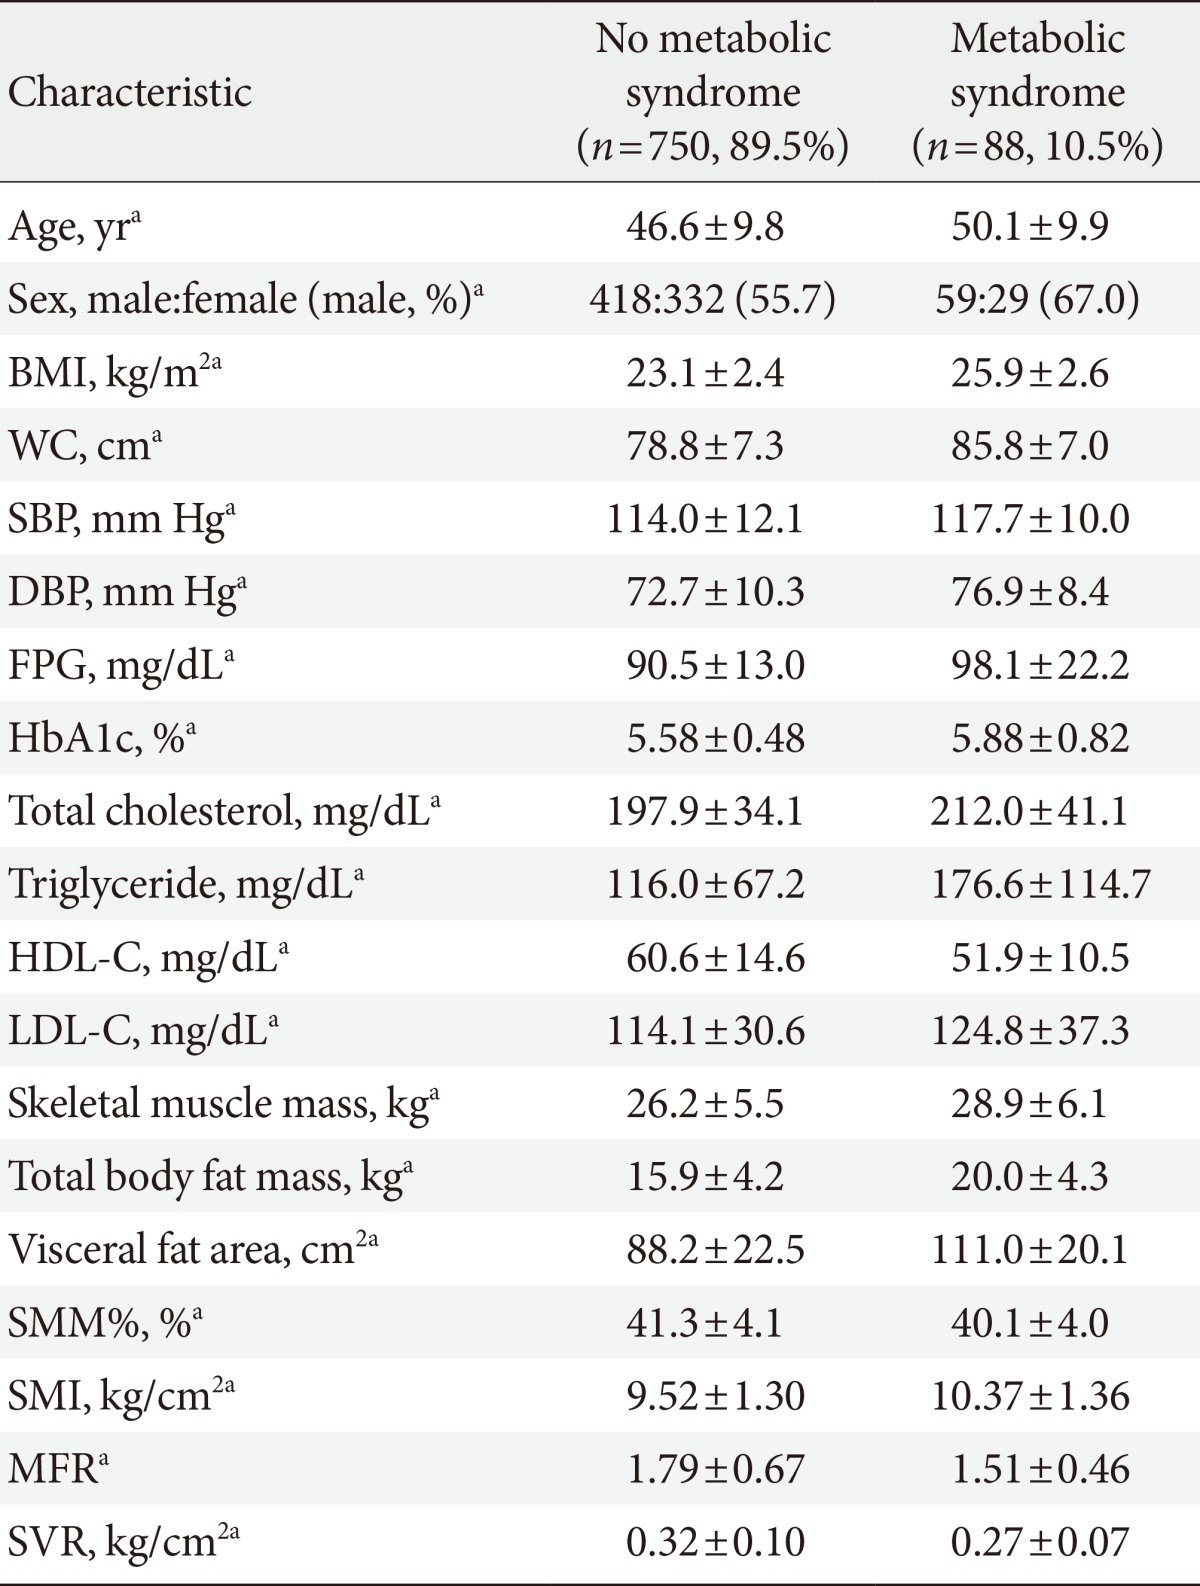
Baseline characteristics of all subjects according to development or no development of metabolic syndrome
Proportions of each quintile in subjects with metabolic syndrome
The proportions of each quintile of various anthropometric parameters in subjects with MS are shown in Fig. 1. The fifth quintile of MFR, SMM%, and SVR accounted for the smallest proportion in subjects with MS. In contrast, the fifth quintile of BMI, SMM, VFA, and SMI accounted for the largest proportion in subjects with MS.
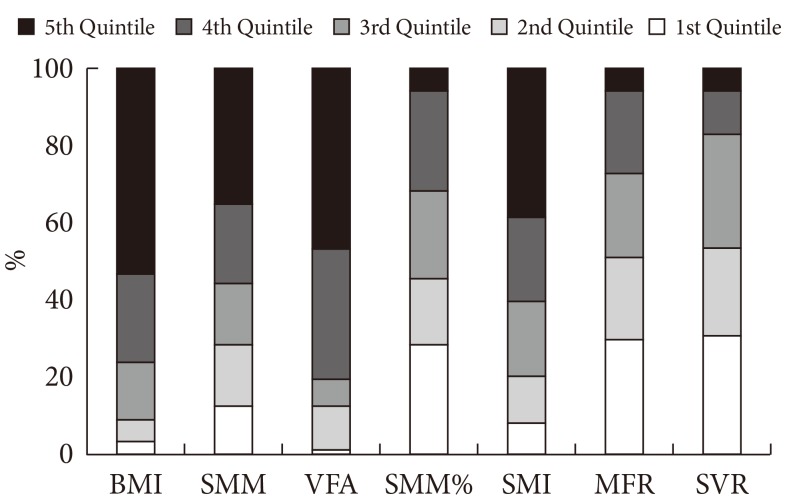
Proportions of each quintile in subjects with metabolic syndrome according to various anthropometric parameters. The fifth quintile of percent of skeletal muscle mass (SMM%), skeletal muscle to body fat ratio (MFR), and skeletal muscle to visceral fat ratio (SVR) accounted for the smallest proportion in subjects with metabolic syndrome. BMI, body mass index; VFA, visceral fat area; SMI, skeletal muscle index.
Effects of skeletal muscle mass on development of metabolic syndrome
The risk of developing MS increased with increasing quintiles of BMI (OR, 2.24; 95% CI, 1.80 to 2.80), SMM (OR, 1.88; 95% CI, 1.38 to 2.55), VFA (OR, 2.56; 95% CI, 1.98 to 3.32), and SMI (OR, 2.18; 95% CI, 1.63 to 2.92), but was negatively associated with increasing quintiles of SMM% (OR, 0.51; 95% CI, 0.40 to 0.65), MFR (OR, 0.49; 95% CI, 0.39 to 0.62), and SVR (OR, 0.62; 95% CI, 0.49 to 0.77) (Table 2).
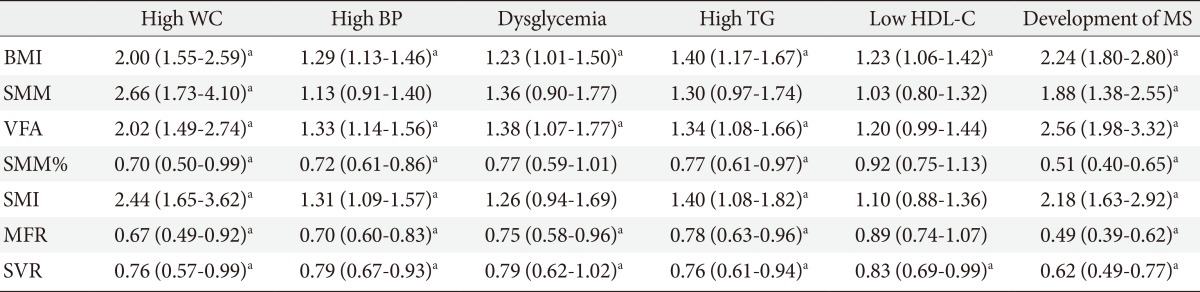
Odds ratios and 95% confidence intervals for each component of metabolic syndrome and development of metabolic syndrome according to increasing quintiles of each anthropometric parameter
ORs for each component of MS according to quintiles of each anthropometric parameter are also shown in Table 2. SMM was positively associated only with high WC (OR, 2.66; 95% CI, 1.73 to 4.10), while SMI was positively associated with high WC (OR, 2.44; 95% CI, 1.65 to 3.62), high BP (OR, 1.31; 95% CI, 1.09 to 1.57), and high TG (OR, 1.40; 95% CI, 1.08 to 1.82). In contrast, SMM% was negatively associated with high WC (OR, 0.7; 95% CI, 0.50 to 0.99), high BP (OR, 0.72; 95% CI, 0.61 to 086), and high TG (OR, 0.77; 95% CI, 0.61 to 0.97). Both SMI and SMM% showed no significant association with dysglycemia or low HDL-C. VFA showed a positive association with components of MS, including high WC (OR, 2.02), high BP (OR, 1.33), dysglycemia (OR, 1.38), and high TG (OR, 1.34). The exception was low HDL-C, which was not significantly associated with VFA. In contrast, MFR showed a significant negative association with high WC (OR, 0.6), high BP (OR, 0.7), dysglycemia (OR, 0.75), and high TG (OR, 0.78), but not low HDL-C. SVR was negatively associated with all components of MS, including high WC (OR, 0.76), high BP (OR, 0.79), dysglycemia (OR, 0.79), high TG (OR, 0.76), and low HDL-C (OR, 0.83).
Among subjects who did not develop MS, the number of components of MS significantly decreased in the fifth quintile of SVR, compared to the first quintile of SVR (OR, 0.47; 95% CI, 0.24 to 0.92) (Table 3).
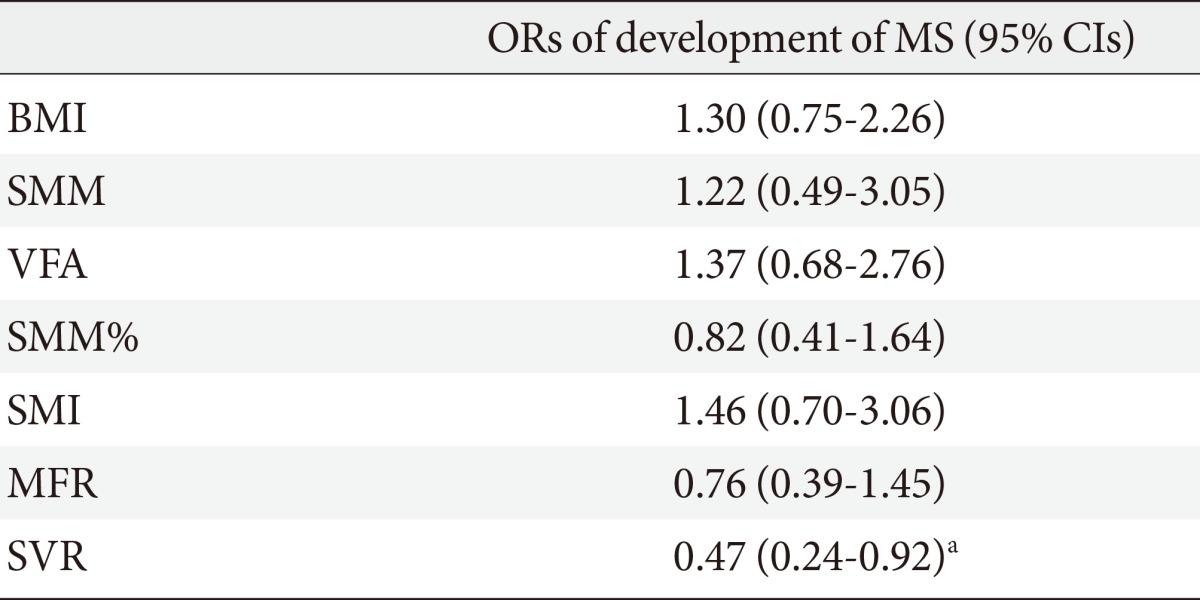
Odds ratios and 95% confidence intervals of increase in the number of components of metabolic syndrome in the fifth quintile of each anthropometric parameter reference to the first quintile among subjects who did not develop metabolic syndrome
DISCUSSION
This study showed that higher SMM%, MFR, and SVR, which are indicative of relative muscle mass, reduced the risk of high BP, dysglycemia, and high TG, in addition to reducing the development of MS.
MS and associated morbidities include dyslipidemia, hypertension, type 2 diabetes mellitus, and nonalcoholic steatohepatitis, which are known as insulin resistance syndrome. Skeletal muscle is the most abundant insulin-sensitive tissue and plays a crucial role in maintenance of systemic glucose metabolism, accounting for 85% of all insulin-mediated glucose utilization [1]. However, adipose tissue expansion is associated with ectopic lipid accumulation in the skeletal muscle, liver, and kidneys, as well as elevation of inflammatory adipokines and reactive oxygen species. These likely contribute to impaired insulin signaling and action in skeletal muscle, resulting in development of MS [5].
Some recent studies have reported an association between skeletal muscle and MS. Londono et al. [9] demonstrated an inverse association between thigh muscle mass and MS and a direct association between chest muscle perimeter and MS. Atlantis et al. [10] also reported that low muscle mass and low strength were the strongest risk factors for MS, independent of abdominal fat, and other factors. However, in this study, the absolute total amount of SMM (i.e., SMM) was positively associated with risk of developing MS, which conflicts with the aforementioned studies. Like SMM, SMI was positively associated with MS. These results may be caused by total BFM, including VFA, which often increases with SMM [11]. In fact, in this study, BFM had a significant positive correlation with SMM and height (data not shown).
Newman et al. [11] compared two different approaches to defining sarcopenic obesity using appendicular lean mass divided by height squared and appendicular lean mass adjusted for both height and BFM. They assessed the relationship between these two definitions of sarcopenic obesity and lower extremity function and other health-related factors. They found that the classification based on both height and fat mass was more strongly associated with lower extremity functional limitations and suggested that fat mass should be considered when estimating sarcopenia in overweight or obese individuals [11]. According to the Korean Longitudinal Study on Health and Aging, the ratio of lower appendicular SMM to weight was more closely associated with MS than either sarcopenia or obesity alone [12]. The Korean Sarcopenic Obesity Study also reported that the muscle to fat ratio (appendicular SMM to VFA), which was defined as a new index of sarcopenic obesity, was negatively associated with MS (OR, 5.43; 95% CI, 2.56 to 13.34) [13,14]. The Third National Health and Nutrition Examination found that the highest quintile of SMI (the ratio of total SMM to total BW) was associated with improved insulin sensitivity and lower risk of transitional/pre- or overt diabetes [15]. Findings in the present study were similar to the aforementioned studies: higher SMM%, MFR, and SVR, which are indicative of relative muscle mass, were found to reduce the risk of high BP, dysglycemia, and high TG, resulting in reduced development of MS. These results suggest that relative SMM ratio to body composition (particularly body fat) is more important than absolute amount of SMM in development of MS.
In addition, among subjects who did not develop MS, the number of components of MS increased in subjects in the lowest quintile of SVR. This suggests that proportion of SMM may play a role in the early progression to MS and could also support the importance of relative SMM in development of MS.
Among the anthropometric parameters, BMI and SVR were associated with all five components of MS. On the other hand, among components of MS, only high WC, which is a fundamental component of MS, was significantly associated with all of the anthropometric parameters.
Although retrospective, this study was a cohort study, and thus showed a more powerful causal relationship between SMM and development of MS in comparison with most previously reported cross-sectional studies. In addition, the effect of SMM on development of MS was investigated using ratio of SMM to weight, total BFM, and VFA. This study showed that the relative ratio of SMM to body composition is important in development of MS.
Anthropometric parameters were estimated using BIA. Computed tomography (CT) and magnetic resonance imaging (MRI) are reference methods for assessment of SMM [16]. Dual-energy X-ray absorptiometry (DXA), which is well correlated with CT and MRI, has been proposed for analysis of body composition, due to its lower cost and higher availability [17-19]. However, it has a limitation in that different densitometers and software versions give different estimates of body composition. In addition, DXA, as well as CT and MRI, cannot be employed for population studies, mainly because of logistical problems [7]. In contrast, BIA offers a simpler and more rapid means of estimating SMM, with less radiation exposure risk than DXA [6,7]. Therefore, it is probably the better candidate for assessment of SMM at the population level.
Modified NCEP-ATP III criteria, rather than international diabetes federation (IDF) criteria, were used for defining MS because it has been reported that central obesity is less prevalent in Koreans than Caucasians and the IDF criteria are inferior to the modified NCEP criteria in identifying high-risk patients who lack central obesity [20].
This study has some limitations. This was a retrospective study and the follow-up period was relatively short. Physical activities that may affect SMM were not taken into account [21,22]. Muscle strength, which is a factor in insulin sensitivity of skeletal muscle, was not taking into account either [10].
In conclusion, decreased SMM may play a critical role in the development of MS and may have some synergic effects on increased visceral fat. Therefore, relative ratio to body composition, not absolute amount of SMM, may be more predictive and important to the development of MS.
Notes
No potential conflict of interest relevant to this article was reported.